Selected Previous Publications
In this guide
In this guide14. The selected publications represent the existing guidance offered by both EFSA and the US EPA regarding implementation and recommended best practices for BMD modelling in chemical risk assessment, with specific reference to their respective BMD software, PROAST and BMDS. EFSA have published a number of opinions on BMD modelling since 2009 and although the US EPA have not published their own opinion document, their preferred practices can be inferred from their 2012 Technical Guidance Document for the application of their BMDS Benchmark Dose software.
EFSA 2005 - Opinion of the Scientific Committee on a request from EFSA related to A Harmonised Approach for Risk Assessment of Substances which are both Genotoxic and Carcinogenic
15. In 2005, EFSA’s Scientific Committee (SC) proposed a harmonised approach for risk assessments for substances that have both genotoxic and carcinogenic properties. EFSA expressed reservations about extrapolating from the typically high doses of genotoxic and carcinogenic substances to much lower levels to which humans are occasionally exposed.
16. EFSA noted that the selection of mathematical model was crucial and could lead to wide variation in the predicted threshold for safety. This often led to differing conclusions for the same substance, depending on the model chosen. They also noted that such approaches had little basis in rationality, as it was often unknown if the model chosen reflected the underlying biological processes.
17. EFSA recommended using a margin of exposure (MOE) approach using a reliable RP for the substance under consideration. They recommended the use of BMD modelling as a reliable means to obtain an RP. They concluded that BMD modelling was the superior approach as it used all the information obtained over the range of doses in the dataset chosen from which to establish the health-based guidance value. EFSA further recommended the use of the BMDL10 which would represent an estimate of the lowest dose which is 95% certain to cause no more than a 10% cancer incidence in rodents (EFSA, 2005).
EFSA 2009 - Guidance of the Scientific Committee on Use of the benchmark dose approach in risk assessment
18. In their 2009 guidance, EFSA considered the utility and practical application of BMD as a generalised tool for risk assessment. They concluded, that since BMD incorporates all the available dose-response data and provides a quantification of uncertainties in the dose-response, a BMD approach represents a scientifically more advanced method compared to the traditional NOAEL approach for deriving a RP. They also noted that while the BMD approach had occasionally been employed in risk assessments up to that point, no systematic approach to the use of the BMD existed.
19. EFSA reconfirmed both their view that an MOE approach was the most appropriate for risk assessment of substances that are both genotoxic and carcinogenic (EFSA, 2005) and the use of the BDML as the generally accepted RP. More generally, for chemical risk assessment, EFSA proposed that a default Benchmark response (BMR) value of 10% be used for quantal data and 5% for continuous data from animal studies, although this default BMR may be modified based on statistical or toxicological considerations.
20. EFSA rejected the suggestion that larger or additional uncertainty factors are needed if the BMDL is used as the RP. They concluded that HBGVs derived from the BMDL are expected to be as protective as those from the NOAEL approach, on average over many risk assessments. EFSA concluded that it was not necessary to repeat previous evaluations of safety using the new BMD approach. They concluded, based on similar reasoning, that the BMD and NOAEL would be, on average, as protective as one another over many risk assessments.
21. EFSA also recommended that any future updates to test guidelines, such as the OECD guidelines, should include a consideration of the BMD approach.
US EPA 2012 - Benchmark Dose (BMDS) Technical Guidance Document
22. In their 2012 document, the US EPA technical panel presented step-by-step guidance for the understanding and application of existing BMD methods in risk assessment. This included guidance on evaluating studies and endpoint types suitable for modelling, selecting appropriate BMR levels, model fitting and BMD computation, judging the fit of the model, and calculating the BMDL. Finally, the document provided several demonstrations of BMD and BMDL derivations from scientific data.
23. The guidance discussed general approaches for selecting the BMR levels but stopped short of recommending any particular value for the BMR being modelled. Instead, it recommended a flexible approach based on thorough consideration of the statistical and biological characteristics of the dataset and the applications for which the resulting BMDs/BMDLs will be used. The guidance recommended that selections be made on a case-by-case basis, and justification should be provided for each BMR selection. For quantal data however it suggested an extra risk of 10% as the BMR for standard reporting (to serve as a basis for comparisons across chemicals and endpoints). This is because the 10% response is near the limit of sensitivity in most cancer bioassays and in some noncancer bioassays.
24. Similarly, the guidance recommended a case-by-case approach for choosing an appropriate model or models to use in computing the BMD. In the absence of information about the biological basis of the dose response relationship, the document provides guidance on model selection and model fitting, as well as information on determining goodness-of-fit, and comparing models to decide which to use for obtaining the BMD and BMDL. The guidance provided general recommendations, including that α = 0.1 be used to compute the critical value for goodness-of-fit and that a graphical display of the model fit be examined as well. For comparison of models and selection of the model to use for BMD computation, the use of Akaike’s Information Criterion (AIC) is recommended.
25. The document does not advocate the use of any one software package. A discussion of the preferred computational algorithms is intended however, to provide users a computational or statistical basis to make an informed choice in the selection of software. It is recommended that software with well-documented methodology be used, such as the EPA’s BMDS package, from which it also provides worked example for the purpose of practical demonstration.
26. Reporting recommendations from the BMD/BMDL calculations are also discussed. This guidance lists several reporting recommendations for the BMD and BMDL. Finally, the guidance provided a generalised workflow and decision tree that can be adapted and implemented for the purpose of chemical risk assessment (Figure 2). A flow chart is provided to help visualise how the BMD approach fits within a larger risk assessment framework. In addition, a section outlining a “decision tree” is intended to guide the user in choosing the most appropriate BMD approach for their particular data and risk assessment.
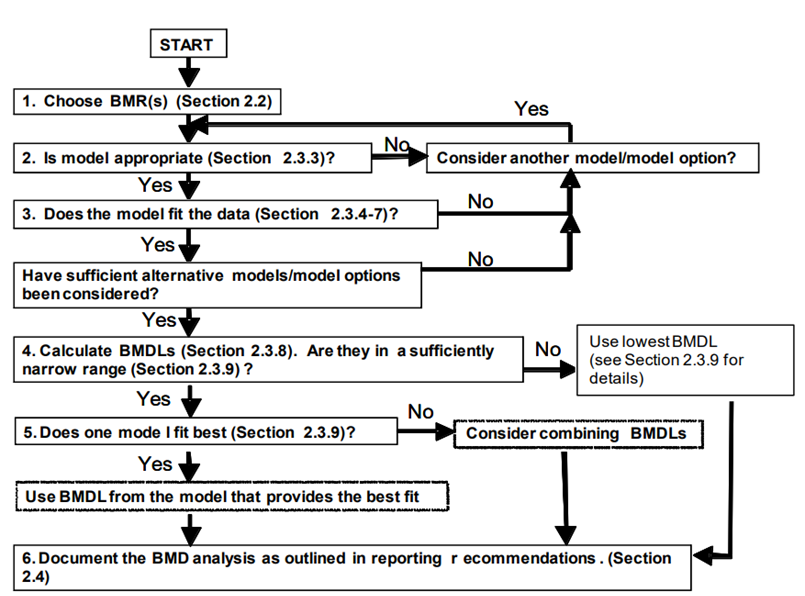
Decision tree summarising the generalised step-by-step approach to calculate the BMD and associated confidence intervals and BMDL. The tree is shown in black and white.
Figure 2. Decision tree summarising the generalised step-by-step approach to calculate the BMD and associated confidence intervals and BMDL (Image from US EPA, 2012).
EFSA 2017 - Update: use of the benchmark dose approach in risk assessment
27. EFSA’s 2017 document is an update of the 2009 guidance, informed by user experience with BMD application in regulatory risk assessment, and includes the latest methodological developments in BMD modelling. The update confirms many of the recommendations laid out in the 2009 guidance. EFSA reconfirmed their view that a BMD approach is a scientifically more advanced method compared to the NOAEL for identifying the RP and that HBGVs based on a BMD approach are expected to be as protective as those based on the NOAEL approach.
28. The most significant updates concern the application of the BMD approach in practice. Most notable are the developments in model averaging capabilities which EFSA now recommend as the preferred method for calculating the BMD confidence interval. A flowchart and worked examples have been inserted in this update to guide the reader step-by-step when performing a BMD analysis (Figure 3), as well as a chapter on the distributional part of dose-response models (DRM) and a template for reporting a BMD analysis in a complete and transparent manner.
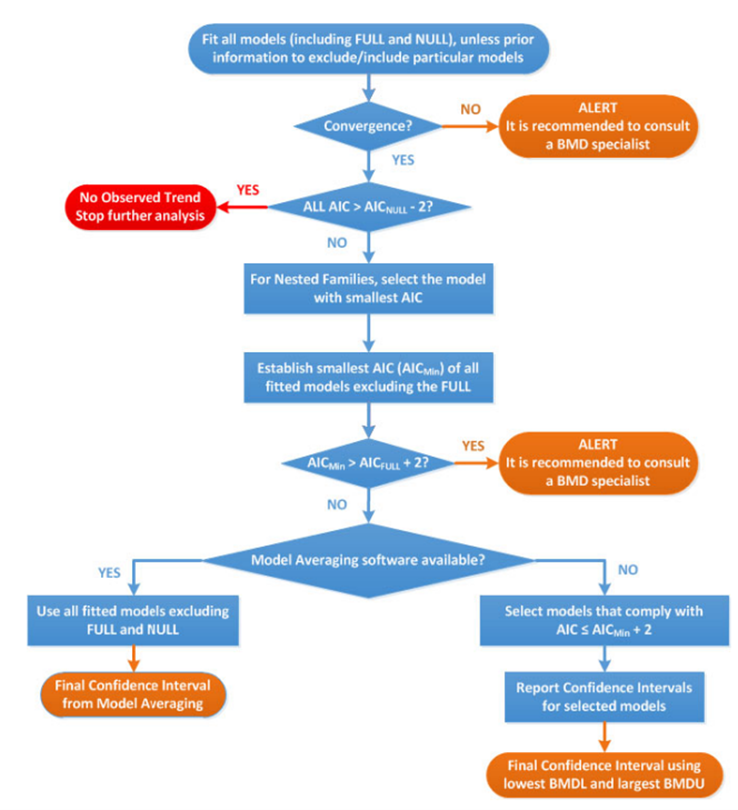
Flow chart to establish BMD confidence interval and BMDL for dose-response data set of a specified endpoint. The flow chart is in blue, red and orange. The text is written in white, blue, red and orange.
Figure 3. Flow chart to establish BMD confidence interval and BMDL for dose-response data set of a specified endpoint. AIC: Akaike information criterion; AICnull: AIC value of the Null Model; AICfull: AIC value of the Full Model; AICmin: AIC value of the model with the lowest AIC value, the null and full models being excluded (Image taken from EFSA, 2017).
29. The set of available default models has been reviewed and updated. For continuous data, both the exponential and Hill family of models are recommended (4 models total). For quantal data, 8 models are recommended: Logistic, Probit, Log-logistic, Log-probit, Weibull, Gamma, linearised multistage models (LMS) (two-stage) model and the Latent variable models (LVMs). To assess the relative goodness of fit of different mathematical models to the dose-response data set, the Akaike information criterion (AIC) is now the recommend approach.
30. EFSA propose that a BMD approach can be applied to all chemicals in food, independent of the nature or source. They conclude that the BMD modelling is also appropriate for dose-response data from epidemiological studies, although no explicit guidance is provided for this (EFSA, 2017).
EFSA 2022 - Guidance on the use of the benchmark dose approach in risk assessment
31. In 2022, EFSA published new guidance which considered the most recent developments in BMD modelling and aimed to better align EFSA’s approach with internationally agreed concepts and approaches.
32. EFSA reconfirmed its guidance and reasoning, set out in 2009 and 2017, regarding the recommendation of the BMD approach in chemical risk assessment. The set of default models for BMD analysis has been reviewed and updated, allowing a single set of models to be used for both quantal and continuous data. Model averaging is again recommended as the preferred method for evaluating the results from the choice of available models.
33. Of most significance is EFSAs recommendation to change from a frequentist to a Bayesian paradigm. Confidence and significance levels are replaced, in the Bayesian approach, by probability distributions attached to unknown modelling parameters. Credible intervals replace the frequentist use of confidence intervals. EFSA note that the Bayesian method allows the model to be updated with new or existing knowledge, allowing it to “mimic a learning process”. Finally, the step-by-step guidance and flowchart for BMD analysis has been updated in light of these changes, and a chapter comparing the frequentist and Bayesian paradigms has been inserted (EFSA, 2022).