User experience
In this guide
In this guideBMDExpress3
105. BMDExpress3 is a software tool designed for the benchmark dose analyses of genomic data. The software application is designed to perform a stepwise analysis to identify the subset of genes that demonstrate significant dose-response behaviour (Yang et al., 2007).
106. Before use, the software must be downloaded and installed onto the desktop (Releases · auerbachs/BMDExpress-3 (github.com). No account or sign up is required and step-by-step guidance on the setup and use of the software is available (How to Use the Application · auerbachs/BMDExpress-3 Wiki · GitHub ). The application has been developed significantly since its first release and software can be configured to look for the most up to date version available when starting each time to ensure the latest functionalities are available for the user.
Data Input
107. Gene expression data from human liver spheroids were analysed using BMDExpress3 and the dose response relationship analysed using the suite of in-built DRMs. The software can handle a range of data types; however, the data must be formatted correctly as the software only accepts tab delimited text files as input with correctly labelled columns and rows (see Figure 6). It was the users experience that log-transforming the data was preferable and recommended.
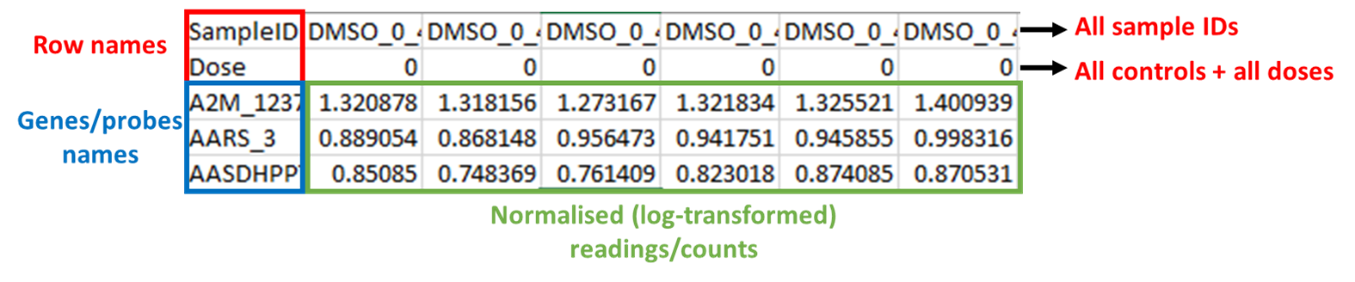
Example of formatted input data for BMDExpress3. Figure 6 shows a table of data with labels. The table has black text. Cells are outlined in red, blue, green and black. The table is labelled in different coloured text, blue red, green and black. On the right side of the table next to the top row are 2 black arrows pointing right with red text next to them. The red text reads: All Sample ID's and All controls+ all doses. The labels of the table are: Red top left: Row names. Blue bottom left: Genes/probes names. Green bottom centre: Normalised (log - transformed) readings/counts.
Figure 6. Example of formatted input data for BMDExpress3. Files must be saved as tab delimited excel files and the columns must be arranged as shown in the figure. The first row contains SampleIDs, the second row contains assigned dose (or concentration) levels, and all probes/genes/ metabolites are contianed in the third row onwards. Readings/counts must be normalised (log-transformed) before entry.
108. After preparing the data to import into BMDExpress3, the user can select the most appropriate platform for their data, as the software recognises some of the most used formats available. For this study, the appropriate platform was “BioSpyder S1500_Plus_Plus_Human_2.0 191113”.
Model Selection and operation
109. All of the dose-response curve fit models utilized by BMDExpress are those contained within USEPA BMDS software (Benchmark Dose Tools | US EPA). US EPA, 2022). A full discussion of these models is provided in Annex B. The user can select Power, Exponential, Hill and Linear models. The user can set the benchmark response to be a percentage or standard deviation when compared to controls and there is a graphical user interface and accompanying tutorial available showing how to work with dose- and concentration-response data (Benchmark Dose Analysis · auerbachs/BMDExpress-3 Wiki · GitHub).
110. The BMDExpress software also allows the option to flag Hill Models with ‘k’ Parameter < [selected value]. This allows the user to specify that if the Hill model is selected as one of the models to fit the data, it will be flagged if its ‘k’ parameter is smaller than the lowest positive dose, or a fraction (1/2, or 1/3) of the lowest positive dose (Annex B). As discussed in “Constraining or not constraining the models” section above, this option is included since the Hill model may provide unrealistic BMD and BMDL values for certain dose response curves, even when it provides the lowest AIC value. Once flagged the user can then choose a range of options including whether to include or exclude the flagged model or models from the final analysis.
111. When analysing the results, the user can filter data using their set of criteria; in this case study the following rules were used to ensure minimised uncertainty and maximise the confidence in the identification of genes exhibiting concentration-response relationships:
Custom settings employed in this study were as follows:
- ·K < 1/3, to flag Hill models
- BMR (benchmark response) = 1 SD
- 250 iterations
- Post-modelling filters to exclude low quality data:
§ Data were excluded if the BMD > highest concentration of test compound used in the in vitro experiments.
§ Data were excluded if the BMDU/BMDL ≥ 40 (as this indicated a high degree of uncertainty about the BMD and resulting RP.
§ Data were excluded if the p < 0.1.
Data output and visualisation
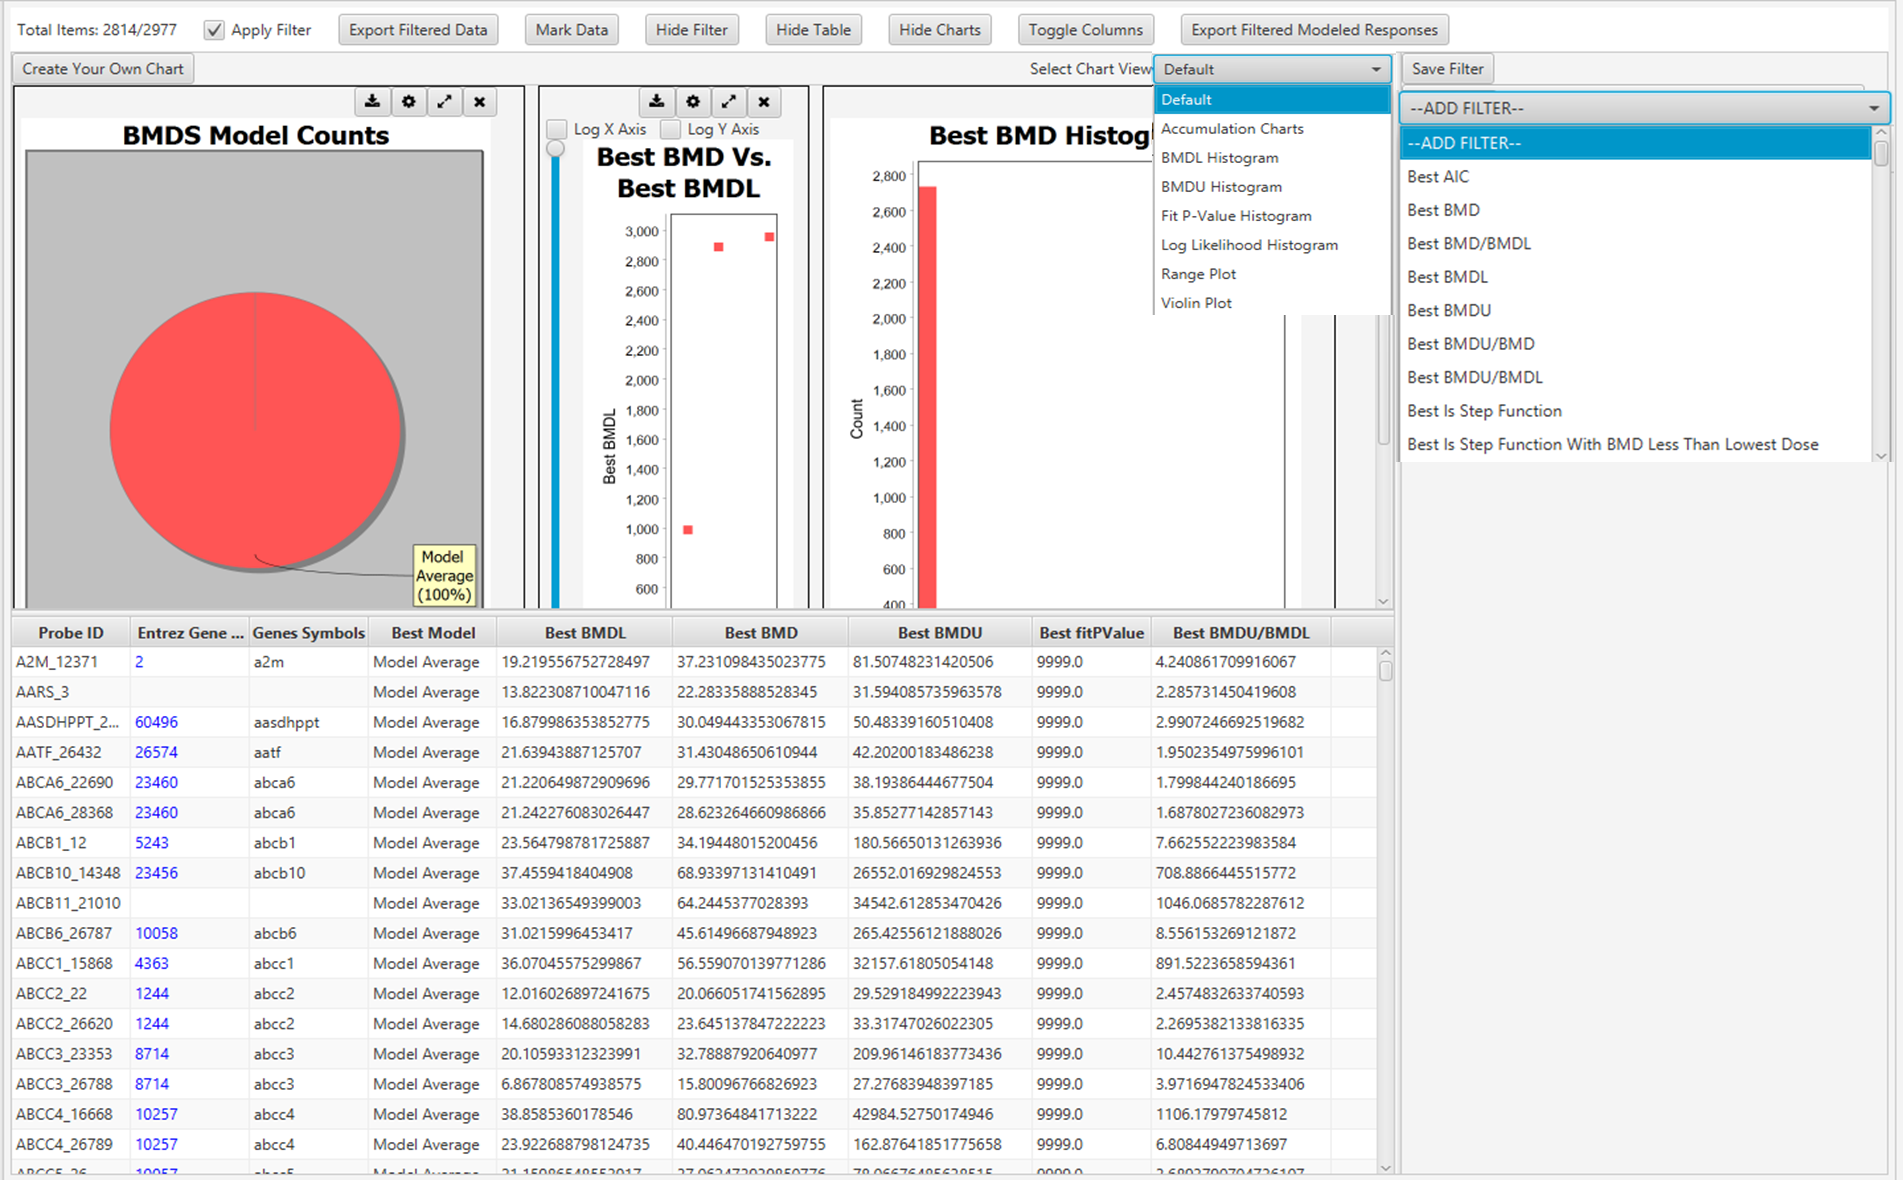
112. The main screen of BMDExpress3 interface displays the assembled BMD analysis result for all genes modelled. The user has a range of options to interact with the results table and customise visualisation e.g., toggling columns on/off, adding filter criteria, marking selected data, and selecting or creating their charts to represent the data (Figure 7). The results can be readily exported as a tab delimited file that is compatible with other spreadsheet editors (MS Excel, LibreOffice Calc, etc.).
Graphical user interface of BMDExpress3 showing BMD analysis. The figure shows a screenshot of the programme in use.
Figure 7. Graphical user interface of BMDExpress3 showing BMD analysis. Each row represents a Probe ID that was previously imported into the software (see Figure 6).
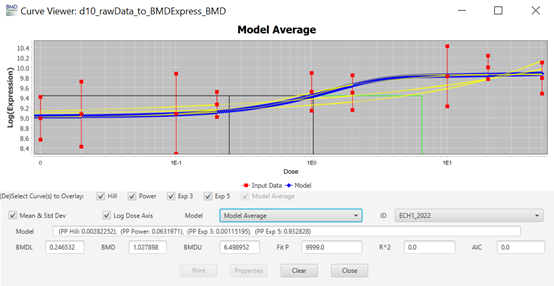
113. Each row (“Entrez Gene ID") on the main screen (Figure 7) is clickable and will open a new window named “Curve Viewer” (Figure 8). The Curve Viewer interface provides both visual and numerical outputs for the BMD modelling operation. Users are provided with a plot of the experimental data and superimposed model fits along with the model average. The user can choose to open a drop-down list and select other available models to inspect their respective plots. Likewise, the user can click over the Probe ID (ECH1_2022) to open a drop-down list and access other Probes (experimental data sets) to inspect their models and plots. The chart can be edited (title, axis labels, font type and size, colours, etc) and can be exported as an image (.jpg, .png, and .svg).
Curve viewer window of BMDExpress3. This figure shows a screen shot of the Curve viewer window. It displays a graph and the associated parameters chosen to create it.
Figure 8. Curve viewer window of BMDExpress3. The software allows the visualisation of dose-response data and fitted models alongside the estimated BMD model parameter and weights. Users have the option to select individual models or the model average, as well as visualizing the different experimental data sets.
PROAST
114. PROAST is a software package for the statistical analysis of dose-response data. Its main purpose is dose-response modelling of toxicological data. PROAST was operated online, where all the features can be easily accessed after creating a free account to be registered as a user EFSA - Sign in (b2clogin.com).
Data Input
115. Unlike BMDExpress3, PROAST allows the user to either input a tab delimited text file or a comma separated text file. There is no predesignated column format; the user selects the column corresponding to the test compound concentrations and the column corresponding to the response variables. It is necessary for the user to select the correct column with the responses and the type of response (quantal, binary, or continuous) along with the type of data (individual or summary). There is also the ability to add (or not) a litter effect if required.
Model Selection and operation
116. In the “Fit models” tab, the user can select the independent variable (dose) and the response variable(s), as well as add covariates if that is necessary, along with the choice of models and whether model averaging will be applied. The user can select how many bootstraps will be performed, with the default value set at 200. The maximum difference in AIC for model acceptance is 2 by default, but the user can change this value too.
117. The benchmark response (BMR), shown in the PROAST software as critical effect size (CES), is set as 0.05 or 5% as the default value but this can be altered to whatever the user decides. The user can also select the confidence level for the BMD confidence intervals (upper and lower bounds) with the default value set at 0.9 or 90%. In the present study, these parameters were left set at their default values.
Data output and visualisation
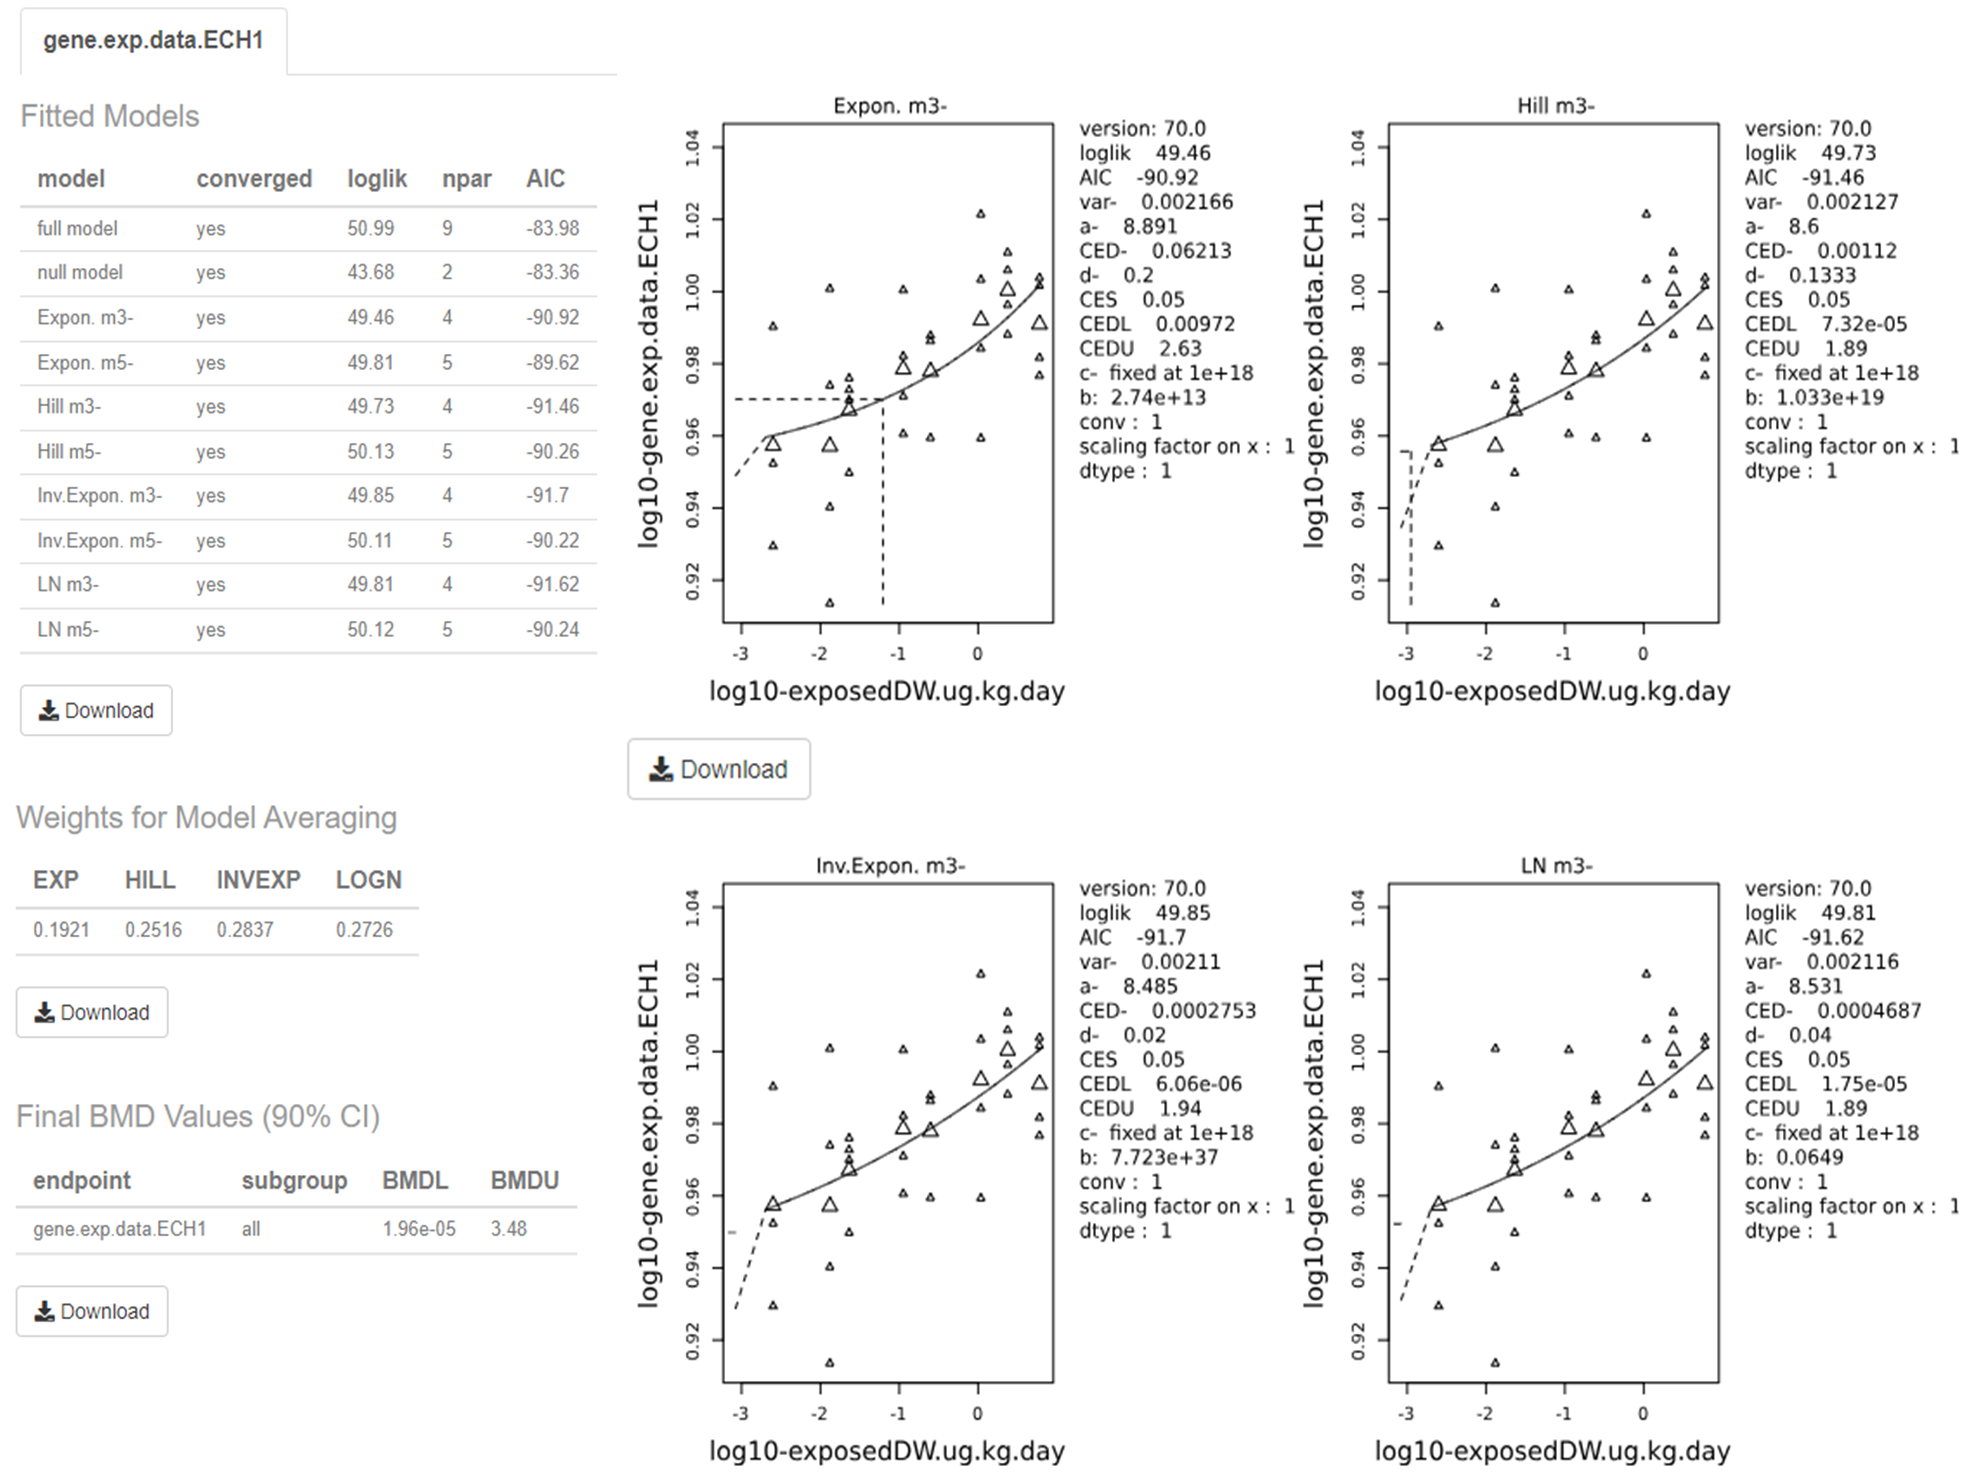
118. Once the models are fit, a report with all standard plots can be downloaded or the user can generate personalised plots according to their needs (Figure 9). The online version of the results is displayed on screen as well, and information about the BMD values and the best model(s), as well as the weights for the model averaging are provided alongside the model summaries (not shown).
Output screen of PROAST web application. The figure shows a screen shot of the output from the application. It is made up pf multiple graphs and tables.
Figure 9. Output screen of PROAST web application. The software visualises the dose-response data along with the fitted BMD models. The estimated BMD model parameters are shown to the right of the graphs. Users can download each image and table individually by clicking on their respective “Download” button.
119. The visualised output displays the plots alongside the calculated BMD, BMDL, and BMDU (In the software these are displayed as the critical effect dose, CED, critical effect dose lower bound, CEDL, and critical effect dose upper bound, CEDU, respectively). Note: The standard plots display data on a log10 scale. Users need to be aware that the data presented beside the plot is dependent upon the units that were input by the user initially. The page also displays the plotted bootstrap models (Default: 200) with the averaged BMDL, BMDU, and the confidence intervals.
PROAST Bayesian BMD modelling
120. EFSA also offers a web application for Bayesian BMD modelling (EFSA - Sign in (b2clogin.com). The rational and mathematical basis to the Bayesian BMD approach is discussed in detail in EFSA’s 2022 updated BMD guidance and practical demonstration of the software and additional background is also available in the form of the publicly available video of the 2023 EFSA BMD workshop (EFSA, 2022; EFSA Workshop, 2023).
Data Input
121. The data input format is the same as that required by PROAST – tab or comma delimited text file with dose-response data.
Model Selection and operation
122. The user can check if their data is suitable and of sufficient quality for dose-response modelling. The software implements an initial analysis of the dose response data to determine if there is sufficient evidence for a substantial dose-effect before the full modelling is attempted.
123. The distribution can be selected as normal or log-normal, as appropriate and users can decide whether to perform a sensitivity analysis or not. As with the non-Bayesian software, the user can define CES (aka BMR) and the credible interval. Additionally, the user can select whether the Prior information is set to a default (uninformative) prior or if an informative prior is to be used. This allows the user to add additional information to the modelling from outside the experimental data set, such as information from historical experiments which will then be used to calculate the posterior likelihood distribution.
124. The Bayesian BMD web application also allows the user to access advanced settings which allows them to choose for example:
- The type of sampling method (Laplace or Bridge) employed. (Note: The Laplace method uses approximations to derive the sampling data, however Bridge sampling is more computationally expensive)
- Whether to extend (or not) the dosing range beyond the range of the experimental data
- Which models to include - Up to 16 different models are available. (Available models are discussed in EFSA, 2022 updated BMD Guidance (included as part of Annex B).
- The Number of draws to be made from posterior sampling: The Number of Markov chain Monte Carlo (MCMC) chains and the Number of MCMC interactions as well as how many MCMC interactions should be discarded as warmup.
Data output and visualisation
125 Once the models are fit, the Bayesian BMD application displays the results on-screen, plotting the results of the modelling alongside the experimental data. The posterior distribution, along with the 90% confidence intervals are superimposed on the same graph by default (Figure 10). An advanced plotting option is also available, for personalised, higher quality plots/images.
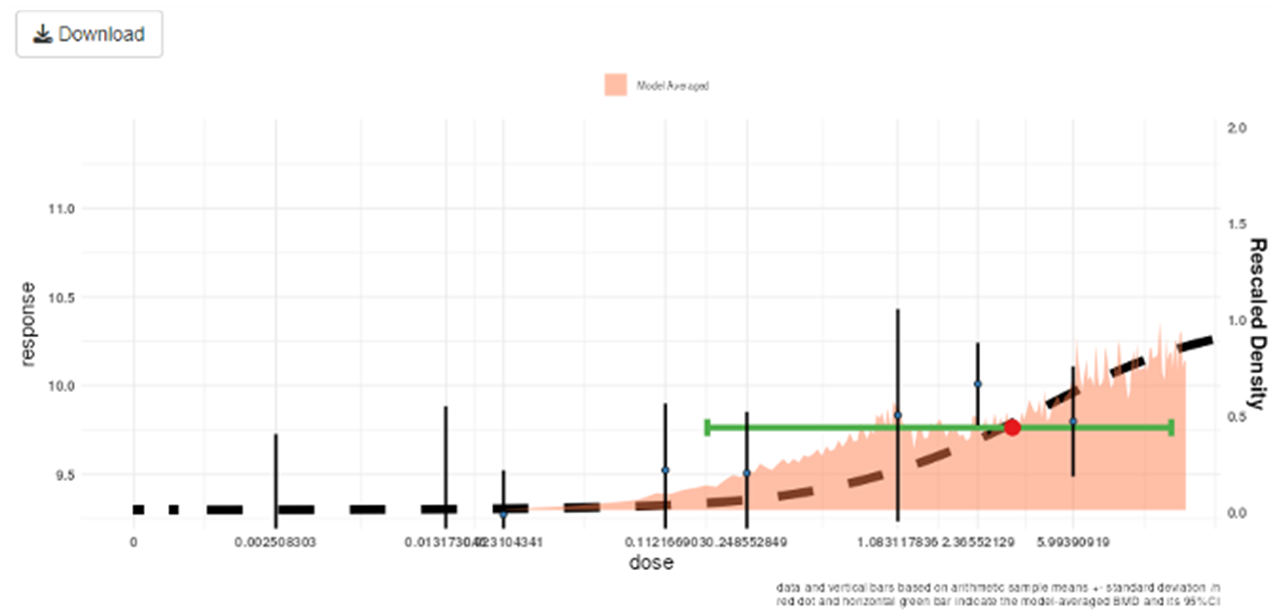
Output of Bayesian BMD web application. The figure shows a graph. The graph is multicoloured with black text labels.
Figure 10. Output of the Bayesian BMD web application. Vertical lines show the observed mean responses ± standard deviation of experimental data. The dashed curve is a fitted dose-response model. The density region shows the posterior distribution of the BMD and the green line indicates the boundaries of the two-sided 90% credible interval of the BMD. The BMDL, is the 95% one-sided lower bound of the credible interval for the BMD. Similarly, the BMDU is the 95% one-sided upper bound of the 90% credible interval for the BMD.
126. The software also provides a breakdown of the individual models in the form of a table along with their BMDs, BMDLs, BMDUs, and the weights that the software accorded to each one. The user can also download an automatically generated report by clicking the “Download report” button available in the top left corner of the webpage (Figure 11).
127. Finally, the model averaged results for the BMD, BMDL, BMDU are presented in a separate table along with a notification if any of the constituent models defy the normality assumptions (green indicated no normality tests have been rejected for any model).
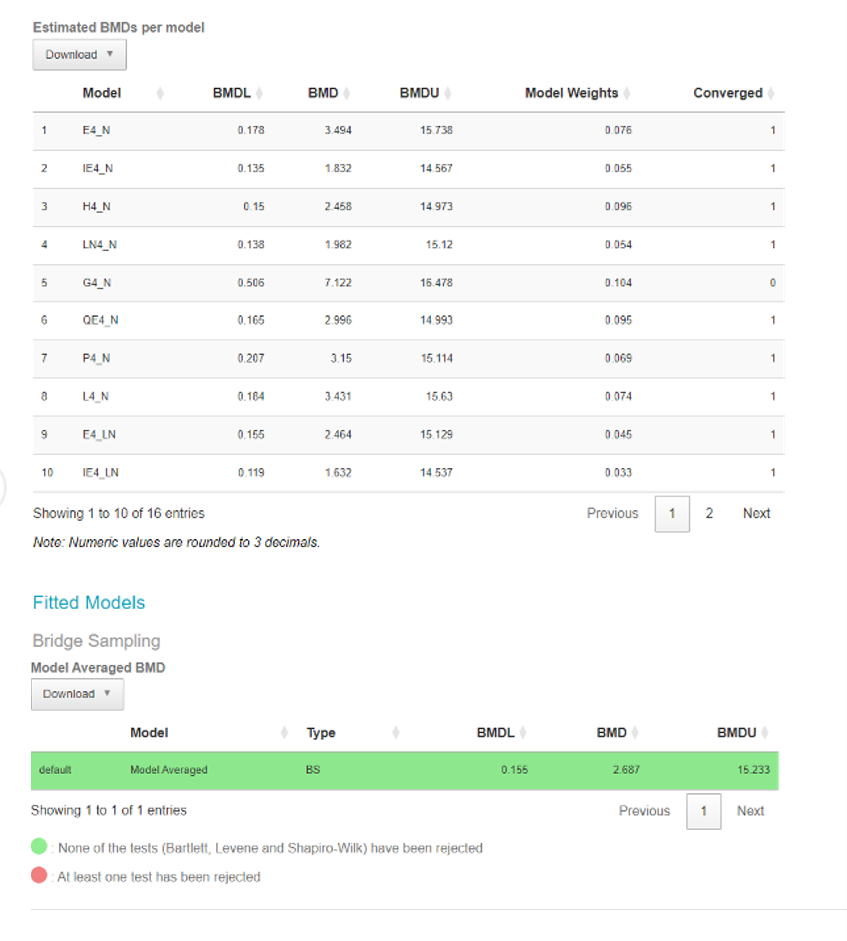
Output screen of Bayesian BMD web application. This figure shows an output screenshot from the application. It shows the results from the data tested. The results are coloured green or red. Green = None of the tests have been rejected. Red= At least one test has been rejected.
Figure 11. Output screen of the Bayesian BMD web application. Tables showing the BMDs, BMDLs, BMDUs, for the various individual fitted models (Upper table) or Model averaged curve (Lower table).
Table 1. User generated feedback on the three BMD modelling platforms used in this study.
|
Details |
BMDExpress3 |
EFSA / PROAST |
EFSA Bayesian BMD modelling |
|
Platform and operations. |
Standalone software (Installation Required). |
Web application (no need to download and install). |
Web application (no need to download and install). |
|
Account required. |
No |
Yes |
Yes |
|
First use / Learning curve. |
Easy to get started. |
Easy to get started. |
Easy to get started. |
|
Training or Online material available? |
How to setup and use webpage - Very useful and instructive Benchmark Dose Analysis · auerbachs/BMDExpress-3 Wiki · GitHub. Wiki page is extremely useful, rich in screenshots of the application, and the video tutorials are a great plus Benchmark Dose Analysis · auerbachs/BMDExpress-3 Wiki · GitHub. |
Training was primarily from other expert users. |
Training was primarily from other expert users. |
|
File format accepted for data input. |
Only accepts tab delimited text files. File needs to be formatted in specific way (name on columns and rows). |
Tab delimited text file or a comma separated text file, can deal with both.
|
Tab delimited text file or a comma separated text file, can deal with both.
|
|
Continuous data accepted? |
Yes
|
Yes
|
Yes
|
|
Nested continuous data accepted? (e.g. litter effects). |
No |
Yes
|
Yes
|
|
Quantal data accepted? |
No |
Yes
|
Yes
|
|
Suitability for biological analysis. |
Better for analysing ‘omics data (genes and metabolites), Less practical for other data types (such as clinical chemistry or exposure data) BMDExpress3 requires extra steps for formatting the data and selecting “generic platform” is |
Flexible software which can handle a range of data types.
|
Flexible software which can handle a range of data types.
|
|
No Detail. |
A must prior to modelling. |
No Detail. |
No detail. |
|
User interface.
|
Graphical User Interface (GUI).
|
Both R version (command line) and web application with GUI possible. |
Web application with (GUI).
|
|
Range of Models available. |
Dose-response models utilized by are those contained within USEPA BMDS software (www.epa.gov/bmds, See Annex B for full discussion.). Users can choose from a range of models: Hill, Power, Exponential (3 and 5), Linear, and Polynomial (2, 3, and 4). As an additional option for modelling, there is also GCurveP (Sciome). |
Automatically generates:
See Annex B for full discussion. |
Users can choose from a range of 16 models: Exponential Normal, Inverse Exponential Normal, Hill Normal, Lognormal Normal, Gamma Normal, Quadratic Exponential Normal, Probit Normal, Logit Normal, and their 8 Lognormal equivalents. See Annex B for full discussion. |
|
Model averaging Available? |
Model averaging Available? |
Model averaging Available? |
Model averaging Available? |
|
Details. |
Yes, User can select Hill, Power, and Exponential (3 and 5) models to run the model averaging module.
|
Yes, The possibility of visualization of the weights for each model in PROAST is an advantage.
|
Yes, User can select 16 different models and two different sampling methods, as well as visualize the weights for each model in Bayesian BMD. |
|
Includes covariates analysis? |
No |
Yes |
Yes |
|
Bayesian analysis. |
MCMC Bayesian approaches to model averaging (available in v.3, with ToxicR functionality). |
No |
Yes |
|
Option to email user when modelling is complete? |
No |
Yes |
Yes |
|
Graphical output. |
Visual plot of the data and BMD curves. Limited plot editing capabilities: Software allows for the modifications of axis names but only.original scales for y-axis and x-axis. |
Visual plot of the data and BMD curves. Includes more options to modify output graphs, change scales etc. (e.g. log-scales). Advanced plotting features allows publication quality images to be produced and downloaded easily. |
Visual plot of the data and BMD curves. Includes more options to modify output graphs, change scales etc. (e.g. log-scales). Advanced plotting features allows publication quality images to be produced and downloaded easily. |
|
Automatically generate final reports? |
No |
Yes |
Yes |
|
Available online at:
|
Version 3 is available at: Releases · auerbachs/BMDExpress-3 (github.com). Version 2 command line is available at: Command Line · auerbachs/BMDExpress-3 Wiki · GitHub along with instructions on how to use it. |