Introduction
In this guide
In this guideOn this page
Skip the menu of subheadings on this page.This is a paper for discussion. This does not represent the views of the Committee and should not be cited.
Type A trichothecenes
7. T-2 and HT-2 are type A trichothecenes which are produced by a variety of Fusarium and other fungal species. Fusarium species grow and invade crops and produce T-2 and HT-2 under cool, moist conditions prior to harvest. T-2 and HT-2 are found predominantly in cereal grains, and in particular oat grain, barley grain and wheat grain products (JECFA, 2016).
8. The chemical structures of T-2 and HT-2 are shown below in Figure 1.
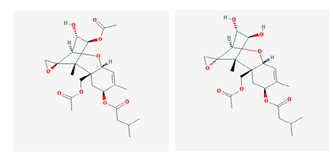
Figure 1. Chemical structures of T-2 (left) and HT-2 (right). The diagram shows 2 chemical structures in black, grey and red against a grey background.
Figure 1. Chemical structures of T-2 (left) and HT-2 (right).
9. The toxicity of T2 and HT2 has been reviewed previously by EFSA (2011, 2017), JECFA (2002, 2016, 2022) and the SCF (2002). All the Committees agreed that these trichothecenes were haematotoxic, immunotoxic and caused reduced body weight, and emesis. These effects occurred at lower doses than other toxic effects such as dermal toxicity, developmental and reproductive toxicity, and neurotoxicity. Haematotoxicity was considered the critical chronic effect on which EFSA’s group TDI was based; the underlying mode of action is the inhibition of protein synthesis, the induction of ribotoxic stress and apoptosis.
Occurrence data
10. Occurrence data on T-2 and HT-2 in food were acquired through a nationwide call for evidence (FSA, 2023). This call was issued by the FSA and FSS in July 2023 and officially closed in October 2023. However, the FSA/FSS continued to receive data up until February 2024. The data call concerned cereals both pre and post cleaning/dehulling and finished products, including, where possible, data that spans multiple years to reflect any annual variability of T-2 and HT-2 levels. The data received cover the UK harvest seasons from 2004 to 2023. Sampling data at retail level were also submitted for 2024 (year tbc).
11. The FSA/FSS received occurrence data on T-2 and HT-2, either as a sum or as individual mycotoxins. The level of detail provided by the respondents and the format varied, but the data included occurrence levels in processed and unprocessed cereal grains, cereal products and Ready to Eat (RTE) foods. The occurrence data submitted to the FSA/FSS were predominantly on unprocessed/raw materials, which were yet to undergo any cleaning. The processes of, for example, dehulling and scouring have been shown to decrease contamination levels substantially. Occurrence data on grains submitted by industry as ‘already processed’ refers to grains that have been dehulled and cleaned, but remain as a commodity, that is they have not been incorporated in any RTE foods. Submitted data on RTE foods included biscuits, rusks and cookies, extruded cereal seed or root-based products, cereal bars, infant formula milk-based powder, oat porridge, muesli, mixed breakfast cereals, bread and rolls.
12. The data were collated, cleaned and assured within the FSA Exposure Assessment and Trade (EAT) team. The quality assurance (QA) methodology aligned with the main principles outlined in the aqua book (UK HM Treasury, 2015) and the guidelines in the government data quality framework (UK Governement Data Quality Hub, 2020) on data quality rules.
13. Prior to the data cleaning, a verification exercise was undertaken by the FSA to account for missing limit of quantification (LOQ) and/or limit of detection (LOD) values and sample type categorisation. For these amendments, assumptions were made based on the descriptors and values included by the submitters, such as the descriptors provided for commodity types based on the sample identification codes. The following criteria were applied to include data without compromising scientific integrity. Data were included when all of the following criteria were met:
a. Datapoints with reported LOQ > 0.
b. Datapoints where the FoodEx (EFSA, 2025) code could be defined.
c. Sample codes referring to products destined for human consumption (not feed).
14. Only data on the sum of T2 and HT2, which were analytically determined in samples, were considered in the exposure assessment to allow for a direct comparison with the group HBGV, which is for the sum of both mycotoxins. Occurrence levels for data submitted as the sum of T-2 and HT-2 ranged from “not detected” to 18,206 µg/kg (18 mg/kg), spanning all years. The highest levels were seen primarily in unprocessed oat grains. Table 1 shows the range of occurrences reported for the sum of T-2 and HT-2 in the different grains along with their respective LOQ ranges. For RTE products all reported values were considered, including individual T-2 or HT-2 occurrences, due to the limited data available.
Table 1: Occurrence levels reported in the whole dataset for the sum of T-2 and HT2 in all grains, including the range of LOQs. For Ready to Eat (RTE) products all reported values were considered, including individual T-2 or HT-2 occurrences. The minimum values reported were non-detects (nd).
|
Product |
Minimum (µg/kg) |
Maximum (µg/kg) |
LOQ (µg/kg) |
|
Processed oat grains |
nd |
2,936 |
10-40 |
|
Unprocessed oat grains |
nd |
18,206 |
10-30 |
|
Processed wheat grains |
nd |
49 |
2-20 |
|
Unprocessed wheat grains |
nd |
51 |
2-20 |
|
Processed barley grains |
nd |
24 |
10-20 |
|
Unprocessed barley grains |
nd |
302 |
10-20 |
|
RTE |
nd |
219 |
1-10 |
15. To estimate the median lower bound (LB) sum of T-2 and HT-2, values that were at or below the LOQ were assumed to be zero. To estimate the median upper bound (UB) occurrence levels, values that were at or below the LOQ were assumed to be at the LOQ, and values above the LOQ were used as reported. The LOQ ranged from 1-40 µg/kg depending on the food types.
Seasonal variability
16. The presence of T-2 and HT-2 in crops is dependent on the weather at key growth stages such as flowering and can demonstrate large annual variability. While there are good agricultural practices deployed to manage the presence of mycotoxins in general, they have not proven to be effective for T-2 and HT-2, given the large dependence on climate/weather. Similarly, reliable rapid testing is not currently available; recent assessments by industry see large variability between liquid chromatography mass spectrometry (LC-MS/MS) methods and Calibre/Charm Elisa semi-rapid methods. Moreover, rapid analytical methods for T-2 and HT-2 have not yet been validated, making it difficult to reliably detect and mitigate these toxins at the field level.
17. A recent review of current rapid screening methods for the mycotoxin T-2 and its metabolites in cereals for human consumption was published by Safefood (Safefood, 2024). Safefood is a body set up under the British-Irish Agreement Act of 1999 to promote awareness and knowledge of food safety and nutrition on the island of Ireland. Safefood note that: “The market is hugely competitive for commercially available rapid diagnostics kits delivering the simultaneous measurement of T-2 and HT-2 toxins, and most of the tests available are immunochemical methods including Enzyme-Linked Immunosorbent Assays (ELISA), Lateral Flow Devices (LFDs/Dipstick Assays) and Fluorescence Polarisation Immunoassays (FPIA)” (Safefood, 2024). However, Safefood also state that: “In the event of new regulatory limits under discussion being implemented, none of the kits in their current form would be ‘fit for purpose’” (Safefood, 2024). This is because rapid tests must be accurate, reproducible and provide the required sensitivity for regulatory compliance.
18. Figures 2, 4 and 6 provide time-trend analyses for the sum of T-2 and HT-2 in all grains, and oat grains only, from data submitted via the call for evidence. The average values in these graphs are the averages of the median values per year. The year-on-year variability and seasonal trend provides an indication of the degree to which the presence of mycotoxins was impacted by climatic events at key stages of crop growth. Figures 3, 5 and 7 provide the corresponding number of samples analysed, with an increased in sample numbers since 2014. The increase is most likely due to the introduction of provisional maximum levels in the EU, as well as the subsequent availability of laboratory testing. The Figures provide data from 2014 to 2023.
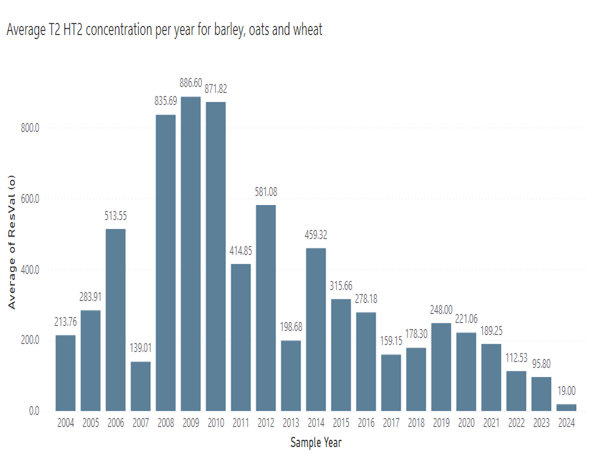
Figure 2: Average sum of T-2 and HT-2 concentration per year for ‘all grains’ (processed barley grains, unprocessed barley grains, processed oat grains, unprocessed oat grains, processed wheat grains and unprocessed wheat grains). This is shown in a dark blue bar chart. The range of the chart shows results for each year between 2004 and 2024 and the average sum of concentration value between 0.0 and 800.0.
*ResVal(o) – concentration in µg/kg.
Figure 2: Average sum of T-2 and HT-2 concentration per year for ‘all grains’ (processed barley grains, unprocessed barley grains, processed oat grains, unprocessed oat grains, processed wheat grains and unprocessed wheat grains).
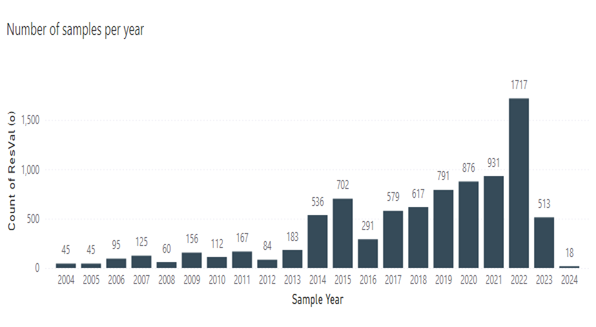
Figure 3 shows a bar chart Corresponding number of samples per year corresponding to figure 2. The chart is shown in a dark grey colour and the axis shows years 200 to 2024 and the average of Res Val 0.0to 800.0.
*ResVal(o) – concentration in µg/kg.
Figure 3: Corresponding number of samples for Figure 2.
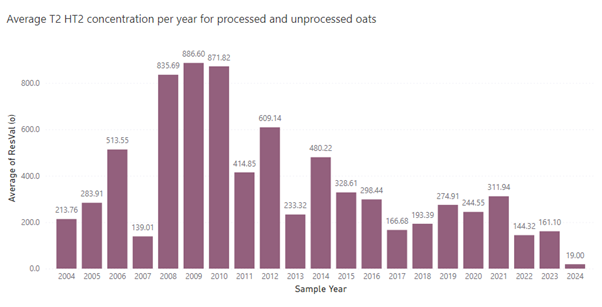
Figure 4: Average sum of T-2 and HT-2 concentration per year for oat grains only (processed oat grains and unprocessed oat grains). This shown in a magenta coloured bar chart. The axis is labelled by year from 2000 to 2024 and the Average of Res Val 0.0 to 800.0.
*ResVal(o) – concentration in µg/kg.
Figure 4: Average sum of T-2 and HT-2 concentration per year for oat grains only (processed oat grains and unprocessed oat grains).
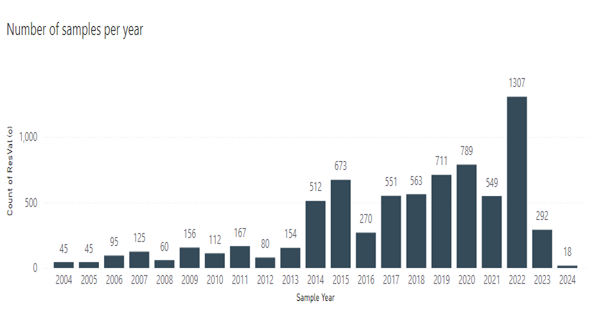
Figure 5 is a bar chart showing the corresponding number of samples for Figure 4. This is shown as a dark grey bar chart. The axis is labelled by year from 2000 to 2024 and the count of Res Val 0.0 to 1000.
*ResVal(o) – concentration in µg/kg.
Figure 5: Corresponding number of samples for Figure 4.
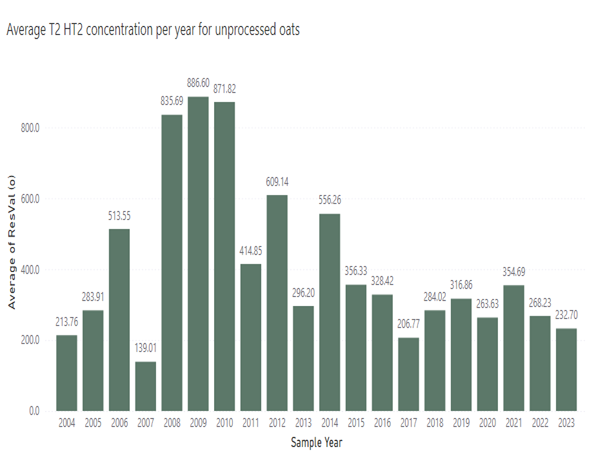
Figure 6 shows the average T2 HT2 concentration per year for unprocessed oats. This is shown as a green bar chart. The axis is labelled by year from 2000 to 2024 and the Average of Res Val 0.0 to 800.0.
*ResVal(o) – concentration in µg/kg.
Figure 6: Average sum of T-2 and HT-2 concentration per year for unprocessed oat grains only.
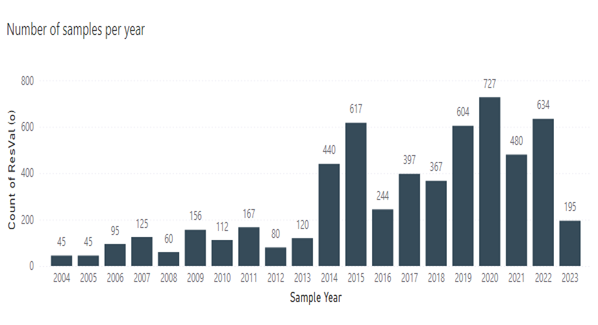
Figure 7 shows the corresponding number of samples for Figure 6. This is shown as a dark grey bar chart. The axis is labelled by year from 2000 to 2023 and the count of Res Val 0.0 to 800.
*ResVal(o) – concentration in µg/kg.
Figure 7: Corresponding number of samples for Figure 6.
Refinement of previous exposure assessment
19. In July 2024, the COT reviewed a scoping paper (TOX/2024/24) on potential consumer exposure to the sum of T-2 and HT-2. The assessment provided preliminary estimates of consumers’ total exposure to the sum of T-2 and HT-2 from a typical diet comprising of i) processed food products and ii) unprocessed food products.
20. The exposure assessment included occurrence data supplied by industry following the call for evidence, and consumption data from the National Diet and Nutrition Survey (NDNS) (years 1-11). The 97.5th percentile consumption rate was used for each food group, as a worst-case scenario.
21. The majority of the occurrence data was from unprocessed foods rather than from foods as would be consumed adding uncertainty to the assessment and leading to an overestimation of the actual exposures. In addition, the occurrence data used for the exposure assessments spanned from 2008 to 2023, with significant variability in the occurrence levels over this time period.
22. Due to the significant uncertainties in this preliminary exposure assessment, the Committee was unable to conclude on the possible risk of any exceedances of the HBGVs.
Reduction factors for unprocessed cereal grains
23. Following the recommendations of the Committee on how the exposure assessment could be refined, a literature search was conducted to identify any information on the reduction of T-2 and HT-2 mycotoxins in cereal grains during processing. Applying reduction factors would allow for a more accurate representation of consumer exposure to T2 and HT2 and result in a more realistic exposure assessment.
24. Unprocessed oat grains intended for human consumption comprise of an outer hull which is the part of the grain which is often most contaminated. However, this outer hull is removed during processing and this so-called de-hulling therefore significantly reduces the level of contamination. Several reduction factors for the sum of T-2 and HT-2 for oat grains were identified in the scientific literature:
- Meyer et al. (2022) reported an average reduction of 85% for large oat kernels and 66% for thin oat kernels.
- Schwake-Anduschus et al. (2010) reported a mean reduction factor of 98% for unprocessed oat grains. However, this paper does not provide specific details about kernel size, as it focuses on different oat cultivars being studied (which accounts for the value of their reduction factor ranging from of 93.8 - 100%).
- EFSA (2011) references a slideshow (Pettersson 2008) which states that “normal cleaning and dehulling during mill processing can reduce levels by 80-95%, but the reduction is lower at lower initial toxin levels”. However, this slideshow does not provide specific details about kernel size.
25. For this assessment, the reduction factor of 85% from Meyer et al (2022) was applied. While the paper references a range of reduction factors, the scientific basis for the factor of 85% was the most recent and was considered the most accurate. Although the reduction factor of 85% was specifically for large oat kernels, Meyer et al. (2023) note that “milling oats are traded to contain less than 10% of thin oats below 2 mm slotted hole sieve”.
26. As some cultivars of oat and barley are hulless, Polišenská et al. (2020) noted that “special attention should be paid to the risk of their contamination by Fusarium mycotoxins, as the rate of mycotoxin reduction during processing could be much lower than that for hulled cereals”. However, in the UK, naked oats are typically used for animal feed and not for human consumption.
27. No reduction factors were identified for wheat, maize or barley. The limited information available suggested that “starting levels and incidence of T-2 and HT-2 in wheat and maize and in the derived ingredients used in processing studies carried out for other Fusarium mycotoxins were very low so that little data could be collected on their fate”… “very little information on the change in mycotoxin concentrations in wheat, maize during manufacturing of retail products was obtained due to the low levels of mycotoxins found in the starting cereal ingredients” (Scudamore, 2009). It is therefore unclear whether or to which percentage processing reduced T2 and HT2 contamination in wheat, maize or barley.