PFAS/2023/02

PFAS/2023/02 Annex 5

Last updated: 31 October 2024

Endpoints

 Currently, endpoints being assessed include thyroid toxicity, hepatotoxicity, developmental toxicity and immunotoxicity.

a.          Should nephrotoxicity, neurotoxicity and reproductive toxicity also be assessed.

b.          Are any other endpoints of interest?

 Members may wish to consider the COT discussion paper TOX/2022/67 which collated subchronic and chronic health-based guidance values (HBGVs) and the basis of these.

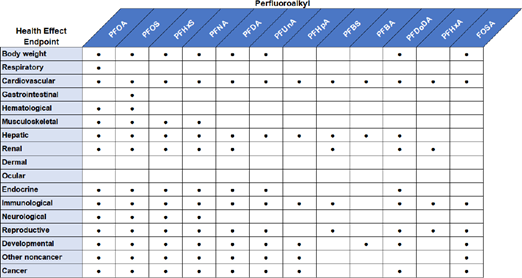
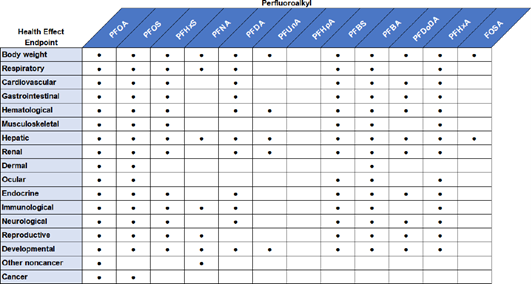
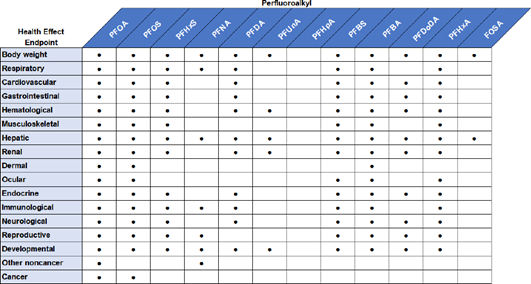
ATSDR investigated the endpoints shown in Figure 8 and Figure 9.

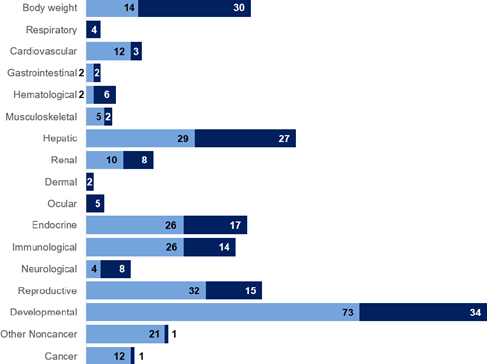
It is useful to note that developmental, hepatic and body weight effects were most studied endpoints for PFOA (Figure 10), and developmental, reproductive, hepatic and body weight effects for PFOS (Figure 11) (ATSDR, 2022). However, the critical effect selected by EFSA (2020) was immunotoxicity, for which there are less data.

Figure 8. Examples of endpoints studied by ATSDR with regards to epidemiological effects.

Figure 8 is an examples of endpoints studied by ATSDR with regards to epidemiological effects. It's represented as a chart with blue and white lines  with black dots representing the data.

Figure 8 is an examples of endpoints studied by ATSDR with regards to epidemiological effects. It's represented as a chart with blue and white lines with black dots representing the data.

Figure 9. Examples of endpoints studied by ATSDR with regards to effects in vivo.

Figure 9 is an example of endpoints studied by ATSDR with regards to effects in vivo. It is shown as a blue and white lined chart with black dots representing the data.

Figure 9 is an example of endpoints studied by ATSDR with regards to effects in vivo. It is shown as a blue and white lined chart with black dots representing the data.

Figure 10. Most studies endpoints for PFOA (ATSDR, 2022).

Light bars = animal data.

Dark bars = human data.

Figure 10 shows results of most studies endpoints for PFOA (ATSDR, 2022). The data is shown in a graph with light blue and dark blue bars. Numbers are shown in white text. The graph has a key explaining the colours: Light bars = animal data, Dark bars = human data.

Figure 10 shows results of most studies endpoints for PFOA (ATSDR, 2022). The data is shown in a graph with light blue and dark blue bars. Numbers are shown in white text. The graph has a key explaining the colours: Light bars = animal data, Dark bars = human data.

Figure 11. Most studies endpoints for PFOS (ATSDR, 2022).

Figure 11  shows most studies endpoints for PFOS (ATSDR, 2022). The data is shown in a graph with light blue and dark blue bars. Numbers are shown in white text. The graph uses the same key as figure 10

Figure 11 shows most studies endpoints for PFOS (ATSDR, 2022). The data is shown in a graph with light blue and dark blue bars. Numbers are shown in white text. The graph uses the same key as figure 10

References

ATSDR, 2021. Toxicological Profile for Perfluoroalkyls. Toxicological Profile for Perfluoroalkyls PDF.

EFSA, 2020. Risk to human health related to the presence of perfluoroalkyl substances in food.

Risk to human health related to the presence of perfluoroalkyl substances in food (wiley.com)