Per- and polyfluoroalkyl substances: method for presentation of available data - PFAS/2023/02
Introduction and Background - PFAS/2023/02
In this guide
In this guideThis is a paper for discussion.
This does not represent the views of the committee and should not be cited.
Introduction
1. This is a paper for discussion regarding how future papers on PFAS should be presented to the subgroup.
2. The subgroup is presented with a number of questions for discussion, with examples given in Annexes. As the paper is related to the methodological aspects of the presentation of the evidence base, Members are asked not to review and comment on the data presented in the examples, as they are for illustrative purposes only.
3. For each broad endpoint (e.g. thyroid toxicity) in vivo, in vitro and epidemiology data will be presented for all PFAS, from which sensitive endpoints (e.g. thyroid hormone levels, liver weight, preputial separation) will be identified. Opinions on the pertinent sensitive endpoints will also be summarised from authoritative body reports, and a discussion will be provided as to the relevance to humans and whether the sensitive endpoint is considered adverse. Options for the presentation of these data are provided in Annexes 1-5 for the subgroup to consider. In addition, the subgroup should consider whether any specific evaluation approaches should be used by the Secretariat for assessing the data, taking into account the guidance in the SETE report.
4. Based on COT paper TOX/2022/67, the Committee has asked as a minimum for thyroid, liver, developmental and immunotoxicity endpoints to be considered. It may be appropriate for nephrotoxicity, neurotoxicity, and reproductive toxicity to also be considered, as well as any other endpoints subgroup members think should be reviewed.
Summary
Overall, this paper aims to give members options regarding how work assessing the toxicological effects of PFAS can be carried out in a thorough yet effective manner.
Questions on which the views of the Committee are sought
Members are invited to consider the following questions:
i. Should papers undergo reliability scoring or quality assessment to assess reliability prior to inclusion into the narrative/table? The subgroup may wish to consider providing specific guidance on epidemiology, in vivo and in vitro studies, respectively (Annex 1).
ii. Due to the large number of studies, how do members want data presented (Annex 2);
a. Narratives on all studies plus a summary.
b. Tabular format plus a summary.
c. Graphical format, including any preference on the type of presentation, plus a summary.
d. Any combination of a, b and c above.
iii. When writing summaries of the data, how do members want the data presented (Annex 3);
a. Summary per sensitive endpoint (e.g. liver weight, clinical chemistry, gene expression, cholesterol).
b. Summary per individual PFAS.
c. Summary per group or sub-group of PFAS (e.g. PFCA or PFSA).
iv. In the narrative and/or table, do members want quantitative data presented (e.g. XX increase in Y endpoint, vs significant increase in Y endpoint)? (Annex 4).
v. Currently, endpoints being assessed include thyroid toxicity, hepatotoxicity, developmental toxicity and immunotoxicity (Annex 5);
a. Should nephrotoxicity, neurotoxicity and reproductive toxicity also be assessed.
b. Are any other endpoints of interest?
IEH Consulting under contract supporting the UKHSA COT Secretariat August 2023
PFAS/2023/02 Annex 1
In this guide
In this guideReliability scoring
Should papers undergo reliability scoring or quality assessment to assess reliability prior to inclusion into the narrative/table? The subgroup may wish to consider providing specific guidance on epidemiology, in vivo and in vitro studies, respectively?
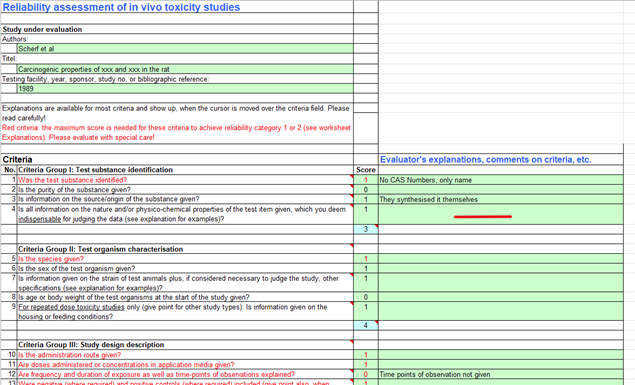
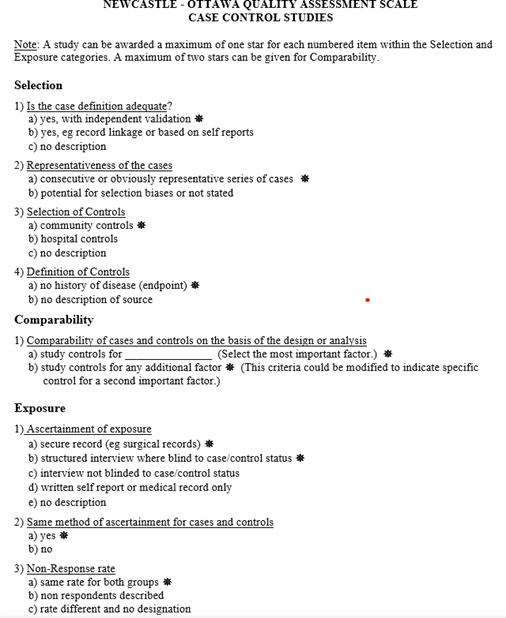
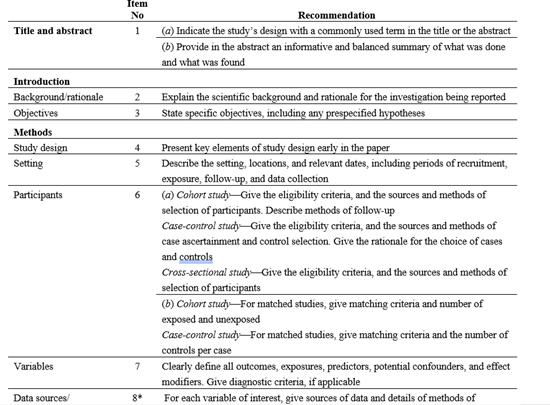
To ensure data used in all reports are of adequate quality all in vivo and in vitro papers could undergo Klimisch scoring using the ToxRTool (Figure 1). Similarly, epidemiology data could undergo quality assessment e.g. using Newcastle Ottowa Score (NOS) (Figure 2), or Strengthening the Reporting of Observational Studies in Epidemiology (STROBE) assessment (Figure 3), or based on Annex 1 of the SETE report..
Screening papers for reliability could reduce the number of papers used in the assessments and may impact on the subgroup decision-making on presentation of data i.e. if data are presented in a narrative, tabular or graphical format.
Figure 1. Example of ToxRTool.
Figure 2. Example of NOS
Figure 3. Example of STROBE
PFAS/2023/02 Annex 2
In this guide
In this guideData presentation
Due to the large number of studies, how do members want data presented?
a. Narratives on all studies plus a summary (example below).
b. Tabular format plus a summary.
c. Graphical format, including any preference on the type of presentation, plus a summary.
d. Any combination of a, b and c above.
Examples of a narrative summary, a table (Table 2) and graphs (Figure 4, Figure 5, Figure 6 and Figure 7) are presented below.
Example of presenting data as a narrative report
If data are presented in a narrative, do members agree with how the data are presented in the example below?
Ramhøj et al. 2018
1. Ramhøj et al. (2018) investigated the effect of low doses of PFHxS on thyroid hormone levels in rats as part of two developmental studies evaluating PFHxS. In Study 1, pregnant Wistar rats (8/group) were administered 0, 25 or 45 mg/kg bw/day PFHxS by gavage on GD7 to PND22. In Study 2, pregnant Wistar rats (16 – 20/group) were administered 0, 0.05, 5 and 25 mg/kg bw/day PFHxS by gavage from GD7 to PND22.
2. In Study 1, blood was collected from offspring on PND16 and dams on PND22 for TT4 measurement. Serum PFHxS concentrations were measured in dams (5 – 7/group) on PND22. In Study 2, blood was collected from dams on GD15, from male offspring on PND16, female offspring on PND17 and dams on PND22 for TT4 analysis.
3. General toxicity and body weight: No clinical signs of general toxicity were observed in dams or offspring in either study. Maternal weight and weight gain was also unaffected by treatment. In Study 2, male offspring body weight was slightly decreased at 25 mg/kg bw/day on PND0.
4. Gross pathology: A significant decrease in thyroid weight was observed in female offspring at 5 and 25 mg/kg bw/day compared with controls. No effects were seen in dams or male offspring.
5. Histopathology: There were no treatment-related effects on maternal histopathology. Mild histological changes were seen in male offspring at 25 mg/kg bw/day; however, such changes were reversible. No effects were seen in dams and no data in female offspring were presented.
6. Thyroid hormone levels: Treatment with PFHxS reduced TT4 levels in both dams and offspring. In Study 1, TT4 levels in dams and offspring were significantly reduced at both 25 and 45 mg/kg bw/day, compared with controls. In Study 2, TT4 levels in dams at both timepoints were significantly reduced at 5 mg/kg bw/day and 25 mg/kg bw/day as were levels in offspring.
7. Serum PFHxS concentrations: PFHxS concentrations in dams on PND22 were ND (controls), 139 µg/mL (25 mg/kg bw/day) and 174 µg/mL (45 mg/kg bw/day).
8. Based on these results, the authors proposed that PFHxS is an effective thyroid hormone disruptor in rats as PFHxS administration significantly decreased serum TT4 levels in rat dams and their offspring. The authors concluded that PFHxS can induce marked reductions in circulating serum TT4 in rats, which at critical developmental stages can lead to altered brain morphology and adverse behaviour.
Example of presenting data as a table
If data are presented in tabular format, do members agree with the table presented below or:
a) do members want any additional data included?
b) are there any data that is not required?
This is a paper for discussion. This does not represent the views of the Committee and should not be cited.
Table 1 Example of data presented in a tabulated form.
|
Substance |
Species / sex / number / study type |
Dose / route of administration / duration (mg/kg bw/day) |
Serum / plasma concentration (µg/mL) |
Observed effects at LOAEL |
Published NOAEL / LOAEL (mg/kg bw/day) |
Reference |
|
PFHxS |
Wistar rats / female / 8/group / developmental study. |
Study 1 0, 25 or 45 / gavage / GD7 – PND22. |
At 25 mg/kg bw/day Maternal serum: 139 (SD not given). |
Maternal effects ↓TT4. Fetal/pup effects ↓TT4 ↓ thyroid weight in females. Reversible histopathological changes in males. |
Maternal: ND / 25. Offspring: ND / 25. |
Ramhøj et al. (2018). |
|
PFHxS |
Wistar rats / female / 16 – 20/group / developmental study. |
Study 2 0, 0.05, 5 or 25 / gavage / GD7 – PND22. |
NR |
Maternal effects. Fetal/pup effects ↓TT4 ↓ body weight of male pups at birth. |
0.05 / 5. |
Ramhøj et al. (2018). |
Example of presenting data as graphs
If data are presented in graphical format, which graphs do members prefer?
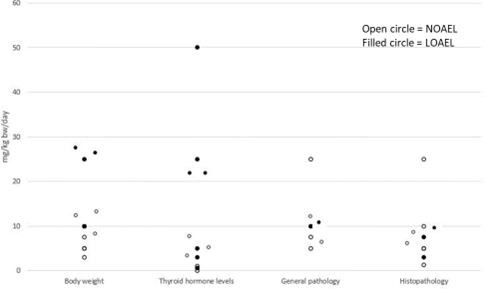
Figure 4 presents data on different endpoints related to thyroid toxicity for PFHxS. In the report, it is anticipated that data for each PFAS could be presented in individual graphs.
Figure 4. Example of thyroid toxicity data for PFHxS.
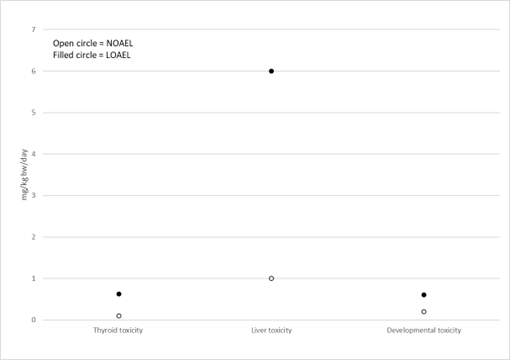
Figure 5 and Figure 6 show examples of how data could be presented to illustrate the most sensitive endpoint for different types of toxicity. Such graphs could be presented for each PFAS in a final report to help visualise and select the critical endpoints.
Figure 5. Example of most sensitive endpoints for thyroid, liver and developmental toxicity for PFHxS. Option 1.
Figure 6. Example of most sensitive endpoints for thyroid, liver and developmental toxicity for PFHxS. Option 2.
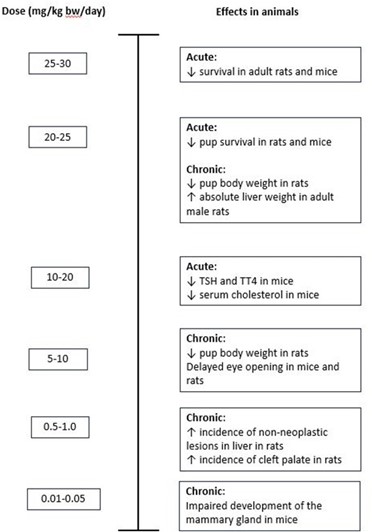
Figure 7 could be used to illustrate all adverse effects seen at different doses. Again, it is anticipated that such a graph could be presented for each PFAS in a final report, to help visualise effects seen at different doses and therefore aid in the selection of the critical effect.
Figure 7. Example of presentation of all toxicity data for PFHxS.
PFAS/2023/02 Annex 3
In this guide
In this guideSummaries
When writing summaries of the data, how do members want the data presented?
- Summary per sensitive endpoint (e.g. liver weight, clinical chemistry, thyroid hormones).
- Summary per individual PFAS.
- Summary per group or sub-group of PFAS (e.g. PFCA or PFSA).
Examples of each option are given below. (To note these are made of illustrative data rather than data taken from studies).
Example of a summary per endpoint
Evidence from repeated dose toxicity oral studies in rats, mice, and monkeys indicate that the liver is a sensitive target for PFHxA, PFOA, PFNA and PFDA, as well as PFBS, PFHxS, PFOS and PFDoDA.
The effects seen included increases in changes in clinical chemistry parameters (ALT), liver weight, hepatocellular hypertrophy, and decreases in serum lipid levels.
ALT
Fifty-seven out of 88 studies measured liver enzyme ALT of which four reported increases following exposure to PFHxA (1 study; rats), PFOA (1 study; mice), and PFOS (2 studies; mice and monkeys). In contrast, one study reported a decrease in ALT in rats following exposure to PFOS.
For PFHxA, ALT was significantly increased in male and female rats following exposure to 20 mg/kg bw/day for 90 days (63 ± 64 U/L) compared with controls (27 ± 3 U/L) (Loveless et al. 2009).
A statistically significant increase in ALT was also seen in male rats following exposure to 10 mg/kg bw/day PFOS for 21 days compared with controls (approx. 600 U/L vs 350 U/L in controls; data taken from figures) (Elcombe et al., 2010). A transient increase was seen in male and female monkeys following treatment with 0.15 mg/kg bw/day on day 37 (37 ± 12 U/L vs 34 ± 15 U/L in controls) and day 62 (50 ± 24 U/L vs 39 ± 2015 U/L in controls) but not at later time points (Seacat et al., 2002).
PFOA also caused a significant increase in ALT in male mice following exposure to 5 mg/kg bw/day for 21 days (35 ± 12 U/L vs 22 ± 4 U/L for treated and control mice, respectively) (Wu et al., 2018).
Overall, the lowest dose that cause an increase in ALT was 0.15 mg/kg bw/day PFOS (male and female monkeys), followed by 5 mg/kg bw/day PFOA (mice male) and 20 mg/kg bw/day PFHxA (male and female rats).
Example of a summary per PFAS
PFHxS was investigated in five repeat dose toxicity studies (Butenhoff et al., 2009b; Gilbert et al., 2021; NTP, 2022b and Romhoj et al., 2018 and 2020). Overall, a decrease in thyroid hormones was seen in all studies with the exception of the study by Butenhoff et al., 2009b, in which no effects were reported in male and female SD rats following exposure to 3 mg/kg bw/day.
Decreases in TT4, TT3 and FT4 in serum were reported in two studies in rats (Gilbert et al., 2021; NTP, 2022b). In the study by Gilbert et al., decreases in TT4, TT3 and FT4 were seen in Long-Evans female rats following exposure to 50 mg/kg bw/day from GD 6 to GD 21 (TT4; 10 ng/ml vs 17 ng/ml for treated and controls, respectively.TT3; 40 ng/ml vs 50 ng/ml. FT4; 1.5 ng/dl vs 1.75 ng/dl). NTP (2022b) reported a decrease in TT4, TT3 and FT4 in serum, in SD male and female rats compared to controls, following exposure to 0.625 mg/kg bw/day (TT4; 22 ng/ml vs 45 ng/ml for treated and controls, respectively.TT3; 45 ng/ml vs 55 ng/ml. FT4; 5 ng/dl vs 7 ng/dl).
In contrast, only TT4 (Romhoj et al., 2018) and TT3 (Romhoj et al., 2020) were decreased in female Wistar rats following exposure to 25 mg/kg bw/day from GD 7 to PND 22 and (TT4; 15 ng/ml vs 45 ng/ml for treated and controls, respectively. TT3; 41 ng/ml vs 56 ng/ml).
PFHxS also increased the incidence of minimal to moderate hypertrophy and hyperplasia of follicular epithelial cells in the thyroid of male SD rats following exposure to 3 mg/kg bw/day (Butenhoff et al., 2009b)
Example of a summary per group or sub-group of PFAS (e.g. PFCA or PFSA)
Data on thyroid toxicity are available for PFCAs, namely PFHxA, PFOA, PFNA and PFDA.
All studies, with the exception of Loveless et al (2009) noted a decrease in TT4 and FT4. NTP (2022a) reported a decrease in male rats following exposure to 62.6 mg/kg bw/day PFHxA (TT4 – 3.4 ± 0.23 ng/ml vs 4.26 ± 0.15 ng/ml in treated and controls, respectively; FT4 – 2.16 ± 0.17 pg/ml vs 2.88 ± 0.09 pg/ml), 0.625 mg/kg bw/day PFOA (TT4 – 5.2 ± 0.45 ng/ml vs 4.26 ± 0.15 ng/ml; FT4 – 6.25 ± 0.17 ng/ml vs 2.88 ± 0.09 ng/ml) and PFNA (TT4 – 3.2 ± 0.68 ng/ml vs 4.26 ± 0.15 ng/ml; FT4 – 5.55 ± 0.18 ng/ml vs 2.88 ± 0.09), and 0.312 mg/kg bw/day PFDA (TT4 – 3.25 ± 0.165 ng/ml vs 4.26 ± 0.15 ng/ml; FT4 – 2.39 ± 0.21 ng/ml vs 2.88 ± 0.09 ng/ml) for 28 days. Similarly a decrease was seen in male and female rats following exposure to 10 mg/kg bw/day PFOA from GD8 to PND2 (TT4 – 16.2 ± 0.9 ng/ml vs 29.1 ± 1.0 ng/ml; FT4 – 25.9 ± 2.0 pg/ml vs 42.2 ± 7.7 pg/ml) (Conley et al, 2022).
Increased thryroid weight was only seen in female rats following exposure to 0.312 mg/kg bw/day PFDA for 28 days (NTP, 2022a), and in males and females following exposure to 500 mg/kg bw/day PFHxA for 92 or 93 days (Loveless et al., 2009). In the latter study, an increase in minimal hypertrophy of thyroid follicular epithelium was also reported.
PFAS/2023/02 Annex 4
In this guide
In this guideQuantitative data
In the narrative and/or table, do members want quantitative data presented (e.g. XX increase in Y endpoint, vs significant increase in Y endpoint)?
If members wish to see the quantitative values, do members have a preference for data being presented as absolute values compared to controls or as a percentage change compared to controls?
Examples of each option are given below. 9To note these are made of illustrative data rather than data taken from studies).
Example of quantitative data presented as absolute values
‘All studies, with the exception of Loveless et al (2009) noted a decrease in TT4 and FT4. NTP (2022a) reported a decrease in male rats following exposure to 62.6 mg/kg bw/day PFHxA (TT4 – 3.4 ± 0.23 ng/ml vs 4.26 ± 0.15 ng/ml in treated and controls, respectively; FT4 – 2.16 ± 0.17 pg/ml vs 2.88 ± 0.09 pg/ml), 0.625 mg/kg bw/day PFOA (TT4 – 3.2 ± 0.45 ng/ml vs 4.26 ± 0.15 ng/ml; FT4 – 1.25 ± 0.17 ng/ml vs 2.88 ± 0.09 ng/ml) and PFNA (TT4 – 3.2 ± 0.68 ng/ml vs 4.26 ± 0.15 ng/ml; FT4 – 1.55 ± 0.18 ng/ml vs 2.88 ± 0.09) and 0.312 mg/kg bw/day PFDA (TT4 – 3.25 ± 0.165 ng/ml vs 4.26 ± 0.15 ng/ml; FT4 – 2.39 ± 0.21 ng/ml vs 2.88 ± 0.09 ng/ml) for 28 days’.
Example of quantitative data presented as a percentage
If quantitative data as a percentagae change are included, the text would look like the following:
‘All studies, with the exception of Loveless et al (2009) noted a decrease in TT4 and FT4. NTP (2022a) reported a decrease in male rats following exposure to 62.6 mg/kg bw/day PFHxA (TT4 – 20% decrease compared with controls; FT4 – 25% decrease), 0.625 mg/kg bw/day PFOA (TT4 – 25% decrease; FT4 –22% decrease) and PFNA (TT4 – 46% decease; FT4 – 24% decrease) and 0.312 mg/kg bw/day PFDA (TT4 – 24% decrease; FT4 – 17% decrease) for 28 days’.
Presenting data in this format could help in future papers that will investigate if such toxicological effects in terms of adversity. For example, the biological significance, clinical relevance and relationship with adversity of a 20% decrease in TT4 will be investigated during selection of the critical, most sensitive endpoint.
Example of qualitative data
If quantitative data are not included, the text would look like the following:
‘All studies, with the exception of Loveless et al (2009) noted a decrease in TT4 and FT4. NTP (2022a) reported a decrease in male rats following exposure to 62.6 mg/kg bw/day PFHxA, 0.625 mg/kg bw/day PFOA and PFNA, and 0.312 mg/kg bw/day for 28 days’.
It is anticipated that once a critical endpoint is selected, on the basis of dose, then quantitative data would then be assessed in terms of biological relevance and adversity as described above.
Alternatively, quantitative data could be presented in tables (Table 2).
Again, absolute data or data as a percentage of controls could be presented.
Table 2 Example of the table three different presentations of the observed effects.
|
Substance |
Species / sex / number / study type |
Dose / route of administration / duration (mg/kg bw/day) |
Serum / plasma concentration (µg/mL) |
Observed effects at LOAEL (treated vs control) |
Published NOAEL / LOAEL (mg/kg bw/day) |
Reference |
|
PFOA |
SD rats / male and female / 10/group / repeated dose study. |
0, 0.625, 1.25, 2.5, 5 or 10 (males), 0, 6.25, 12.5, 25, 50, or 100 (females) / gavage / 28 days. |
At 0.625 mg/kg bw/day Plasma: 50.690 ± 2.207 in males. |
Without quantitative data ↓ TT4, FT4 and TT3 in males. |
NA / 0.625. |
NTP (2022a). |
|
PFOA |
SD rats / male and female / 10/group / repeated dose study. |
0, 0.625, 1.25, 2.5, 5 or 10 (males), 0, 6.25, 12.5, 25, 50, or 100 (females) / gavage / 28 days. |
At 0.625 mg/kg bw/day Plasma: 50.690 ± 2.207 in males. |
With absolute quantitative data ↓ TT4 in males (3.4 ± 0.23 ng/ml vs 4.26 ± 0.15 ng/ml for treated and controls, respectively). ↓ FT4 in males (2.16 ± 0.17 pg/ml vs 2.88 ± 0.09 pg/ml). ↓ TT3 in males (3.2 ± 0.68 ng/ml vs 4.26 ± 0.15 ng/ml). |
NA / 0.625. |
NTP (2022a). |
|
Substance |
Species / sex / number / study type |
Dose / route of administration / duration (mg/kg bw/day) |
Serum / plasma concentration (µg/mL) |
Observed effects at LOAEL (treated vs control) |
Published NOAEL / LOAEL (mg/kg bw/day) |
Reference |
|
PFOA |
SD rats / male and female / 10/group / repeated dose study. |
0, 0.625, 1.25, 2.5, 5 or 10 (males), 0, 6.25, 12.5, 25, 50, or 100 (females) / gavage / 28 days. |
At 0.625 mg/kg bw/day Plasma: 50.690 ± 2.207 in Males. |
With relative quantitative data ↓ TT4 in males (20% reduction compared to controls). ↓ FT4 in males (25% reduction). ↓ TT3 in males (25% reduction). |
NA / 0.625. |
NTP (2022a). |
PFAS/2023/02 Annex 5
In this guide
In this guideEndpoints
Currently, endpoints being assessed include thyroid toxicity, hepatotoxicity, developmental toxicity and immunotoxicity.
a. Should nephrotoxicity, neurotoxicity and reproductive toxicity also be assessed.
b. Are any other endpoints of interest?
Members may wish to consider the COT discussion paper TOX/2022/67 which collated subchronic and chronic health-based guidance values (HBGVs) and the basis of these.
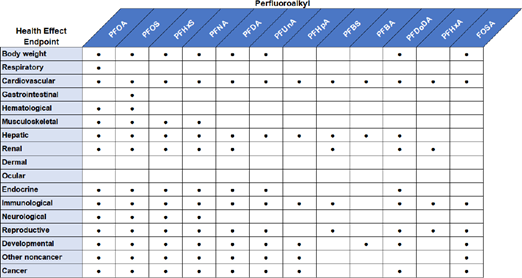
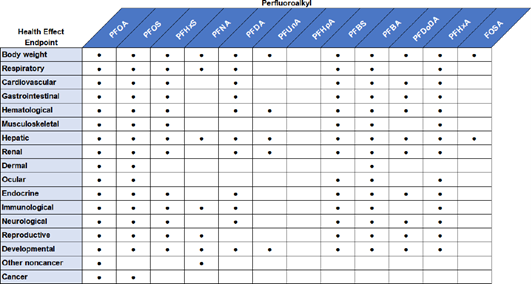
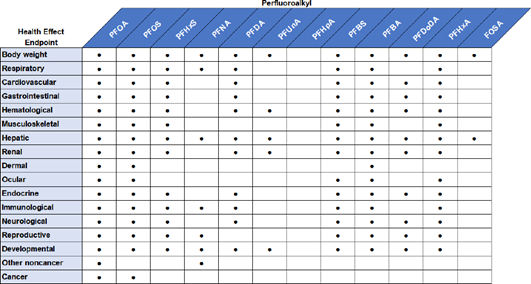
ATSDR investigated the endpoints shown in Figure 8 and Figure 9.
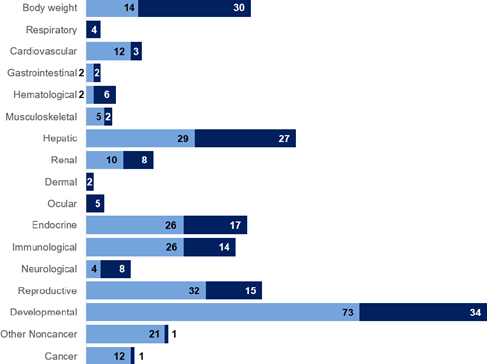
It is useful to note that developmental, hepatic and body weight effects were most studied endpoints for PFOA (Figure 10), and developmental, reproductive, hepatic and body weight effects for PFOS (Figure 11) (ATSDR, 2022). However, the critical effect selected by EFSA (2020) was immunotoxicity, for which there are less data.
Figure 8. Examples of endpoints studied by ATSDR with regards to epidemiological effects.
Figure 9. Examples of endpoints studied by ATSDR with regards to effects in vivo.
Figure 10. Most studies endpoints for PFOA (ATSDR, 2022).
Light bars = animal data.
Dark bars = human data.
Figure 11. Most studies endpoints for PFOS (ATSDR, 2022).
References
ATSDR, 2021. Toxicological Profile for Perfluoroalkyls. Toxicological Profile for Perfluoroalkyls PDF.
EFSA, 2020. Risk to human health related to the presence of perfluoroalkyl substances in food.
Risk to human health related to the presence of perfluoroalkyl substances in food (wiley.com)
