PFAS/2023/02 Annex 2
In this guide
In this guideOn this page
Skip the menu of subheadings on this page.Data presentation
Due to the large number of studies, how do members want data presented?
a. Narratives on all studies plus a summary (example below).
b. Tabular format plus a summary.
c. Graphical format, including any preference on the type of presentation, plus a summary.
d. Any combination of a, b and c above.
Examples of a narrative summary, a table (Table 2) and graphs (Figure 4, Figure 5, Figure 6 and Figure 7) are presented below.
Example of presenting data as a narrative report
If data are presented in a narrative, do members agree with how the data are presented in the example below?
Ramhøj et al. 2018
1. Ramhøj et al. (2018) investigated the effect of low doses of PFHxS on thyroid hormone levels in rats as part of two developmental studies evaluating PFHxS. In Study 1, pregnant Wistar rats (8/group) were administered 0, 25 or 45 mg/kg bw/day PFHxS by gavage on GD7 to PND22. In Study 2, pregnant Wistar rats (16 – 20/group) were administered 0, 0.05, 5 and 25 mg/kg bw/day PFHxS by gavage from GD7 to PND22.
2. In Study 1, blood was collected from offspring on PND16 and dams on PND22 for TT4 measurement. Serum PFHxS concentrations were measured in dams (5 – 7/group) on PND22. In Study 2, blood was collected from dams on GD15, from male offspring on PND16, female offspring on PND17 and dams on PND22 for TT4 analysis.
3. General toxicity and body weight: No clinical signs of general toxicity were observed in dams or offspring in either study. Maternal weight and weight gain was also unaffected by treatment. In Study 2, male offspring body weight was slightly decreased at 25 mg/kg bw/day on PND0.
4. Gross pathology: A significant decrease in thyroid weight was observed in female offspring at 5 and 25 mg/kg bw/day compared with controls. No effects were seen in dams or male offspring.
5. Histopathology: There were no treatment-related effects on maternal histopathology. Mild histological changes were seen in male offspring at 25 mg/kg bw/day; however, such changes were reversible. No effects were seen in dams and no data in female offspring were presented.
6. Thyroid hormone levels: Treatment with PFHxS reduced TT4 levels in both dams and offspring. In Study 1, TT4 levels in dams and offspring were significantly reduced at both 25 and 45 mg/kg bw/day, compared with controls. In Study 2, TT4 levels in dams at both timepoints were significantly reduced at 5 mg/kg bw/day and 25 mg/kg bw/day as were levels in offspring.
7. Serum PFHxS concentrations: PFHxS concentrations in dams on PND22 were ND (controls), 139 µg/mL (25 mg/kg bw/day) and 174 µg/mL (45 mg/kg bw/day).
8. Based on these results, the authors proposed that PFHxS is an effective thyroid hormone disruptor in rats as PFHxS administration significantly decreased serum TT4 levels in rat dams and their offspring. The authors concluded that PFHxS can induce marked reductions in circulating serum TT4 in rats, which at critical developmental stages can lead to altered brain morphology and adverse behaviour.
Example of presenting data as a table
If data are presented in tabular format, do members agree with the table presented below or:
a) do members want any additional data included?
b) are there any data that is not required?
This is a paper for discussion. This does not represent the views of the Committee and should not be cited.
Table 1 Example of data presented in a tabulated form.
|
Substance |
Species / sex / number / study type |
Dose / route of administration / duration (mg/kg bw/day) |
Serum / plasma concentration (µg/mL) |
Observed effects at LOAEL |
Published NOAEL / LOAEL (mg/kg bw/day) |
Reference |
|
PFHxS |
Wistar rats / female / 8/group / developmental study. |
Study 1 0, 25 or 45 / gavage / GD7 – PND22. |
At 25 mg/kg bw/day Maternal serum: 139 (SD not given). |
Maternal effects ↓TT4. Fetal/pup effects ↓TT4 ↓ thyroid weight in females. Reversible histopathological changes in males. |
Maternal: ND / 25. Offspring: ND / 25. |
Ramhøj et al. (2018). |
|
PFHxS |
Wistar rats / female / 16 – 20/group / developmental study. |
Study 2 0, 0.05, 5 or 25 / gavage / GD7 – PND22. |
NR |
Maternal effects. Fetal/pup effects ↓TT4 ↓ body weight of male pups at birth. |
0.05 / 5. |
Ramhøj et al. (2018). |
Example of presenting data as graphs
If data are presented in graphical format, which graphs do members prefer?
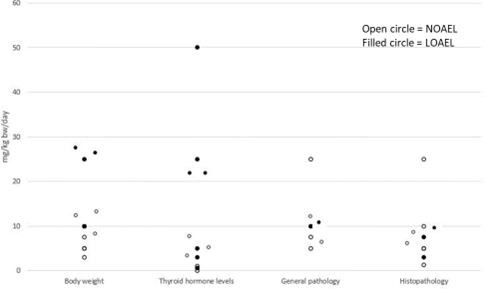
Figure 4 presents data on different endpoints related to thyroid toxicity for PFHxS. In the report, it is anticipated that data for each PFAS could be presented in individual graphs.
Figure 4. Example of thyroid toxicity data for PFHxS.
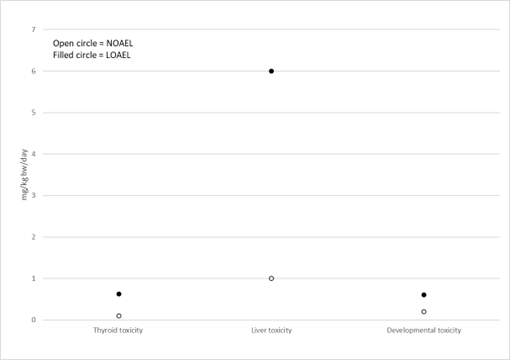
Figure 5 and Figure 6 show examples of how data could be presented to illustrate the most sensitive endpoint for different types of toxicity. Such graphs could be presented for each PFAS in a final report to help visualise and select the critical endpoints.
Figure 5. Example of most sensitive endpoints for thyroid, liver and developmental toxicity for PFHxS. Option 1.
Figure 6. Example of most sensitive endpoints for thyroid, liver and developmental toxicity for PFHxS. Option 2.
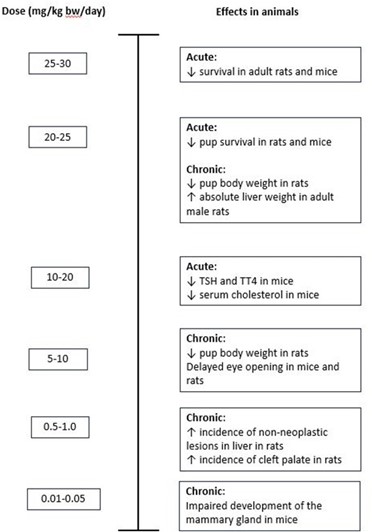
Figure 7 could be used to illustrate all adverse effects seen at different doses. Again, it is anticipated that such a graph could be presented for each PFAS in a final report, to help visualise effects seen at different doses and therefore aid in the selection of the critical effect.
Figure 7. Example of presentation of all toxicity data for PFHxS.


