Statement on the EFSA Opinion on the risks to human health related to the presence of perfluoroalkyl substances in food
Introduction - Statement on the EFSA Opinion on the risks to human health related to the presence of perfluoroalkyl substances in food
In this guide
In this guideIntroduction
1. The European Food Safety Authority (EFSA) was asked, by the European Commission, to prepare an Opinion on the risks to human health related to the presence of perfluoroalkylated substances (PFASs) in food, and to consider existing hazard assessments and available occurrence data. The statement was published in September 2020.
2. The Committee on Toxicity of Chemicals in Food, Consumer products and the Environment (COT) have reviewed the EFSA Opinion Risk to human health related to the presence of perfluoroalkyl substances in food (2020) and considered the outputs alongside UK exposure data to assess the potential risks to the UK population from PFASs (predominantly through exposure via the diet).
Background - Statement on the EFSA Opinion on the risks to human health related to the presence of perfluoroalkyl substances in food
In this guide
In this guide3. Per- and polyfluoroalkyl substances (PFAS) with a minimum of six carbons in their backbone, are a class of over 12,000 fluorinated substances (US EPA CompTox Dashboard 2022) that have been produced since the 1940s and which are or have been used in a broad range of consumer products and industrial applications (Glüge et al., 2020). The polarity of their structure enhanced their utility in the production of water- and oil-resistant clothing, electronics, non-stick cookware, carpets, and food packaging materials.
4. Many PFAS are environmentally long-lived and individuals are exposed to them through drinking water, air, dust, and the diet and through placenta and breastfeeding for developing offspring (Sunderland et al., 2019).
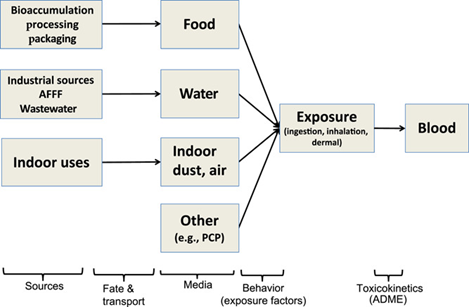
Figure one shows a diagram of cream coloured boxes and black text with black directional arrows. below these boxes are a diagonal list of 5 poly- and perfluoroalkyl substance (PFAS) sources.
Figure 1. Schematic of exposure assessment steps for humans that relates poly- and perfluoroalkyl substance (PFAS) sources to exposure media and internal concentrations of PFAS in blood. Not all possible exposure routes (e.g., outdoor air) or arrows are shown. ADME = absorption, distribution, metabolism and excretion. AFFF = aqueous film-forming foam; PCP = personal care product. (Figure taken from de Silva 2021)
5. There are differing definitions for PFASs but in the 2020 EFSA opinion they are defined as (R-X) substances where R is a hydrophobic alkyl chain of varying length (typically C4-C16) and X is a hydrophilic end group. The hydrophobic part (R) may be fully or partially fluorinated. The PFASs are highly persistent due to the strong covalent C-F bond. Many PFASs are potential precursors of other PFASs (EFSA, 2018). These precursors are not usually environmentally persistent but may be transformed to more persistent PFASs, in the environment through biodegradation (EFSA, 2020).
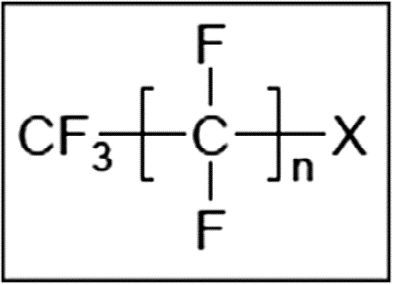
Figure 2 is an image of the general structure of PFASs. It has dark grey text on a white background in a box with a dark outline.
Figure 2. General structure of PFASs.
6. In their current Opinion, EFSA considered 27 PFASs covering several different groups.
7. Perfluoroalkyl carboxylic acids (PFCAs): Perfluorobutanoic acid (PFBA), Perfluoropentanoic acid (PFPeA), Perfluorohexanoic acid (PFHxA), Perfluoroheptanoic acid (PFHpA), Perfluorooctanoic acid (PFOA), Perfluorononanoic acid (PFNA), Perfluorodecanoic acid (PFDA), Perfluoroundecanoic acid (PFUnDA), Perfluorododecanoic acid (PFDoDA), Perfluorotridecanoic acid (PFTrDA), Perfluorotetradecanoic acid (PFteDA), Perfluoropentadecanoic acid (PFPeDA), Perfluorohexadecanoic acid (PFHxDA), Perfluorooctadecanoic acid (PFODA).
8. Perfluoroalkane sulfonic acids (PFSAs): Perfluorobutane sulfonic acid (PFBS), Perfluorohexane sulfonic acid (PFHxS), Perfluoroheptane sulfonic acid (PFHpS), Perfluorooctane sulfonic acid (PFOS), Perfluorodecane sulfonic acid (PFDS).
9. 7 others groups, which include respectively: Perfluorooctane sulfinic acid (PFOSI), 8:2 Fluorotelomer alcohol (8:2 FTOH), 8:2 Fluorotelomer phosphate monoester (8:2 monoPAP), 8:2 Fluorotelomer phosphate diester (8:2 diPAP), Perfluorooctane sulphonamide (FOSA), N-ethyl perfluorooctane sulphonamide (EtFOSA), N-ethyl perfluorooctane sulfonamidoethanol (EtFOSE) and Ammonium bis[2-[N-ethyl (hepatodecafluorooctane) sulphonylamino]ethyl]phosphate (FC-807).
10. PFASs are reported to be, or have been, used in a wide range of products including: “oil-, water- and stain resistant coatings for clothing, personal protective equipment, workwear, leather and carpets; oil-resistant coatings for food contact materials; aviation hydraulic fluids; fire-fighting foams; paints, adhesives, waxes and polishes; in industrial applications as surfactants, emulsifiers and coatings and personal care products including cosmetics”. The production volume for each of these uses is not publicly available. Their use in a wide range and numerous applications and products is predominantly due to their unique properties including: the ability to create stable foams, chemical resistance and surface tension lowering properties. (EFSA, 2020).
11. The 27 PFASs considered by EFSA in their 2020 Opinion are surfactants, intermediate environmental transformation products, surface protection products or major raw materials for surfactant and surface protection products. There are at least 3,000 PFASs on the global market, however, there is very little information on the production and use for most. Therefore, it is generally not known how much has been, or will be, released, transformed and accumulated in the environment. Due to their persistence and relatively water-soluble nature, many of these compounds may be transported long distances in water and also as aerosols (EFSA, 2020).
12. PFASs are present in food, mainly through two processes: accumulation in aquatic and terrestrial food chains and transfer from contact materials used in food packaging and processing. PFASs have been measured in ‘fish’, ‘eggs and egg products’, ‘livestock meat’, ‘fruit and fruit products’, drinking water’, ‘vegetable and vegetable products’, ‘alcoholic beverages’, ‘food for infants and small children’.
13. Releases to the environment occur during the production, use, and disposal of materials containing PFAS (de Silva 2021). Exposure pathways for PFAS can be considered as a chain of events, shown in Figure 1, linking sources to media (via fate and transport) to external exposure (via behavioural factors) to concentrations in blood, the body’s central compartment (via toxicokinetics). Exposure routes that are typically examined for PFAS include dietary ingestion, water ingestion (particularly in contaminated communities), and inhalation of air and dust particles. Hand-to-mouth contact and dermal absorption can also be relevant pathways.
Legislation
14. The legal status of PFOS and PFOA has been summarised in the 2018 EFSA Scientific Opinion (EFSA, 2018). In brief, PFOS, including its salts and perfluorooctane sulfonyl fluoride (PFOSF), is now listed in Annex I of the persistent organic pollutants (POP) regulation (Regulation (EU) 2019/1021) and added to Annex B (Restriction) of the Stockholm Convention. PFOS is not allowed for use in the production of plastics food contact materials (FCM) Commission Regulation (EU) No 10/2011. Under Commission Regulation (EU) 2019/1021 the use of PFOS and PFOS related substances is prohibited. There is only one time-limited exemption remaining: the use of PFOS as a mist suppressant for non-decorative hard chromium (VI) plating in closed loop systems (EA).
15. PFOA also has a number of restrictions placed on it within the European Union Article 76(1)(e) of Regulation (EC) No 1907/2006.
16. Currently, no other PFASs addressed in the EFSA 2020 Opinion have been legally restricted in Europe with respect to production, marketing or use. There are a number of initiated or ongoing activities which aim to reduce human and environmental risk connected to a number of the PFASs discussed in the 2020 EFSA Opinion (EFSA, 2020).
Previous evaluations
17. EFSA considered evaluations on PFOS and PFOA that had been carried out since their Opinion from 2018 and previous risk assessments for PFASs other than PFOS and PFOA.
18. The 2018 EFSA Opinion (EFSA, 2018) included tolerable weekly intakes (TWIs) of 13 and 6 ng/kg bw per week for PFOS and PFOA, respectively. These were based on human epidemiological studies. For PFOS, the increase in serum total cholesterol in adults, and the decrease in antibody response at vaccination in children were identified as the critical effects. Increase in serum total cholesterol was the critical effect identified for PFOA. Reduced birth weight was also considered a critical effect for both compounds and increased prevalence of high serum levels of the liver enzyme alanine aminotransferase (ALT) for PFOA.
19. Risk assessments have also been carried out by:
i. the Swedish Environmental Protection Agency (2012) which assessed 23 PFASs (PFBS, PFPS, PFHxS, PFHpS, PFOS, PFOSi, PFOSA, EtFOSA, PFDS, PFBA, PFPeA, PFHxA, PFHpA, PFOA, PFNA, PFDA, PFUnDA, PFDoDA, PFTrDA, PFTeDA, PFPeDA, PFHxDA, 6:2 FTSA) in Sweden (Swedish Environmental Protection Agency, 2012).
ii. the Danish Environmental Protection Agency (2015) which reviewed FOSA (Danish EPA, 2015).
iii. the French Agency for Food, Environmental and Occupational Health and Safety (ANSES) published an opinion on PFBA, PFHxA, PFBS and PFHxS (ANSES, 2015).
iv. The German Human Biomonitoring (HBM) Commission established drinking water guide values for PFBA, PFHxA, PFHpA, PFOA, PFNA, PFBS, PFHxS, PFOS and Health-based orientation values for PFPeA, PFHpA, PFDA, PFHPs and FOSA (Bundesgesundheitsblatt 2017, 60:350-352).
v. Food Safety Australia New Zealand (FSANZ) published a hazard assessment report for PFOS, PFOA and PFHxS (FSANZ, 2017).
vi. The Department of Environmental Protection (New Jersey, US) developed a Health-based Maximum Contaminant level for PFOA (DEP, 02/2017), PFOS (DEP, 11/2017) and PFNA (DEP, 10/2017).
vii. The ATSDR (2018) has prepared a draft for public comment on the Toxicological profile of 14 PFASs (PFOS, PFOA, PFBA, PFHxA, PFHpA, PFNA, PFDA, PFUnDA, PFDoDA, PFBS, PFHxS, FOSA, 2-(N-methyl-erfluoroocatanesulfonamido) acetic acid and 2-(N-ethyl-perfluorooctane-sulfon-amido) acetic acid.
viii. RIVM (2018) published a Relative Potency Factor approach for 19 PFASs (PFBA, PFPeA, PFHxA, PFHpA, PFOA, PFNA, PFDA, PFUnDA, PFDoDA, PFTrDA, PFTeDA, PFHxDA, PFODA, PFBS, PFPeS, PFHxS, PFHpS and PFOS.
ix. Michigan Science Advisory Workgroup Recommended Health-based Drinking Water Values for six PFASs (PFHxA, PFOA, PFNA, PFBS, PFHxS and PFOS). (Michigan Science Advisory Workgroup71, 2019)
Summary of 2020 EFSA evaluation
In this guide
In this guideHazard identification and characterisation
Toxicokinetics
20. This new Opinion reviews data on the toxicokinetics of PFASs in animals and humans. PFOS and PFOA toxicokinetics studies published prior to 2017 are included in previous EFSA Opinions. Additional studies published since 2017 are analysed and reported in the 2020 Opinion.
Experimental animals
21. Most of the information on the fate of PFASs and PFCAs is based on PFOS and PFOA, respectively. These compounds are readily absorbed in the gastrointestinal (GI) tract in mammals and distribute predominantly to the plasma as well as other parts of the body, and depending on the PFAS, they tend to accumulate in the liver. PFOS and PFOA are not metabolised and are excreted in both urine and faeces. They may be subject to extensive enterohepatic recirculation. Serum elimination half-lives for PFOS in rats and mice were slightly higher than one month whereas in rabbits and monkeys they were 3-4 months. Significant sex differences are observed in the elimination of PFOA in some species such as rats, for which half-lives may vary from a few hours in females, to several days in males. These differences in biological half-lives are mainly due to differences in renal clearance. For both PFOS and PFOA, maternal transfer occurs prenatally to the foetus through placental transfer and postnatally through the consumption of maternal milk.
Humans
22. Most of the human data published on the toxicokinetics of PFASs other than PFOS and PFOA are related to their distribution and elimination.
23. PFOS and PFOA have been reported to be extensively absorbed in humans and mainly distributed in plasma (predominantly bound to albumin), liver and kidney. PFOS and PFOA do not undergo metabolism and are eliminated in urine and bile. Biliary excretion of PFOS and PFOA is significantly higher than elimination via the urine, but does not predominantly contribute to overall elimination, due to high biliary reabsorption. Humans have a high percentage of PFOA renal tubular reabsorption, due to the high affinity of PFOA for human uptake transport proteins.
24. Several studies estimated half-lives of 2 and 6 years in humans for PFOS and PFOA respectively. Shorter chain PFCAs are preferentially excreted in urine, whereas PFNA and longer chain PFASs are preferentially eliminated through the bile and subsequently the faeces.
25. Extensive uptake from enterohepatic circulation and reabsorption by organic anion transport proteins (OATs) in the kidneys are believed to be more active processes in humans compared to rodents, slowing down the excretion of these substances. However, it is not clear which specific OAT(s) is/are responsible for this species difference.
26. Short-chain PFASs were found to have half-lives ranging from a few days (PFBA) to approximately 1 month (PFBS, PFHxA), whereas for PFHxS, PFOS, PFOA, PFNA, PFDA and PFUnDA, estimated half-lives can exceed 3 years and be up to approximately 8 years.
27. PFOS and PFOA have been detected in umbilical cord blood, breast milk and from the plasma of breastfed toddlers indicating that maternal transfer occurs pre- and postnatally. Longer fluoroalkyl chain length and a terminal sulfonate group are associated with lower fetal/maternal ratios.
28. Reports of high levels of PFASs in blood of individuals exposed to contaminated water indicate that gastrointestinal absorption of these compounds had occurred (Frisbee et al., 2009; Gyllenhammar et al.,2015).
29. No studies of metabolism of PFASs in humans were identified.
30. However, similar to experimental animals, humans are able to transform precursors to PFCAs and PFSAs.
31. Limited data were identified on the toxicokinetics of FTOHs and other precursors in humans. The FTOH metabolites FTCAs and FTUCAs were detected in the blood from ski wax technicians exposed through inhalation to high levels of 8:2 FTOH, suggesting metabolism of FTOH to PFOA and PFNA (Nilsson et al., 2013).
Toxicity - Statement on the EFSA Opinion on the risks to human health related to the presence of perfluoroalkyl substances in food
In this guide
In this guideObservations in experimental animals
32. Studies on effects following repeated exposures to PFOS and PFOA published prior to 2017 have been reviewed in previous EFSA Opinions. This statement summarises the toxicity of PFOS, PFOA, PFNA and PFHxS where the information is available or more generally for PFCAs and PFSAs. Some toxicity data are available for other PFASs. More detail on all of these studies is covered in the EFSA Opinion and in more detail in Appendices D to I of the opinion.
Effects following acute exposure
33. Considering the limited number of published data on acute exposure effects, studies on both oral and non-oral exposure were considered.
34. For the group of PFCAs, studies on PFHxA and PFDA were identified. The LD50s for PFHxA ranged between 1,750 and 5,000 mg/kg bw in female rats (route not stated but probably oral) and for PFDA between 120 and 129 mg/kg bw in female mice (oral gavage). In male mice, PFDA reduced the expression of major transporters for bile acids in the liver; as a result, 80 mg/kg bw increased serum bile acid concentrations. The same dose elevated the hepatic expression of the hepatic transporters Mrp3 and Mrp4 interfering with the hepatic efflux of bilirubin and bile acids to serum. Hepatocellular injury and inflammation at 50–80 mg of PFDA/kg bw were also reported .
35. With regard to other PFASs, EtFOSE did not alter peroxisomal ß-oxidation or relative liver weights, when administered i.p. to male rats at 100 mg/kg bw.
36. Cynomolgus monkeys, treated with a single dose of 9 mg PFOS/kg bw by gavage, showed no significant effects. A single gavage dose of 8:2 FTOH at 500 and 2,000 mg/kg bw exerted no effects in male and female rats.
Effects following repeated exposure
37. The most consistent and sensitive endpoint was increased relative liver weight, especially in male rodents, seen for all PFCAs studied.
38. Disturbances in lipid metabolism, hepatotoxic effects and signs of cholestasis were evident, mostly at higher dose levels. For some PFCAs, increased relative kidney weight, alterations of the mucosa in the nasal cavity and olfactory epithelium and disturbed thyroid hormone levels were among the most sensitive endpoints.
39. An elevated absolute and relative liver weight was the most sensitive endpoint for PFBS, PFHxS and PFOS. No repeated dose toxicity studies were available for PFHpS and PFDS. Disturbed lipid metabolism, necrosis and inflammation in the liver were mostly seen at higher dose levels. Also disturbed thyroid hormones and alterations in the kidney (PFBS only) were documented.
40. Studies were available for 8:2 FTOH and EtFOSE, while for FOSA and EtFOSA, no studies were identified. 8:2 FTOH treatment increased dose-dependently the relative liver weight and hepatic beta-oxidation. Liver toxicity was evident by histological changes, comprising vacuolation, cell swelling, immune cell infiltration, karyopyknosis and nuclear swelling. Several EtFOSE metabolites were present in liver and serum, with PFOS and FOSA being predominant. EtFOSE treatment lowered the body growth rate and increased the relative liver weight. Peroxisomal ß-oxidation activity was elevated non-significantly.
Developmental and reproductive toxicity
41. The 2018 EFSA Opinion documented reproductive and developmental toxicity studies for PFOS and PFOA published between 2008 and 2016. These studies are included in Appendix F of the current (2020) Opinion (Tables F.6 – F.8). Also included in these tables are some key studies evaluated by EFSA in their 2008 Opinion on PFOS and PFOA (EFSA, 2008).
42. PFOA exposure was shown to impair normal development of the mammary gland in mice exposed late in gestation or via lactation, in studies in two mouse strains, which was the most sensitive developmental outcome. The pup LOAEC was around 20 ng/mL on PND 22 corresponding to a maternal LOAEC of around 66 ng/mL. No NOAEC was identified.
43. The most sensitive endpoint after gestational exposure to PFNA was increased liver weight in both maternal and offspring mice, and a reduction in postnatal weight gain in F1, with an LOAEL of 1 mg/kg bw per day, and a corresponding concentration in serum from the dam at term of 20 µg/mL. Delay in development was seen at 3 mg/kg bw per day, and at 5 mg/kg bw per day, there was an increase in neonatal mortality. A 90-day male reproductive study reported decreased sperm production, decrease in cholesterol, steroidogenic enzymes and testosterone, as well as decreased number of pups in the next generation, with an NOAEL and LOAEL of 0.2 and 0.5 mg/kg bw per day, respectively. Effects on male reproduction parameters were also reported by NTP in rats at higher exposure levels (it was noted by EFSA that 28 days is shorter than one spermatogenic cycle and too short to fully assess male reproductive parameters).
44. Exposure of rats to PFDoDA prior to and during gestation induced maternal and reproductive effects (continuous dioestrus and fetal loss) with an NOAEL of 0.5 mg/kg bw per day. Male reproductive effects (decreased spermatid and spermatozoa counts) were seen at a similar NOAEL of 0.5 mg/kg bw per day, which is higher than the NOAEL of 0.1 mg/kg per day observed for repeated dose toxicity in the same experiment.
45. Reproductive toxicity was not reported in rats exposed to PFBS up to 1,000 mg/kg bw per day. Delay in development and decrease in body weight gain were seen in mice exposed during gestation, with an NOAEL of 50 mg/kg bw per day (74 ng/mL serum in the dam at GD 20).
46. The most sensitive reproductive endpoint for PFHxS exposure was reduced litter size at 1 mg/kg bw per day in mice (51.5 µg/mL serum on GD 18 in dams) with an NOAEL of 0.3 mg/kg bw per day (16.8 µg/mL serum on GD 18 in dams). At 1 mg/kg bw per day, increased liver weight was seen in the dams. Gestational exposure to PFHxS produced effects in offspring animals at doses which were equal to or higher than those inducing responses in parental animals.
Neurotoxicity
47. In 2018, EFSA concluded that both PFOS and PFOA exert developmental neurotoxic effects in rodents. The behavioural analysis showed that the most frequent alterations observed are related to locomotor activity. PFOS exposure mostly decreased spontaneous activity, while PFOA increased it. In several neurodevelopmental exposure studies, a sex-related difference has been observed with males being more sensitive than females.
48. One study indicates that PFDoDA, in contrast to PFDA and PFOA, can efficiently transfer into rat brain and causes cognitive behavioural changes.
Immunotoxicity
49. The majority of studies for immunotoxicity of PFOS had already been assessed in the 2018 Opinion and are reviewed again in the current Opinion. The studies have different study design, duration, use different strains of mice or rats, applied different doses of PFOS and investigated different parameters that may highlight effects on the immune system. Two immunotoxicity studies had been published since the 2018 Opinion and are reviewed in this Opinion.
50. This literature supports the view that PFOS exposure, possibly more than PFOA, causes immunosuppression, as evidenced by decreased antibody responses to sensitisation to an antigen, and that suppressed immune functionality may lead to reduced resistance to infection.
51. Immunotoxicity studies for PFOA were reviewed in the previous Opinion and nothing additional has been published since then. The effects of PFOA in mice are similar to those of PFOS, with both structural and functional parameters influenced. However, the effects were observed at higher doses than with PFOS.
52. Data on PFAS other than PFOS and PFOA are rather limited with studies only available for PFNA and PFDA.
Genotoxicity
53. The CONTAM Panel reviewed the studies for genotoxicity for PFOS and PFOA in the 2018 Opinion and concluded that the available data were inconclusive. There was no evidence for a direct genotoxic mode of action for PFOS or PFOA. There has been some evidence for oxidative stress induction by both compounds. Three new studies and two NTP reports have been published since the 2018 Opinion but these do not change the conclusion reached in that Opinion.
54. For PFASs other than PFOS and PFOA the CONTAM Panel concluded that the study and data availability are limited. Due to structural similarity between PFOA and PFNA and between PFOS and PFHxS and some evidence for oxidative stress induction by PFNA and PFHxS it is unlikely that there is a direct genotoxic mode of action for PFNA and PFHxS.
Long-term toxicity and carcinogenicity
55. Long-term toxicity and carcinogenicity studies of PFOS and PFOA reviewed by EFSA previously (EFSA, 2008; EFSA CONTAM Panel, 2018) showed that both compounds are tumour promoters in rodent liver and PFOA may also induce Leydig cell tumours in rats. No new carcinogenicity studies were identified.
56. A few studies were available for long-term and carcinogenic assessment of other PFASs. A long-term study for PFHxA provided no evidence for any carcinogenicity. PFNA and PFDA showed tumour promoting capacity in a trout two-stage model of hepatocarcinogenesis, while 8:2FTOH showed no such activity. For the remaining PFASs considered in the EFSA Opinion there is no information on their carcinogenic potential.
Observations in humans
57. Regarding the four outcomes (increased serum cholesterol, impaired antibody response after vaccination, increased serum ALT, and decreased birth weight) that were considered potential critical effects in the Opinion on PFOS and PFOA (EFSA CONTAM Panel, 2018), key studies published after the deadline of the literature review for the PFOS and PFOA Opinion (EFSA CONTAM Panel, 2018), were also considered.
Fertility and pregnancy outcomes
Birth weight
58. In the 2018 Opinion on PFOS and PFOA, the CONTAM Panel reviewed 13 prospective studies and four cross-sectional studies that had examined associations between PFOS and/or PFOA and birth weight. Relatively modest but consistent inverse associations with birth weight were observed for both compounds. This association may be partly confounded by physiological changes in pregnancy. The CONTAM Panel concluded that there may still be an association between PFOS and PFOA exposure and birth weight.
59. Since the 2018 EFSA Opinion, eight new studies have been published on PFOS and PFOA. None of these studies contradicted the conclusion from the 2018 Opinion that “there may well be a causal association between PFOS and PFOA and birth weight”.
60. For PFASs other than PFOS and PFOA, concentrations in studies were generally much lower compared to PFOS and PFOA and inconsistent associations with birth weight were observed.
Preterm delivery time to pregnancy, miscarriage and hypertension in pregnancy – preeclampsia
61. Studies for the above four endpoints were reviewed by the CONTAM Panel in 2018 and for each there was insufficient evidence to suggest that PFOS and/or PFOA exposures were associated with the effect. There was one study which had been published (Meng et al., 2018) which looked at preterm delivery and maternal serum PFAS, but the data were in line with the conclusions of the 2018 Opinion.
Developmental effects
62. The CONTAM Panel reviewed studies on developmental effects and PFOS and PFOA in the 2018 Opinion. Studies for PFASs other than PFOS and PFOA were reviewed for the current Opinion. For all PFASs the CONTAM Panel concluded that there was insufficient evidence to suggest that PFASs may affect neurobehavioural development or overweight.
Neurotoxic outcomes
63. Studies for PFOS and PFOA were reviewed for the 2018 Opinion and other PFASs were reviewed for the current Opinion. The CONTAM Panel concluded that there is insufficient evidence to suggest that exposures to PFASs may adversely affect neurobehavioural, neuropsychiatric and cognitive outcomes.
Immune outcomes
Asthma and allergies in children in adults
64. In the 2018 Opinion the available studies were reviewed for PFOS and PFOA and the Panel concluded “that there is not much evidence to suggest that PFOS or PFOA are associated with asthma and allergies in children and adults”. Since then, five new prospective studies have been published and reviewed by the CONTAM Panel for PFOS, PFOA and all other PFASs. These new studies did not change the conclusion from the previous 2018 Opinion.
65. The CONTAM Panel also reviewed any studies for PFASs other than PFOS and PFOA. The CONTAM Panel concluded that the available evidence was insufficient to suggest that exposures with PFASs are associated with allergy and asthma in children and adults.
Vaccination response
66. In the previous Opinion on PFOS and PFOA six studies were reviewed. Since then, three more studies have been published. The 2 studies (Grandjean et al., 2012; Abraham et al., 2020) used in the process of the derivation of the HBGV are described in more detail in this draft statement and appendices L and K of EFSA (2020) for the Grandjean et al and Abraham et al studies, respectively.
67. Grandjean et al. (2012) examined associations between both pre- (gestation week 32) and postnatal (5 years) serum concentrations of PFASs and offspring antibody concentrations against tetanus and diphtheria following booster vaccination at age 5 years (cohort 3, n=456-587, 1997-2000). Post-natally, serum PFASs and pre-booster antibody concentrations were measured at a mean age (SD) of 5.0 (0.1) years. Serum antibody response was then measured about 4 weeks after booster vaccination and at offspring age 7.5 (0.1) years. The median concentrations for antibody titres to tetanus were 0.22 IU/mL at 5 years pre-booster, 35 IU/mL at 5 years post booster and 1.6 IU/mL at 7.5 years. For diphtheria the corresponding numbers were 0.12, 13.0 and 0.68 IU/m, respectively. Associations between offspring PFAS concentrations at age 5 pre-booster with antibody titres at age 5 years post-booster and 7.5 years post-booster can be interpreted as a short- and long-term influence on the efficacy of the booster vaccination, respectively. This study is interventional as well as observational, in that vaccination was an deliberative procedure. The large increase in antibody concentration is initiated through vaccination and this increase is examined in relation to baseline PFASs concentrations. The interpretation of associations reported between maternal PFAS concentrations and offspring antibody concentrations during childhood are, however, more challenging, as several vaccinations are administered from birth at various timepoints. Furthermore, among breastfed infants, maternal PFAS concentrations are, due to exposure through breastfeeding, strong determinants of offspring concentrations during the first few years of life. Several associations were explored in this study and the results are summarised below:
68. Association between maternal PFAS concentrations and antibody concentrations at ages 5 (pre- and post-booster) and 7.5:
PFOS: Mean concentration in maternal serum was 27.3 ng/mL. Each 2-fold increase in maternal PFOS concentrations was associated with -39 % (95 % CI: -55, -17) and -21 % (95 % CI: -38, 1) decrease in diphtheria antibody concentrations at 5 years pre- and post-booster, respectively. Non-significant but inverse direction associations were observed for tetanus antibody concentrations.
PFHxS: Maternal concentrations of PFHxS (mean: 4.4 ng/mL) were not associated with antibody concentrations to tetanus or diphtheria at age 5 years pre- and post-booster.
PFOA: Maternal concentrations of PFOA (mean: 3.2 ng/mL) showed a non-significant inverse association with antibody concentrations to diphtheria at age 5 years pre- and post-booster while the associations for tetanus were in opposite directions at pre- and post-booster, neither of them being significant.
PFNA: Similar to PFOA, maternal concentrations of PFNA (mean: 0.6 ng/mL) showed a non-significant inverse association with antibody concentrations to diphtheria at age 5 years pre- and post-booster, while the associations for tetanus were centred around the NULL.
PFDA: Maternal concentrations of PFDA (mean: 0.3 ng/mL) were significantly and inversely associated with antibody concentrations to diphtheria (around 20 % decrease per 2-fold increase) at age 5 years pre- and post-booster. No association was observed for tetanus.
Combined exposures: Structural equations were used to evaluate the associations for combined exposure to PFOS, PFHxS and PFOA during pregnancy and in relation to offspring antibody response to diphtheria and tetanus at age 5.0 years pre-booster and at age 7.5 years pre-booster. A 2-fold increase in maternal concentrations during pregnancy was significantly associated with -48 % (95 % CI: -68, -16) and -42 % (95 % CI: -66, -1) decrease in serum antibody response to diphtheria at age 5 pre-booster and age 7.5 post-booster, respectively. No associations were observed for tetanus.
69. Association between offspring PFAS concentrations at age 5 and offspring antibody concentrations at ages 5 and 7.5 years:
PFOS: Each 2-fold increase in offspring PFOS concentrations at 5 years pre-booster (mean 16.7 ng/mL) was associated with -29 % (95 % CI: -46, -6) and -24 % (95 % CI: -44, 4) change in post-booster antibody response to tetanus at ages 5-year and 7.5 years, respectively. The corresponding estimates for diphtheria were -16 % (95 % CI: -32, 4) and -28 % (-46, -3), respectively.
PFHxS: At age 5 years pre-booster, 2-fold offspring concentrations of PFHxS (0.6 ng/mL) were significantly associated with -19 % (95 % CI: -30, -7) lower tetanus antibody concentration at 5 years post-booster and -20 % (95 % CI: -32, -6) lower concentration was observed for diphtheria for these two timepoints.
PFOA: At 5 years of age, pre-booster offspring concentrations of PFOA (4.1 ng/mL) showed a weak but inverse association with antibody response to tetanus and diphtheria post-booster at age 5 years (6-13 % decrease). At age 7.5 years the association for both antibody titres to diphtheria and tetanus was, however, strongly significant, corresponding to around ~25 % decrease per 2-fold increase in PFOA.
PFNA: At 5 years pre-booster, each 2-fold increase in offspring PFNA concentrations (mean: 1.0 ng/mL) was associated with around 15-20 % decrease in antibody response to diphtheria and tetanus at age 5- and 7.5-years, although formal significance was not always reached.
PFDA: At 5-years pre-booster, each 2-fold increase in PFDA (mean: 1.0 ng/mL) concentrations was associated with around 10-20 % decrease in antibody response to diphtheria and tetanus at 5- and 7.5-years post-booster, although formal significance was reached only for tetanus.
Combined exposures: Structural equations were used to evaluate the associations for combined exposures to PFOS, PFHxS and PFOA at offspring age 5 years (pre-booster) in relation to offspring antibody response to diphtheria and tetanus at age 5 years pre-booster and at age 7.5 years post-booster. A 2-fold increase in offspring serum levels at age 5 years pre-booster showed a non-significant inverse association with antibody concentrations age 5 years pre-booster. A 2-fold increase in combined exposures at age 5.0 years pre-booster was, however, significantly associated with a -44 % (95 % CI: -66, -11) and -55 % (95 % CI: -73, -25) decrease in serum antibody response to diphtheria and tetanus at age 7.5, respectively.
Low antibody levels: At age 5 years pre-booster, a 2-fold increase in PFOS concentrations was associated with 1.6 (95 % CI: 1.1, 2.3) higher odds of being below a protective antibody level (0.1 IU/mL) against diphtheria. The corresponding estimates for PFOA was OR 1.2, 95 % CI: 0.8-1.7. Slightly elevated but non-significant OR were observed for tetanus. At age 7.5 years concentrations of PFOS and PFOA at age 5 years were associated with 2.4 (95 % CI: 0.9, 6.4) and 3.3 (95 % CI: 1.4, 7.5) higher odds of being below protective antibody levels against diphtheria. Similar elevated odds were reported for tetanus at age 7.5.
70. Co-exposures: Concerning possible confounding by other co-exposures, PCBs in maternal samples and offspring samples at age 5 years showed a weak correlation with individual PFASs. Adjustment for these co-exposures had no impact on the effect estimates. Hence, it is unclear whether the associations reported previously for PCBs were due to confounding by exposure to PFASs. With respect to individual PFASs, the correlation between the five substances at offspring age 5 years ranged between 0.2 and 0.8. The strongest correlation was observed between PFNA and PFDA, while for PFOS and PFOA the correlation was ~0.5. Other pair-wise correlations were weaker. The authors performed benchmark dose (BMD) analyses for each of the five PFASs in serum of the 5-year-old children in relation to antibody response at 5 and 7.5 years. The results were reported with and without mutual adjustment for PFOS and PFOA (Budtz-Jorgensen and Grandjean, 2018). In short, the modelling showed that both PFOS and PFOA, in statistical terms, were associated with antibody concentrations independent of each other (not confounded).
71. In a cohort of 101 infants from Germany, Abraham et al., (2020) examined the association between plasma concentrations of PFHxS, PFOS, PFOA and PFNA and antibodies to diphtheria, tetanus and haemophilus influenzae type b (Hib). Mothers and their children were recruited in 1997-1999 when the infants were between 341 and 369 days old. Of these 21 were formula fed (≤2 weeks of breastfeeding) and 80 were breast fed for >4 months. When combining exclusive and partial breastfeeding into “equivalent to exclusive breastfeeding” the median duration was 7.4 months. Mean levels of PFASs in plasma from, respectively, non-breastfed and breastfed infants were for PFOA 3.8 and 16.8 ng/mL, for PFOS 6.8 and 15.2 ng/mL, for PFHxS 1.7 and 2.1 ng/mL and for PFNA 0.2 and 0.6 ng/mL. For the mothers, the mean concentrations in plasma among those who did not breastfeed (n=21) and those who breastfed (n=80) were for PFOA 4.9 and 3.2 ng/mL, for PFOS 17.2 and 14.1 ng/mL, for PFHxS 1.8 and 1.0 ng/mL and for PFNA 0.4 and 0.3 ng/mL. Higher concentrations in plasma among breastfed infants and lower concentrations among mothers who breastfed is explained by lactational transfer of PFASs from the mother to the baby. This transfer into breast milk is more effective for PFOA compared to PFOS, which also explains the differences in PFOS/PFOA ratio between mothers and infants.
72. Concentrations of PFOA in infant plasma were significantly and inversely correlated with antibody concentrations to diphtheria (r=-0.23, p=0.02), tetanus (r=-0.25, p=0.01) and Hib (r=-0.32, p=0.001). Analyses were adjusted for time since last vaccination and for tetanus also the number of vaccinations. Adjustment for other co-contaminants quantified in infant blood, including PCBs, dioxins (I-TEQ), organochlorine pesticides, mercury, cadmium and lead did not influence these associations. Adjustment for duration of exclusive breastfeeding had no relevant influence. The NOAECs for PFOA, estimated by dividing exposure into quintiles, ranged between 18.9 and 19.4 ng/mL, depending on the type of antibody titres. In terms of effect size the mean reduction in antibody response when comparing the highest to lowest quintile of PFOA exposure was -57 %, -53 % and -78 % for diphtheria, tetanus and Hib, respectively. Associations for PFOS, PFHxS and PFNA were not significant. Upon request from EFSA, the authors provided analyses of the associations with the sum of PFOA, PFNA, PFHxS and PFOS (EFSA Opinion, Appendix K). Similar to PFOA, the sum of the four PFASs was significantly and inversely correlated with tetanus and Hib, while the correlation for diphtheria was borderline significant.
73. In summary, the different compounds appear to show significant findings across different studies. This is not unexpected as there are differences in the concentrations and mixture compositions. It is therefore difficult to know whether one of the PFASs is more potent. A more detailed analyses of the Grandjean et al., (2012) study carried out by Budtz-Jorgensen and Grandjean (2018) suggests that both PFOS and PFOA may affect antibody response independently.
74. The studies published since the 2018 Opinion strengthen the conclusion that both PFOS and PFOA are associated with reduced antibody response to vaccination, although there are some inconsistencies. The evidence for other PFASs is weaker, possibly because the concentrations are lower.
Clinical Infections
75. There is some evidence to suggest that exposures to PFASs are associated with increased propensity of infections, but more studies with objective measures of infections (not self-reporting) are needed.
Endocrine effects
76. The CONTAM Panel reviewed studies which looked at PFOS, PFOA and other PFASs in thyroid function and disease, male fertility and puberty and female fertility, menstrual cycle and puberty and concluded that there was insufficient evidence available to suggest that the PFAS exposures are associated with effects on these endpoints.
Metabolic outcomes
Blood lipids
77. In the 2018 Opinion the CONTAM Panel concluded that “it is likely that associations between serum PFOS and PFOA levels and serum cholesterol are causal and that an increase in cholesterol was considered adverse”.
78. Associations between PFOS/PFOA and cholesterol have been reviewed by the CONTAM Panel again after external comments to the previous Opinion. This review included some studies published since the 2018 Opinion. The current conclusion is that the uncertainty regarding causality is larger than that stated in the previous Opinion.
79. The CONTAM Panel reviewed 12 studies on associations between cholesterol and PFASs other than PFOS and PFOA. The results were mostly inconsistent. However, in almost all studies significant associations were found with PFNA and total cholesterol. The data suggest that PFNA shows an association with serum cholesterol which is independent from PFOS/PFOA.
Diabetes, Obesity and Metabolic Syndrome
80. In the 2018 Opinion the studies reviewed led the CONTAM Panel to conclude that there was no evidence that PFOS or PFOA increases the risk of metabolic disease. Studies reviewed for the current Opinion for PFASs other than PFOS and PFOA are inconsistent.
Liver
81. In the previous Opinion the CONTAM Panel considered that the association between PFOA and elevated ALT was causal, but the adversity of an increase that was within the normal range was considered uncertain since the increase in ALT per unit PFOS/PFOA was small and no association with liver disease was shown. The data for PFOS was inconsistent. Studies published since the previous Opinion have been reviewed by the CONTAM Panel and are in agreement with the conclusion in the 2018 EFSA Opinion.
82. The CONTAM Panel reviewed studies on PFASs other than PFOS and PFOA and the results indicate positive associations between PFHxS/PFNA and serum ALT. However, the association was modest in most of the studies.
83. The available evidence on associations between ALT and PFASs is insufficient for use as the basis for an HBGV.
Kidney function and uric acid
84. When reviewed in the 2018 Opinion studies showed that there were relatively strong associations between serum PFOS/PFOA and estimated glomerular filtration rate (GFR) as well as serum uric acid. However, taking into account that some reverse causality is plausible, that there may be confounding, and no significant associations were shown between PFOS/PFOA and chronic kidney disease, the CONTAM Panel considered the evidence that PFOS/PFOA exposures causes reduced GFR insufficient. For studies with other PFAS there was insufficient evidence to conclude that exposures to PFASs were associated with a decrease GFR or increase uric acid in serum.
Carcinogenicity outcomes
85. When the CONTAM Panel (2018) reviewed studies on cancer incidence and cancer mortality, they provided limited evidence that exposure to PFOS or PFOA are related to cancer risk. Studies with PFOS, PFOA and other PFASs published since the 2018 Opinion have been reviewed and provide no evidence for a link between exposure to PFASs and cancer risk.
Cardiovascular disease and mortality
86. In the previous Opinion (2018) studies examining associations of PFOS/PFOA exposure and cardiovascular outcomes were reviewed. The studies did not show any clear association between PFOS/PFOA exposure and cardiovascular disease.
87. When studies which looked at other PFASs exposure and cardiovascular disease were reviewed by the CONTAM Panel it was noted that some recent studies suggest an association between exposure to PFAS and cardiovascular disease, but insufficient for use as the basis of an HBGV.
Bone mineral density
88. Two studies that examined associations between PFOS/PFOA and bone mineral density were reviewed (2018) and some inverse associations were noted (with caveats). The magnitude of the associations was small and may be due to reverse causation or residual confounding. Only one study was available to review for other PFASs. The findings from this single study are insufficient as evidence that PFNA or PFHxS has an impact on bone mineral density.
Mode of Action
89. In animals, the most commonly reported effects are those on the liver (increased weight, hypertrophy, increased fat content) and the levels of thyroid hormones, cholesterol and triglycerides, and liver transaminases in serum. In addition, some PFASs were shown to cause liver tumours.
90. Furthermore, effects on the immune system, as well as on the development of the mammary gland, were observed in various studies, often at lower levels than those causing effects on the liver and thyroid hormones.
91. The MoA behind the most sensitive PFOA effect, which is a decrease in mammary gland development in animals dosed during gestation and neonatally, is unknown. Normal mammary gland development does not require PPARα expression, but PPARα activation in pregnancy can reduce mammary gland development in the dam.
Exposures - Statement on the EFSA Opinion on the risks to human health related to the presence of perfluoroalkyl substances in food
In this guide
In this guide92. Most of the exposures calculated in the sections below are for individual PFASs. Exposures for the rest of the diet were calculated by EFSA (2020) and are for a sum of the four PFASs (PFOS, PFOA, PFHxS and PFNA). The estimated exposures have been calculated from small datasets.
93. The COT noted that the estimates are conservative. Furthermore, the dataset from Spain may have skewed overall estimates.
Dietary
Breast milk
Exposure calculation by EFSA (EFSA, 2020)
94. EFSA calculated exposures from breast milk. Infants with the greatest exposures via breast milk are those less than 6 months of age. EFSA used a median age of 3 months with an equivalent body weight of about 6.1 kg. Estimated average and high daily milk consumption of about 800 mL and 1,200 mL; respectively were used. Levels in milk have been investigated but were often below the LOQs of the method.
95. However, some studies determined the ratio between milk levels and maternal serum levels. These were approximately 0.015 for PFOS and 0.03 for PFOA. Based on the mean serum levels in adults of 7.5 ng/mL for PFOS and 2.1 ng/mL for PFOA, this would result in milk levels of 0.113 and 0.063 ng/mL, respectively.
96. For PFOS, a daily average and high consumption of 800 or 1,200-mL milk (EFSA NDA Panel, 2013) would result in an intake of 90 and 135 ng PFOS per day or, respectively, 15 and 22 ng/kg bw per day (103 and 155 ng/kg bw per week). For PFOA, the daily intake for average and high consumers would be 50 and 76 ng, or, respectively, 8 and 12 ng/kg bw per day (58 and 87 ng/kg bw per week).
Exposure calculation by the COT
97. A literature search was carried out for concentrations of PFASs in human breast milk. There were no UK data. Only data from countries in the EU with breast milk samples taken after 2008 were considered. Only those that had median and/or maximum values were included in the exposure calculations. Tables 1 to 4 in Annex A show PFOS, PFOA, PFHxS and PFNA breast milk concentration data and study information. Averages of the median and maximum values were calculated for each of the 4 PFASs (Tables 5 and 6, Annex B) which were used to calculate exposures for infants aged 0 - <4 months and 4 - <6 months (Table 1).
98. For the average median PFASs concentrations in breast milk the following ranges of exposures were calculated which included average and high consumers:
- PFOS: 38 – 75 ng/kg bw per week
- PFOA: 40 – 80 ng/kg bw per week
- PFHxS: 12 – 24 ng/kg bw per week
- PFNA: 14 – 27 ng/kg bw per week
99. For the average maximum PFASs concentrations in breast milk the following ranges of exposures were calculated which included average and high consumes:
- PFOS: 20 – 240 ng/kg bw per week
- PFOA: 30 – 260 ng/kg bw per week
- PFHxS: 22 – 43 ng/kg bw per week
- PFNA: 37 – 73 ng/kg bw per week
100. The average exposures were similar to those calculated by EFSA from serum levels. Exposures for high concentrations of PFOS and PFOA in breast milk were not calculated by EFSA because the available data were deemed insufficient to estimate exposures (EFSA, 2020).
Table 1. Estimated PFOS, PFOA, PFHxS and PFNA exposure (ng/kg bw per week) in 0 to 6-month-old infants from breast milk.
|
Exposure (ng/kg bw/week) |
0 to <4 months (800 mL) |
0 to <4 months (1,200 mL) |
4 to <6 months (800 mL) |
4 to <6 months (1,200 mL) |
|
PFOS concentration 53 ng/L |
50 |
75 |
38 |
57 |
|
PFOS concentration 170 ng/L |
160 |
240 |
120 |
180 |
|
PFOA concentration 56 ng/L |
53 |
80 |
40 |
60 |
|
PFOA concentration 180 ng/L |
170 |
260 |
130 |
190 |
|
PFHxS concentration 17 ng/L |
16 |
24 |
12 |
18 |
|
PFHxS concentration 30 ng/L |
28 |
43 |
22 |
32 |
|
PFNA concentration 19 ng/L |
18 |
27 |
14 |
20 |
|
PFNA concentration 51 ng/L |
48 |
73 |
37 |
55 |
Exposure values were calculated based on default consumption values of 800 and 1200 mL for average and high-level exclusive consumption of breast milk and expressed on a bodyweight (5.9 kg for infants aged 0-4 months and 7.8 kg for infants aged 4 to < 6 months) basis.
Rest of the diet
101. The EFSA Opinion included UK data both on occurrence and consumption. The UK specific data and exposures for the sum of the four PFASs (Table 1 and Annex B) are within, and towards the lower end of the range of data from the EU. The data for the UK use the National Diet and Nutrition Survey (NDNS) data (years 1-3) for consumption data for toddlers, other children, adolescents, adults, elderly and the very elderly. Consumption data from the Diet and nutrition survey in infants and young children (DNSIYC) was used to calculate exposures for infants and toddlers. The calculated exposures are shown in Table 2.
102. Exposures of infants were calculated to be 61 and 590 ng/kg bw per week for LB and UB mean consumers and 110 and 870 for LB and UB 95th percentile consumers. There are 2 sets of data for toddlers, one set using NDNS data and the other data from DNSIYC. Using the DNSIYC data toddler exposures were calculated as 29 and 460 ng/kg bw per week for LB and UB mean consumers and 74 and 770 ng/kg bw per week for LB and UB 95th percentile consumers, respectively. Generally, exposures calculated from the NDNS data are lower than those calculated from the DNSIYC data. Exposure estimates are 17 and 450 ng/kg bw per week for LB and UB mean consumers and 45 and 850 ng/kg bw per week for LB and UB 95th percentile consumers.
103. Exposures for other children were calculated to be 9.7 and 330 ng/kg bw per week for LB and UB mean consumers and 27 and 640 ng/kg bw per week for LB and UB 95th percentile consumers.
104. Adolescent exposures had been calculated and were 3.2 and 150 ng/kg bw per week for LB and UB mean consumers and 10 and 350 ng/kg bw per week for LB and UB 95th percentile consumers.
105. Exposures had also been calculated for adults, the elderly and the very elderly. Ranges for LB and UB mean consumers were 4.3 – 5.6 and 97 and 110 ng/kg bw per week, respectively. For LB and UB 95th percentile consumers, exposures were calculated as 13 – 15 and 200 – 220 ng/kg bw per week, respectively.
Table 2. Mean and 95th percentile(a) chronic exposures to the 4 PFASs (ng/kg bw per week) for total population.
|
Survey |
Age |
Number of subjects |
LB Mean exposure |
UB Mean exposure |
LB 95th Exposure |
UB 95th Exposure |
|
NDNS years 1-3 |
Toddlers |
185 |
17 |
450 |
45 |
850 |
|
NDNS years 1-3 |
Other children |
651 |
9.7 |
330 |
27 |
640 |
|
NDNS years 1-3 |
Adolescents |
666 |
3.2 |
150 |
10 |
350 |
|
NDNS years 1-3 |
Adults |
1266 |
4.3 |
97 |
13 |
200 |
|
NDNS years 1-3 |
Elderly |
166 |
5.5 |
100 |
14 |
210 |
|
NDNS years 1-3 |
Very elderly |
139 |
5.6 |
110 |
15 |
220 |
|
DNSIYC 2011 |
Infants |
1369 |
61 |
590 |
110 |
870 |
|
DNSIYC 2011 |
Toddlers |
1314 |
29 |
460 |
74 |
770 |
Drinking water
106. Drinking water is not routinely monitored for PFASs, but the Drinking Water Inspectorate (DWI) specifies that water companies should ensure that PFOS and PFOA are adequately addressed in their risk assessments, and that if appropriate, they should consider initiating monitoring for PFASs at their works. The DWI has established a tiered approach for monitoring levels of PFOS and PFOA in drinking water. The DWI have considered other PFAS, however based on occurrence data and modelling, the main conclusion was that it was unlikely that individual PFAS would be detected at concentrations greater than 0.1 µg/L. If a water company detects PFAS other than PFOS or PFOA it is expected that a precautionary approach be adopted and the DWI informed (DWI, 2021).
107. The recently revised guidance on the Water Supply Regulations, 2016 established updated guidance levels which have been set for water companies to take increasing action for both PFOS and PFOA levels >0.01 µg/L, >0.1 µg/L and >1.0 µg/L (DWI, 2021). The value of 0.1 µg/L has been established as a trigger level for further action to reduce concentrations. It is a pragmatic value that is broadly in line with assessments made by other developed countries based on animal data. The corresponding previous values from 2009 were PFOS 1.0 µg/L and PFOA 5.0 µg/L and were based on the 2009 COT TDIs. The value of 0.01 µg/L is a concentration that can be reliably and accurately measured using modern analytical techniques and is a trigger for further monitoring (DWI, 2021).
108. In discussions with the DWI, it was suggested that the concentrations that should be used for PFOS and PFOA for drinking water derived from surface and ground water are:
- 5 ng/L for drinking water derived from surface water. This is about the typical level found in river water, which will of course be subject to treatment. Most surface water will receive granular activated carbon (GAC) treatment which is likely to reduce the concentration. 5 ng/L is therefore reasonably conservative.
- 10 ng/L PFOS and PFOA in ground water derived drinking water. There are fewer data, and some will receive GAC treatment. Companies have reported that currently all supplies are below 100 ng/L which would be very conservative. Therefore, 10ng/L is reasonably conservative.
109. For other PFAS at present the data are relatively limited.
110. Chronic exposures were calculated with drinking water (including all tap and bottled water) using the values of 5 and 10 ng/L. Consumption data from NDNS years 1-8 (Bates et al., 2014; Bates et al., 2016; and Roberts et al., 2018) and DNSIYC (DH, 2013) were also used in the exposure calculations. All age groups were considered and include infants (4 - 18 months), toddlers (18 months – 3 years), children (4 – 10 years), adolescents (11 – 18 years), adults (19 – 64 years) and the elderly (65+ years).
111. Chronic mean exposures calculated for a PFAS concentration of 5 ng/l, as derived from surface water, across both NDNS and DNSIYC, ranged from 0.29 ng/kg bw per week (0.041 ng/kg bw per day) for consumers aged 65+ to 0.86 ng/kg bw per week (0.12 ng/kg bw per day) for toddlers (Table 3). Exposures calculated for 97.5th percentile consumers ranged from 0.85 ng/kg bw per week (0.12 ng/kg bw per day) for consumers aged 65+ to 2.5 ng/kg bw per week (0.35 ng/kg bw per day) for toddlers (Table 3).
112. Chronic mean exposures calculated with a PFAS concentration of 10 ng/L, as derived from ground water, across both NDNS and DNSIYC, ranged from 0.57 ng/kg bw per week (0.081 ng/kg bw per day) for consumers aged 65+ to 1.7 ng/kg bw per week (0.25 ng/kg bw per day) for toddlers (Table 4). Exposures calculated for 97.5th percentile consumers ranged from 1.7 ng/kg bw per week (0.24 ng/kg bw per day) for consumers aged 65+ to 4.9 ng/kg bw per week (0.71 ng/kg bw per day) for toddlers (Table 4).
Table 3. Exposure estimates (ng/kg bw per week) calculated with a PFAS concentration of 5 ng/L.
|
Age groups |
Mean
|
97.5th percentile |
|
Infants (4-18 months) |
0.59 |
2.1 |
|
Toddlers (18 months – 3 years) |
0.86 |
2.5 |
|
4 – 10 years |
0.61 |
1.7 |
|
11 – 18 years |
0.34 |
1.1 |
|
19 – 64 years |
0.37 |
1.1 |
|
65+ years |
0.29 |
0.85 |
Table 4. Exposure estimates (ng/kg bw per week) calculated with a PFAS concentration of 10 ng/L.
|
Age groups |
Mean
|
97.5th percentile |
|
Infants (4-18 months) |
1.2 |
4.2 |
|
Toddlers (18 months – 3 years) |
1.7 |
4.9 |
|
4 – 10 years |
1.2 |
3.3 |
|
11 – 18 years |
0.68 |
2.2 |
|
19 – 64 years |
0.75 |
2.3 |
|
65+ years |
0.57 |
1.7 |
Non-dietary
Dust and soil
113. No data were available on measured levels of PFOS in soil in the UK.
114. Levels of PFOS, PFOA, PFHxS and PFNA have been measured in indoor dust in UK (Birmingham) and European homes and was used to calculate exposures (Annex C).
115. Exposures from dust ingestion were calculated for median and high concentrations of PFOS, PFOA, PFHxS and PFNA and mean ingestion rates, for each UK population group (infants, toddlers, children, adolescents, adults and seniors).
116. For the average median PFASs concentrations in dust, the following ranges of exposures were calculated for all UK population groups for each of the compounds (Table 5):
- PFOS (59 ng/g): 0.014 – 1.9 ng/kg bw per week
- PFOA (66 ng/g): 0.015 – 2.1 ng/kg bw per week
- PFHxS (55 ng/g): 0.013 – 1.8 ng/kg bw per week
- PFNA (0.22 ng/g): 0.000051 – 0.0071 ng/kg bw per week
117. For the average maximum PFASs concentrations in dust, the following ranges of exposures were calculated for all UK population groups for each of the compounds (Table 5):
- PFOS (1300 ng/g): 0–30 – 42 ng/kg bw per week
- PFOA (660 ng/g): 0.15 – 21 ng/kg bw per week
- PFHxS (910 ng/g): 0.21 – 29 ng/kg bw per week
- PFNA (14 ng/g): 0.0032 – 0.45 ng/kg bw per week
118. For all PFASs considered, infants had the highest exposures and teenagers, adults and seniors had the lowest exposures.
Table 5. Estimated exposures for PFOS, PFOA, PFHxS and PFNA (ng/kg bw per week) for UK population groups.
|
Exposure (ng/g bw/week) |
Infants |
Toddlers |
Children |
Teenagers |
Adults |
Seniors |
|
PFOS (59 ng/g) |
1.9 |
1.1 |
0.43 |
0.014 |
0.014 |
0.014 |
|
PFOS (1300 ng/g) |
42 |
23 |
9.4 |
0.32 |
0.30 |
0.31 |
|
PFOA (66 ng/g) |
2.1 |
1.2 |
0.48 |
0.016 |
0.015 |
0.016 |
|
PFOA (660 ng/g) |
21 |
12 |
4.8 |
0.16 |
0.15 |
0.16 |
|
PFHxS (55 ng/g) |
1.8 |
0.99 |
0.40 |
0.013 |
0.013 |
0.013 |
|
PFHxS (910 ng/g) |
29 |
16 |
6.6 |
0.22 |
0.21 |
0.22 |
|
PFNA (0.22 ng/g) |
0.0071 |
0.0039 |
0.0016 |
0.000054 |
0.000051 |
0.000052 |
|
PFNA (14 ng/g) |
0.45 |
0.25 |
0.10 |
0.0034 |
0.0032 |
0.0033 |
Mean dust ingestion rates: infants 36 mg/day; toddlers 41 mg/day; children 32 mg/day; teenagers 2.2 mg/day; adults and seniors 2.6 mg/day. Values are to 2 significant figures.
Food contact materials
119. EFSA concluded that “PTFE cookware may contain residual PFOA in the low µg/kg range, and food packaging may contain PFASs where they are used because of their grease-resistant properties. Studies conducted to date continue to support the conclusions reported in the previous Opinion (EFSA CONTAM Panel, 2018) that the use of this type of material is likely to contribute to human exposure to PFASs, but that the contribution is small compared with other sources of exposure.” (EFSA, 2020).
120. Some testing was carried out on total fluorinated content of selected UK supermarket and takeaway food packaging, by the environmental charity Fidra (Dinsmore, 2020). The specific test method used to determine the total fluorinated content of the selected packaging samples does not reflect the potential migration of the substance into the food it is in contact with. “To fully understand the direct health implications of PFAS in food packaging, more information is needed on the chemical migration levels, i.e., how much of the PFAS from food packaging is transferred to the food itself. This has not been addressed in this study and requires further resource to quantify” (Dinsmore, 2020).
121. The Food Standards Agency (FSA) has recently been made aware that the vast majority of paper packaging manufactured in the UK by Confederation of Paper Industry member companies does not use PFASs. PFASs are now predominantly used only in specialist packaging which has particular technical requirements such as moisture or grease resistance, like microwavable popcorn bags.
Air (indoor)
122. Concentrations of PFASs in indoor air generally exceed those of outdoor air and therefore exposure via inhalation is mainly due to indoor air (Harrad et al., 2010). Concentrations of PFASs in indoor air have been found to vary greatly between homes. (EFSA, 2020; Ericson Jogsten et al., 2012; Fromme et al., 2015, Haug et al., 2011). There are only 2 studies which have measured samples of PFOS, PFOA, PFHxS and/or PFNA in homes in the UK or Europe since 2008 (Winkens et al., 2017; Goosey and Harrad, 2012). Measurements of PFNA were only available from Winkens et al., 2017. Exposures were calculated even though the data from the two studies were dissimilar.
123. A number of studies published since 2008 have measured the PFAS precursors and some of these have then calculated predicted exposures to PFOS and PFOA using factors to take into account the biotransformation. However, there is a lack of biotransformation data for PFAS precursors to PFOS, PFOA and PFNA in humans, although certain biotransformation factors have been assumed previously (Poothong et al., 2020; Padilla-sanchez et al., 2017; Fromme et al., 2015; Schlummer et al., 2013).
124. For the average median PFASs concentrations in indoor air in homes, the following ranges of exposures were calculated for all UK population groups for each of the compounds (Table 6):
- PFOS (6.4 pg/m3): 0.0085 – 0.027 ng/kg bw per week
- PFOA (20 pg/m3): 0.027 – 0.083 ng/kg bw per week
- PFHxS (12 pg/m3): 0.016 – 0.050 ng/kg bw per week
- PFNA (2.4 pg/m3): 0.0032 – 0.010 ng/kg bw per week
125. For the average maximum PFASs concentrations in indoor air in homes, the following ranges of exposures were calculated for all UK population groups for each of the compounds (Table 6):
- PFOS (200 pg/m3): 0.27 – 0.83 ng/kg bw per week
- PFOA (270 pg/m3): 0.36 – 1.1 ng/kg bw per week
- PFHxS (220 pg/m3): 0.29 – 0.91 ng/kg bw per week
- PFNA (17 pg/m3): 0.023 – 0.070 ng/kg bw per week
126. For all PFASs considered, toddlers had the highest exposures via inhalation and seniors had the lowest exposures.
Table 6. Estimated exposures for PFOS, PFOA, PFHxS and PFNA (ng/kg bw per week) from indoor air for UK population groups, based on average and maximum indoor air concentrations for each of the PFASs, respectively.
|
Exposure (ng/kg bw/week) |
Infants
|
Toddlers
|
Children
|
Teenagers
|
Adults
|
Seniors
|
|
PFOS 6.4 pg/m3 |
0.020 |
0.027 |
0.017 |
0.012 |
0.0093 |
0.0085 |
|
PFOS 200 pg/m3 |
0.61 |
0.83 |
0.53 |
0.38 |
0.29 |
0.27 |
|
PFOA 20 pg/m3 |
0.061 |
0.083 |
0.053 |
0.038 |
0.029 |
0.027 |
|
PFOA 270 pg/m3 |
0.83 |
1.1 |
0.71 |
0.51 |
0.39 |
0.36 |
|
PFHxS 12 pg/m3 |
0.037 |
0.050 |
0.032 |
0.023 |
0.017 |
0.016 |
|
PFHxS 220 pg/m3 |
0.68 |
0.91 |
0.58 |
0.42 |
0.32 |
0.29 |
|
PFNA 2.4 pg/m3 |
0.0074 |
0.010 |
0.0063 |
0.0046 |
0.0035 |
0.0032 |
|
PFNA 17 pg/m3 |
0.052 |
0.070 |
0.045 |
0.032 |
0.025 |
0.023 |
Mean inhalation rates: infants 3.4 m3/day; toddlers 9.3 m3/day; children 12 m3/day; teenagers 17 m3/day; adults 16 m3/day and seniors 15 m3/day.
Critical effects, dose-response assessment and derivation of a health-based guidance value- Statement on the EFSA Opinion on the risks of perfluoroalkyl substances
In this guide
In this guideCritical effects
127. The CONTAM Panel decided to base its assessment on epidemiological studies. The EFSA assessment is summarised in the following paragraphs.
128. Various associations between serum levels and a number of outcomes have been reported in human studies. In 2018 the CONTAM Panel considered four effects as potentially critical for PFOS and/or PFOA. These were:
i. Increased serum total and LDL cholesterol (risk factor for cardiovascular disease,
ii. Increased ALT levels (indicating effects on liver cells),
iii. Reduced birth weight and
iv. Effects on the immune system as shown by decreased antibody response to vaccines.
129. In their 2018 Opinion, the CONTAM Panel used the effects on serum cholesterol levels to derive TWIs for PFOS and PFOA. These were also protective for the other potential critical endpoints. Although the association with increased cholesterol was observed in a large number of studies, the CONTAM Panel now considers the uncertainty regarding causality larger. This is primarily due to a postulated process around the enterohepatic cycling of both PFASs and bile acids, the latter affecting serum cholesterol levels.
130. The association with reduced birth weight could in part be explained by physiological changes during pregnancy. There is currently little evidence for an effect on the proportion of children with low birth weight.
131. There is a consistent association with an increase in ALT levels in general population studies, which appear to be supported by observations in animal studies but were not observed in occupational studies. In the critical study (Gallo et al., 2012) the increase in subjects with high ALT levelled off at relatively low serum concentrations (about 30 ng/mL of PFOS and PFOA) and above that it did not increase further. In contrast, rodent studies only show an increase in ALT at the high-end of the dose-response curve. This inconsistency creates some uncertainty and for these reasons, this endpoint was not considered as the critical effect (EFSA, 2020).
132. Reduction in thyroid hormone levels is often observed in animal studies. Epidemiological studies provide insufficient support of the associations between exposure to PFASs and changes in thyroid hormone levels or thyroid function.
133. The effects on the immune system were observed at the lowest PFASs serum levels in both humans and animals. The CONTAM Panel considered these findings robust since they were consistently observed for several PFASs and for several species. In the present Opinion, the CONTAM Panel decided to base their PFASs assessment on effects on the immune system.
134. A decrease in vaccination response is considered adverse as summarised by WHO/IPCS (2012) in the Guidance for immunotoxicity risk assessment for chemicals. This may apply to vulnerable population groups such as infants and the elderly, considering their higher infection risk.
135. For compounds that accumulate in the body the CONTAM Panel prefer to identify serum or tissue levels associated with adverse effects. The Panel decided to combine its assessment on the serum levels for the sum of four PFASs (PFOS, PFOA, PFNA and PFHxS). These are currently the PFASs which contribute most to the levels observed in human serum. Although some other PFASs like PFBA and PFHxA also contribute significantly to the exposure, these compounds have much shorter half-lives in humans. The available data are insufficient to derive potency factors for the PFASs.
136. A study on children in the Faroe Islands (Grandjean et al., 2012) showed several inverse associations between serum levels of PFOA, PFNA, PFHxS and PFOS, as well as the sum of PFOA, PFHxS and PFOS at five years of age, before booster vaccination, and antibody titres against diphtheria and tetanus, at both the age of 5, shortly after booster vaccination and at 7.5 years. Additional data on the sum of PFOA, PFNA, PFHxS and PFOS were obtained for this study (EFSA Opinion, appendix L). BMDL modelling was carried out for this study but did not provide a BMDL considered suitable for risk assessment. The CONTAM Panel identified a no observed adverse effect concentration (NOAEC) serum level at the age of 5 years for the sum of PFOA, PFNA, PFHxS and PFOS of 27.0 ng/mL, based on decreased antibody titres for diphtheria at the age of 7 years.
137. A more recent study from Germany supported this (Abraham et al., 2020). An inverse association was observed between serum levels of PFOA, but also the sum of PFOA, PFNA, PFHxS and PFOS (EFSA Opinion, appendix K), and antibody titres against haemophilus influenzae type b (Hib), diphtheria and tetanus in serum sampled from 1-year-old children predominantly breastfed for a median duration of 7.4 months.
138. A NOAEC of 31.9 ng/mL at the age of 1 year was derived for the sum of PFOA, PFNA, PFOS and PFHxS based on an association with a reduction in antibody titres against Hib. For PFOS, PFHxS and PFNA alone, no significant associations were observed in this study. The association with reduced tetanus antibody titres was also significant, whereas the association between the sum of the 4 PFASs and diphtheria was only borderline significant.
139. A lowest BMDL10 of 17.5 ng/mL at the age of 1 year was derived for the sum of PFOA, PFNA, PFHxS and PFOS, based on the inverse association between serum levels of the sum of these four PFASs and antibody titres against diphtheria.
Mixture Approach
140. In 2018, the CONTAM Panel derived separate TWIs for PFOS and PFOA. Since that Opinion, EFSA published a guidance document on how to evaluate the effects of mixtures (EFSA Scientific Committee, 2019) and it was considered that similarities in chemical properties and effects warranted a mixture approach for PFASs. Therefore, in this Opinion the CONTAM Panel decided to focus on the four PFASs (PFOA, PFNA, PFOS and PFHxS). In humans these four chemicals show the highest concentrations in blood plasma and serum. In general, they also show the same effects when studied in animals.
141. The studies by Abraham et al., (2020) and Grandjean et al., (2012) showed significant associations for the sum of the four PFASs and antibody titres. A later study by Grandjean et al. (2017) showed PFOA had stronger associations than PFOS. Since PFOA and PFOS concentrations are higher compared to serum concentrations of PFNA and PFHxS, and PFOA highly correlates with the serum levels of the other PFASs, it is uncertain whether PFOA has a higher potency for this critical endpoint than the other PFASs and therefore drives the association. The CONTAM Panel assumed equal potency by default for these four PFASs on immune outcomes. This was done on a weight basis rather than a molar basis, to allow easier comparison with the exposure assessment.
Dose-response assessment
142. The modelling approach used in the 2018 EFSA Opinion was criticised during the expert meeting (EFSA/CONTAM/3503). The lowest decile of antibody titre was used as the reference value rather than extrapolate and evaluate the BMR for a serum PFOS concentration of zero. In the present Opinion the data from both the Faroe Islands and Germany were modelled with PROAST and BMDS.
143. For the Faroe Island study, BMD modelling was undertaken by EFSA but resulted in wide BMDL– BMDU intervals. This was as a consequence of extrapolating to zero exposures and well below the lowest observed serum levels. Therefore, a NOAEC of 27.0 ng/mL was derived for the sum of the four PFASs in serum of 5-year-old children (serum level in 4th quintile, Appendix L of the EFSA Opinion), based on the decreased antibody titres for diphtheria at the age of 7 years.
144. For the Abraham study, BMD modelling was undertaken, and an association between serum levels of the sum of the four PFASs and titres of diphtheria and tetanus antibodies was shown. From 4 individual models (Appendix K. EFSA 2020) BMDL- BMDU intervals of 17.5 – 46.6 and 18.8 – 56.3 ng/mL were calculated for antibodies against diphtheria and tetanus, respectively. The models provided similar results. A critical effect size of 10 % was used due to the large variation in the response. The lowest BMDL of 17.5, from the individual models was used as the reference point. EFSA Opinion Appendix K).
145. This BMDL10 of 17.5 ng/mL corresponds to a lower intake by the child and thus the mother in her life up to pregnancy, than the NOAEC of 27.0 ng/mL from the Faroe Islands study. The CONTAM Panel also considered that PFAS serum levels in breastfed children are in general higher at 1 year of age than at 5 years. Therefore, this BMDL10 was used to estimate the daily intake by mothers that would result in this critical serum concentration at 1 year of age in breastfed children. This daily intake was subsequently used to derive an HBGV for the sum of PFOA, PFNA, PFHxS and PFOS.
146. A physiologically-based pharmacokinetic (PBPK) model was used in the previous Opinion (EFSA, 2018) to translate the critical serum levels into a daily intake and was carried out for PFOS only. In the current Opinion PFOA is also modelled (EFSA Opinion Appendix M provides details of the PBPK modelling). The model was originally developed for adults but had been adapted to estimate the serum levels in growing children and to include exposure via breastfeeding. Data from human biomonitoring studies had been used to estimate the levels in human milk corresponding to a certain serum level in the mother. The prenatal exposure and body burden of the new-born were also estimated.
147. Using a PBPK model, and assuming 12 months of breastfeeding, it was estimated that the BMDL10 in infants corresponds to an intake by the mother of 0.63 ng/kg bw per day for the sum of the four PFASs. Such intake would result in a serum level in the mother at 35 years of age of 6.9 ng/mL.
148. It has been shown that during breastfeeding, a substantial part of the PFASs in the mother is transferred to the infant, and as a result, serum levels in the mother but also the mother’s milk level decrease over the lactation period . This decline was also included in the model. The data for PFNA and PFHxS were insufficient, but due to structural and toxicokinetic similarities, it was assumed that these compounds behave like PFOA and PFOS, respectively.
149. The serum level of 17.5 ng/mL was the sum of the levels of PFOA, PFNA, PFHxS and PFOS with relative contributions (based on the mean levels of these PFASs in 1-year old breastfed infants) of 48.4, 1.7, 6.1 and 43.8 %, respectively. This equates to contributions of 8.47, 0.30, 1.06 and 7.67 ng/mL for PFOA, PFNA, PFHxS and PFOS, respectively. The PBPK model was used to calculate the critical milk and corresponding serum levels in the mother at 35 years that would result in these levels of PFAS in the one-year old infant. Subsequently an estimate was made of the daily intakes by the mothers that lead to this critical serum level at 35 years. Assuming 12 months of breastfeeding, it was estimated that the BMDL10 in infants corresponds to an intake by the mother of 0.63 ng/kg bw per day for the sum of the four PFASs (12 months was used as the duration of breastfeeding in the model because of current breastfeeding practices in Europe and based on the WHO recommendations to breastfeed exclusively for 6 months with continued breastfeeding along with appropriate complementary foods up to two years of age or beyond (EFSA, 2020)).
150. The CONTAM Panel decided to use the daily intake of 0.63 ng/kg bw per day as the starting point for the derivation of an HBGV for the sum of the four PFASs.
151. The CONTAM Panel considered animal studies, but when compared to the results of human studies, suggested that the application of the various uncertainty factors is too conservative and supports the use of the human data to derive an HBGV.
152. The CONTAM Panel also considered the mammary gland effects, observed in animal studies, to be potentially adverse for humans. However, basing the assessment on the effects on mammary glands using animal data and uncertainty factors, would result in a much lower HBGV. Based on the uncertainties on whether these effects on mammary gland development occur in humans and extrapolation between species, the CONTAM Panel decided to use the vaccination response in humans as the critical endpoint. Nevertheless, this potential developmental effect is of potential concern.
Derivation of a Health Based Guidance Value
153. The CONTAM Panel decided to derive an HBGV based on immune effects in humans. Two studies showed a dose-response, although only one these was considered suitable for determination of a BMDL for risk assessment. After BMD modelling of this study, the lowest BMDL10 of 17.5 ng/mL was selected as the reference point. This was lower than the NOAEC in the other study, and was therefore considered sufficiently protective. PBPK modelling was then used to calculate the daily intake of the mother.
154. The daily intake of 0.63 ng/kg bw per day was decided upon as the starting point.
155. The CONTAM Panel established a group tolerable weekly intake (TWI) of 7 x 0.63 = 4.4 ng/kg bw per week for the sum of PFOA, PFNA, PFHxS and PFOS, to take into account the long half-lives of these PFASs.
156. It was decided that no additional uncertainty factors need to be applied, because the BMDL10 is based on infants, who are expected to be a sensitive population group, as is true for many immunotoxic chemicals. In addition, a decreased vaccination response is considered a risk factor for disease rather than an adverse outcome per se.
157. This TWI is protective for the other potential critical endpoints (increase in serum cholesterol, reduced birth weight and high serum levels of ALT).
Risk Characterisation - Statement on the EFSA Opinion on the risks to human health related to the presence of perfluoroalkyl substances in food
In this guide
In this guide158. The EFSA Opinion (EFSA, 2020) states that “This TWI should prevent that mothers reach a body burden that results in levels in milk that would lead to serum levels in the infant associated with a decrease in vaccination response. As a result, the higher exposure of breastfed infants is taken into account in the derivation of the TWI and the intake by infants should therefore not be compared with this TWI”.
159. For the rest of the diet, UK Lower bound mean exposures for adolescents, adults, the elderly and the very elderly (3.2 - 5.6 ng/kg bw per week) are approximate to the TWI of 4.4 ng/kg bw per week. These exposures for other children are just double the value of the TWI, with a value of 9.7 ng/kg bw per week. Toddler exposures calculated using the NDNS survey data are approximately 4 fold the TWI. Infant and toddler exposures estimated using the DNSIYC survey data are approximately 14 and 7 fold the TWI.
160. The UK lower bound 95th percentile exposures for adolescents, adults, the elderly and the very elderly exceed the TWI up to about 3-fold. For other children the exceedance is approximately 6 fold. Toddler exposures calculated using the NDNS survey data are about 10 fold. Infant and toddler exposures calculated using DNSIYC survey data are approximately 25 and 17 fold the TWI.
161. UK upper bound mean exposures range from 97 to 590 ng/kg bw per week across the population groups, with infants having the highest exposures. These are 22 to 130 fold the TWI.
162. UK upper bound 95th percentile exposures range from 200 to 870 ng/kg bw per week across the population groups, with infants having the highest exposures. These are 45 to 200 fold the TWI.
163. Serum level modelling of the four PFASs indicates that the lower bound exposure is a more accurate prediction of the exposure than the upper bound estimates, which would lead to a much higher exceedance of the critical serum levels.
164. With a PFAS concentration of 5 ng/L in drinking water derived from surface waters all calculated mean and 97.5th percentile exposures for all age groups were below the TWI of 4.4 ng/kg bw per week.
165. For drinking water derived from ground water with a conservative concentration of 10 ng/L, mean exposures for all age groups were below the TWI. Exposures for 97.5th percentile consumers were below the TWI for all age groups except toddlers with a marginal exceedance of the TWI, with an exposure of 4.9 ng/kg bw per week.
166. Exposures from household dust at average median PFASs concentrations for all UK populations range from 0.000051 to 2.1 ng/k bw per week across the four individual PFAS. For each of PFOS, PFOA, PFHxS and PFNA exposures from house dust are below the TWI.
167. For conservative exposures calculated from average maximum PFASs concentrations in household dust, the values across all UK population groups across the four individual PFAS range from 0.0032 to 42 ng/kg bw per week. However, there is more uncertainty around the calculation of these values as discussed in Annex C and the uncertainties section. The TWI is exceeded for PFOS, PFOA and PFHxS by infants, toddlers and children. For all PFASs considered, infants had the highest exposures and teenagers, adults and seniors had the lowest exposures.
168. For the individual PFASs, all exposures from indoor air calculated across all population groups for both average median and maximum concentrations, are below the TWI. For all PFASs considered, toddlers had the highest exposures via inhalation and seniors had the lowest exposures.
Uncertainty
Uncertainties in the exposure assessments
169. Exposures for breast milk, dust, drinking water and indoor air were calculated for individual PFASs. Exposures for the rest of the diet were taken from the EFSA Opinion (2020) and were for a sum of the four PFAS. The majority of the studies used to calculate the exposures for breast milk, dust and indoor air did not provide individual sample data which could therefore not be assessed prior to the data analysis.
170. UK bodyweights, inhalation rates and dust ingestion rates were selected to represent the greatest number of individuals (greatest age range) within that population group.
171. The exposure calculations are likely to be conservative because generally all values reported were included in the analysis, including some reasonably high concentrations which were included in the average maximum calculations.
172. All of the studies used to calculate exposures had sample numbers lower than 65. Most had 20 or fewer samples. This decreases the statistical reliability of the estimates.
173. Studies were carried out in different years and in different countries which increased the likely variability within the samples between studies. Studies had different LODs/LOQs for the same PFASs for the same material of interest (breast milk, dust or indoor air). For some studies the data were available for the individual samples but in others only the outputs of the data analysis were available.
174. Where branched and linear isomers of a specific PFASs were measured, where possible, the data were summed as suggested by Nyburg et al., (2018).
175. In studies that included samples which were pooled prior to analysis, or only provided a summary of the information it is not known how the data from the individual samples compared and whether data are skewed by individual results.
176. Uncertainties relating to specific exposure assessments are discussed in the following paragraphs.
Breast milk
177. Data from the Nyberg (2018) study was available for individual samples. From these it was possible to calculate the average and median for individual PFASs and identify the minimum and maximum values. The data for PFOS and PFHxS were for both linear and branched isomers and these were summed for each PFAS to provide one value for each sample. For PFOS (for branched and linear), data were also reported for m/z 499/80 and 499/99 ions. These were averaged as suggested by Nyberg prior to use of the data for summing branched and linear values.
Rest of the diet
178. The exposure calculations for the rest of the diet were from EFSA (2020) and as such, the uncertainties are as discussed in the EFSA Opinion.
Drinking water
179. The uncertainties in the exposure assessment for drinking water include:
- The exposures calculated assumed that concentrations of 5 ng/L and 10 ng/L would be reasonably conservative scenarios for surface and ground water, respectively.
- Chemical concentrations were given in the units ng/L. Data in the NDNS is expressed in weight i.e., g or kg. Therefore, in the assessments these concentrations were assumed to be ng/kg. i.e., 1 L of water was assumed to equal to 1 kg of water.
- There were only limited numbers of infant/toddler consumers of water used as a diluent for infant foods.
Air (indoor)
180. Only two studies were available for inclusion in the exposure calculations. The sample numbers for the studies are relatively small: 20 for the PFASs concentrations measured from Birmingham; and 57 from Kuopio, Finland. The detection frequencies are also low for PFHxS for samples from Kuopio. Therefore, there are only a limited number of measured data from which to calculate exposures.
Uncertainties in the critical effects, dose-response assessment and derivation of an HBG
In this guide
In this guide181. The EFSA CONTAM Panel have considered uncertainties in their Opinions (EFSA 2018; EFSA, 2020). “Overall, the CONTAM Panel considered the impact of the uncertainties on the risk assessment for the sum of PFOA, PFOS, PFHxS and PFNA is high” (EFSA, 2020).
182. The COT had reviewed the two studies (Abraham et al., 2020 and Grandjean et al., 2012) used by EFSA for the derivation of a TWI for PFASs. The endpoints used were the indications of a decrease in vaccine response in children. The results from the studies were not entirely consistent for the PFASs compounds studied. It was also noted that the cohort in the Abraham et al. study was relatively small.
183. The immune effects of PFASs have been seen in both experimental animal and human studies. The Grandjean and Abraham studies are the only studies suitable for undertaking BMD modelling and only one of these (Abraham et al 2020) provided a BMDL suitable for risk assessment. Both studies are still less than ideal, and it would be helpful to have a more robust point of departure (POD). The modelling used seems to take account of the critical toxicokinetic effects. The pathological consequences of the reduction in vaccine response in these children are unknown. It is unknown how this effect relates to the TWI.
184. The EFSA opinion indicated that when antibody titres are diminished, the level of protection from vaccines might be compromised. However, it was not clear what decrease in antibody levels could cause such an effect. It was noted that there were also natural fluctuations in vaccine titres over time.
185. The Committee was of the view that information on the impact of vaccinating against diphtheria in the UK should be available. As most children in the UK are vaccinated, the fact that there were almost no cases of diphtheria (10 cases in England in 2019 (Vaccine Knowledge Project)) would suggest that any effect of PFASs on vaccine response was non-linear. However, as there is no cohort of infected subjects (due in part to the effectiveness of vaccination) any effect on impairment of the vaccine response would not necessarily be seen, as only a small percentage of the population would be at risk. Currently there does not appear to be any discernible impact.
186. The COT agreed that, on the basis of the information reviewed by EFSA, qualitatively the appropriate health endpoint had been selected but quantitatively, questioned the calculations. Overall, there were some reservations about the choice of the critical study and the specific effect selected. However, the COT agreed that the critical study was the best available. It was not unreasonable that this study was selected, and, in the absence of more appropriate studies, its use was understandable.
187. The COT considered whether there was a real effect or not.
188. The Grandjean et al cohort had initially been studied to assess the effects of polychlorinated biphenyls (PCBs) and the results for PFASs had been compared after correcting for confounding by PCBs. However, the Committee questioned how effective this correction would be when the major source of exposure for both groups of chemicals was the same, i.e., seafood. It was noted that the assessment was multi-faceted and that the two groups of chemicals were not necessarily confounders because they were on the same causal pathway. However, it would not be possible to put both PCBs and PFASs in the model at the same time and it would also not be possible to fully adjust the model for one group of chemicals for the other.
189. The COT discussed the benchmark dose (BMD) modelling that had been carried out by EFSA. This had originally been carried out by Abraham et al. and then replicated by EFSA. A relatively small set of data was used in the modelling. A number of the fitted models showed no threshold, indicating that there was no ‘no effect level’. However, there did not appear to be anything in the EFSA Opinion to explain this. There had also been difficulties with the BMD modelling, for example, model averaging did not provide plausible results and was not further discussed by the EFSA panel although model averaging is their preferred approach in BMD modelling. Instead, the lowest value from an individual model was used. It was presumed that this was for a non-threshold dose response. It was noted that the data set could be very difficult to model.
Summary of uncertainties and recommendations
190. The CONTAM Panel identified several uncertainties and had a number of recommendations to decrease these uncertainties. To improve the exposure assessment, data obtained by more sensitive analytical methods with high levels of quality control (to avoid matrix effects or impact of background contamination) are needed in order to increase the proportion of quantified results and thus reduce uncertainty in the dietary exposure assessment. This is needed for all PFASs and a broad range of widely consumed food products.
191. For the determination of the total amount of PFASs, sensitive and accurate methods, which facilitate determination of the total amount of PFASs in samples of food and drinks are needed. Exposure assessment should be frequently updated, especially when analytical data obtained from more sensitive methods become available. Additional studies on the relative contribution of sources other than food are needed, especially for PFASs which are present in the highest concentrations in indoor air and house dust, such as n:2 FTOHs and PAPs.
192. More studies on the effect of cooking and food processing, in particular in relation to transfer to food from food contact materials that contain PFASs, are needed, given that most food is consumed after cooking/processing, and the fact that data reported in the scientific literature are inconsistent regarding the impact this has on exposure. Therefore, more data is needed on the transfer of PFASs along the food chain.
193. Furthermore, additional studies on paired human samples are needed to identify the relevant matrices for biomonitoring of various PFASs (this is not further explained, but presumably relates to pairs of serum/plasma and tissue samples).
COT Conclusions - Statement on the EFSA Opinion on the risks to human health related to the presence of perfluoroalkyl substances in food
In this guide
In this guide194. The TWI was calculated based on studies of epidemiological studies of immune effects as this was considered, by the CONTAM Panel, to be the critical effect. Two studies on this (Abraham et al., 2020 and Grandjean et al., 2012) were considered by EFSA. The predominant study used was that by Abraham et al. (2020). From this study a BMDL10 of 17.5 ng/mL was calculated, for the sum of the four PFASs in serum. This value was then used as the reference point for PBPK modelling. From the PBPK model the daily intake calculated for a mother was 0.63 ng/kg bw per day. This was then converted to a weekly value of 4.4 ng/kg bw per week, for use as the health-based guidance value.
195. The COT agreed that, on the basis of the information reviewed by EFSA, qualitatively the appropriate health endpoint had been selected but quantitatively, questioned the calculations. Overall, there were some reservations about the choice of the critical study (Abraham et al., 2020) and the specific effect selected. However, the COT agreed that the critical study was the best available. It was not unreasonable that this study was selected, and, in the absence of more appropriate studies, its use was understandable.
196. The COT had significant reservations about the model used, including the BMD approach, and the TWI which had been established, due to the uncertainties and the caveats involved. The concerns related to both the study and thus the data used in the modelling, and the modelling itself.
197. The COT agreed that the use of the sum of the four PFASs was acceptable as a first approximation for exposures of PFAS but had reservations about the calculations due to the uncertainties.
198. The values for the BMDL and TWI were low and there was a lot of uncertainty surrounding the data used by EFSA.
199. Estimated breast milk exposures for UK infants all exceed the TWI of 4.4 ng/kg bw per week. However, EFSA (2020) stated that “the higher exposure of breastfed infants is taken into account in the derivation of the TWI and the intake by infants should therefore not be compared with this TWI”. Important to note is that estimates of breast milk exposures were very conservative and that the Spanish data set could have skewed the results.
200. For the rest of the diet, EFSA had calculated UK exposures. UK Lower bound mean estimated exposures for adolescents, adults, the elderly and the very elderly approximate the TWI of 4.4 ng/kg bw per week. The exposures for other children are approximately 2 fold the TWI. Toddler exposures estimated using the NDNS survey data are approximately 4-fold the TWI. Infant and toddler exposures estimated using the DNSIYC survey data are approximately 14 and 7 fold the TWI.
201. The UK lower bound 95th percentile estimated exposures for adolescents, adults, the elderly and the very elderly exceed the TWI, up to about 3 fold. For other children the exceedance is approximately 6 fold. Toddler exposures estimated using the NDNS survey data are about 10-fold. Infant and toddler exposures calculated using DNSIYC survey data are approximately 25 and 17 fold the TWI, respectively.
202. UK upper bound mean estimated exposures across the population groups, with infants having the highest estimates are approximately 22 to 130 fold the TWI.
203. UK upper bound 95th percentile estimated exposures across the population groups, with infants having the highest estimates, are approximately 45 to 200 fold the TWI.
204. Serum level modelling of the four PFASs indicates that the lower bound estimate is a more accurate prediction of the exposure than the upper bound estimates which would lead to a much higher exceedance of the critical serum levels.
205. Estimated exposures from household dust at average median PFASs concentrations for all UK populations for individual PFASs are below the TWI.
206. For exposures estimated from average maximum PFASs concentrations in household dust the TWI is exceeded for PFOS, PFOA and PFHxS by infants, toddlers and children.
207. With a PFAS concentration of 5 ng/L in drinking water derived from surface waters all estimated mean and 97.5th percentile exposures for all age groups were below the TWI of 4.4 ng/kg bw per week.
208. For drinking water derived from ground water with a conservative concentration of 10 ng/L, mean estimated exposures for all age groups were below the TWI. Estimates for 97.5th percentile consumers were below the TWI for all age groups except toddlers with a marginal exceedance of the TWI, with an exposure of 4.9 ng/kg bw per week.
209. For the individual PFASs, all estimated exposures from indoor air calculated across all population groups for both average median and maximum concentrations, are below the TWI.
210. Due to high numbers of results below the LOD/LOQ for food samples, these estimated chronic exposures should be viewed as indicative of the range of exposures and therefore, interpreted with caution. The same caution should be used when considering the estimated household dust and indoor air exposures and also taking into account the additional uncertainties around these, discussed previously.
211. The diet is the predominant route of exposure to PFASs, however, other routes of exposure may include dust ingestion and indoor air, for which exposures have been considered. There may also be some exposure from the dermal route, however these have not been calculated in this statement.
212. The EFSA CONTAM Panel, in their evaluation of PFASs have used a mixtures approach and established a TWI of 4.4 ng/kg bw per week, based on the sum of four PFASs: PFOS, PFOA, PFHxS and PFNA. The CONTAM Panel considered that the impact of the uncertainties on the risk assessment for the sum of PFOA, PFNA, PFHxS and PFOS is high.
213. The exceedances of the TWI at lower bound exposure estimates indicate a potential health concern.
214. Whilst the COT is unable to suggest an alternative TWI at this time, there are strong caveats when comparing the exposure estimates with the TWI established by EFSA. There is considerable uncertainty as to the appropriateness of the derivation of the TWI, and of the biological significance of the response on which it is based, which complicates interpretation of the possible toxicological significance of exceedances.
215. The COT suggested that in future reviews it could use the averages for exposures for the four PFASs added together to provide a reasonable estimation of combined PFASs exposure for comparison to the TWI.
COT
October 2022
Statement Number 04/22
References - Statement on the EFSA Opinion on the risks to human health related to the presence of perfluoroalkyl substances in food
In this guide
In this guideAbraham K, Mielke H, Fromme H, Volkel W, Menzel J, Peiser M, Zepp F, Willich SN and Weikert C. (2020). Internal exposure to perfluoroalkyl substances (PFASs) and biological marker in 101 healthy one-year old children: Associations between levels of perfluorooctanoic acid (PFOA) and vaccine response. Archives of Toxicology, 94(6): 2131-2147.
Available at: Internal exposure to perfluoroalkyl substances (PFASs) and biological markers in 101 healthy 1-year-old children: associations between levels of perfluorooctanoic acid (PFOA) and vaccine response - PubMed (nih.gov)
ANSES (French Agency for Food, Environmental and Occupational Health & Safety) (2015). OPINION of the French Agency for Food, Environmental
and Occupational Health & Safety on “the development of chronic reference values by the oral route for four perfluorinated compounds: perfluorohexanoic acid (PFHxA), perfluorohexane sulfonic acid (PFHxS), perfluorobutanoic acid (PFBA), and perfluorobutane sulfonic acid (PFBS).
Available at: ANSES OPINION on the "development of chronic reference values by the oral route for four perfluorinated compounds: perfluorobutanoic acid (PFBA)
Article 76(1)(e) of Regulation (EC) No 1907/2006.
Available at: EUR-Lex - 02006R1907-20140410 - EN - EUR-Lex (europa.eu)
ATSDR (Agency for Toxic Substances and Disease Registry) (2018). Draft Toxicological Profile for Perfluoroalkyls.
Available at: Toxicological Profile for Perfluoroalkyls (cdc.gov)
Bates, B, Lennox, A, Prentice, A, Bates, C, Page, P, Nicholson, S, Swan, G. (2014) National Diet and Nutrition Survey Results from Years 1, 2, 3 and 4 (combined) of the Rolling Programme (2008/2009 – 2011/2012) Main heading (publishing.service.gov.uk)
Bates B, Cox L, Nicholson S, Page P, Prentice A, Steer T, Swan G (2016). National Diet and Nutrition Survey Results from Years 5 and 6 (combined) of the Rolling Programme (2012/2013 – 2013/2014): NDNS: results from Years 5 and 6 (combined) - GOV.UK (www.gov.uk)
Budtz-Jorgensen E and Grandjean P (2018). Application of benchmark analysis for mixed contaminant exposures: Mutual adjustment of perfluoroalkylated substances associated with immunotoxicity. PloS ONE 13(10): e0205388. Doi: 10.1371/journal.pone.0205388. eCollection 2018. Available at: Application of benchmark analysis for mixed contaminant exposures: Mutual adjustment of perfluoroalkylate substances associated with immunotoxicity - PubMed (nih.gov)
Commission Regulation (EU) No 10/2011 of 14 January 2011 on plastic materials and articles intended to come into contact with food.
Available at: EUR-Lex - 32011R0010 - EN - EUR-Lex (europa.eu)
COT (2014). COT statement on the potential risks from perfluorooctane sulfonate (PFOS) in the infant diet.
Available at: cotstatmpfos.pdf (food.gov.uk)
COT (2018). First draft statement on the EFSA Opinion on “Risk to human health related to the presence of perfluorooctane sulfonic acid and perfluorooctanoic acid in food” – RESERVED Business.
Available at: [ARCHIVED CONTENT] UK Government Web Archive - The National Archives
COT (2020). Minutes for an additional COT meeting on the EFSA draft opinion on PFAS currently out for public consultation.
Available at: Minutes for an additional COT meeting on the EFSA draft opinion on PFAS (food.gov.uk)
Danish Environmental Protection Agency (2015). Short-chain Polyfluoroalkyl
Substances (PFAS). A literature review of information on human health effects and environmental fate and effect aspects of short-chain PFAS.
Available at: 978-87-93352-15-5.pdf (mst.dk)
De Silva, A.O., Armitage, J.M., Bruton, T.A., Dassuncao, C., Heiger‐Bernays, W., Hu, X.C., Kärrman, A., Kelly, B., Ng, C., Robuck, A. and Sun, M., 2021. PFAS exposure pathways for humans and wildlife: a synthesis of current knowledge and key gaps in understanding. Environmental toxicology and chemistry, 40(3), pp.631-657.
Department of Environmental Protection (New Jersey, US). New Jersey Drinking Water Quality Institute Health Effects Subcommittee (2017) health-based maximum contaminant level support document: perfluorooctanoic acid (PFOA).
Available at: HEALTH-BASED MAXIMUM CONTAMINANT LEVEL SUPPORT DOCUMENT - PFOA - APPENDIX A (nj.gov)
Dinsmore KJ. (2020). Forever chemicals in the food aisle: PFAS content of UK supermarket and take away food packaging.
Available at: (PDF) Forever chemicals in the food aisle: PFAS content of UK supermarket and takeaway food packaging (researchgate.net)
DH (Department of Health) (2013). Diet and nutrition survey of infants and young children, 2011.
Available at: Diet and nutrition survey of infants and young children, 2011 - GOV.UK (www.gov.uk)
DWI (Drinking Water Inspectorate). (2021). Guidance on the Water Supply (Water Quality) Regulations 2016 specific to PFOS (perfluorooctane sulphonate) and PFOA (perfluorooctanoic acid) concentrations in drinking water.
Available at: PFOS-PFOA-guidance-2021.pdf (dwi.gov.uk)
EFSA (2008). Perfluorooctane sulfonate (PFOS), perfluorooctanoic acid (PFOA) and their salts Scientific Opinion of the Panel on Contaminants in the Food chain. The EFSA Journal. 653: 1-131. DOI:
10.2903/j.efsa.2008.653.
Available at: Perfluorooctane sulfonate (PFOS), perfluorooctanoic acid (PFOA) and their salts Scientific Opinion of the Panel on Contaminants in the Food chain [1] | EFSA (europa.eu)
EFSA (2018). Risk to human health related to the presence of perfluorooctane sulfonic acid and perfluorooctanoic acid in food. EFSA Journal. 16(12) :5194. DOI : 10.2903/j.efsa.2018.5194.
Available at : Risk to human health related to the presence of perfluorooctane sulfonic acid and perfluorooctanoic acid in food | EFSA (europa.eu)
EFSA (2019). Genotoxicity assessment of chemical mixtures. EFSA Journal. 17(1) :5519. Doi : 10.2903/j.efsa.2019.5519.
Available at: https://efsa.onlinelibrary.wiley.com/doi/10.2903/j.efsa.2019.5519
EFSA CONTAM Panel (EFSA Panel on Contaminants in the Food Chain), Schrenk D, Bignami M, Bodin L, Chipman JK, del Mazo J, Grasl-Kraupp B, Hogstrand C, Hoogenboom LR, Leblanc J-C, Nebbia CS, Nielsen E, Ntzani E, Petersen A, Sand S, Vleminckx C, Wallace H, Barregard L, Ceccatelli S, Cravedi J-P, Halldorsson TI, Haug LS, Johansson N, Knutsen HK, Rose M, Roudot A-C, Van Loveren H, Vollmer G, Mackay K, Riolo F and Schwerdtle T. (2020). Scientific Opinion on the risk to human health related to the presence of perfluoroalkyl substances in food. EFSA Journal 2020 ;18(9) :6223, 391 pp. Available at: https://doi.org/10.2903/j.efsa.2020.6223
EFSA/CONTAM/3503 (2018). Minutes of the expert meeting on perfluorooctane sulfonic acid and perfluorooctanoic acid in food assessment. Available at: [PDF] Minutes of the expert meeting on perfluooroctane sulfonic acid and perfluorooctanoic acid in food assessment | Semantic Scholar
Ericson Jogsten I, Nadal M, van Bavel B, Lindström G and Domingo JL, 2012. Per- and polyfluorinated compounds (PFCs) in house dust and indoor air in Catalonia, Spain: implications for human exposure. Environment
International, 39, 172–180.
Available at : Per- and polyfluorinated compounds (PFCs) in house dust and indoor air in Catalonia, Spain: Implications for human exposure - ScienceDirect
Food Safety Australia New Zealand (FSANZ) (2017). Hazard assessment report – Perfluorooctane Sulfonate (PFOS), Perfluorooctanoic Acid (PFOA), Perfluorohexane Sulfonate (PFHxS).
Available at: Department of Health and Aged Care | Sorry, we cannot find that page...
Fromme H, Dreyer A, Dietrich S, Fembacher L, Lahrz T and Volkel W, 2015. Neutral polyfluorinated compounds in indoor air in Germany-the LUPE 4 study. Chemosphere, 139, 572–578.
Available at: Neutral polyfluorinated compounds in indoor air in Germany – The LUPE 4 study - ScienceDirect
Frisbee, S.J., Brooks Jr, A.P., Maher, A., Flensborg, P., Arnold, S., Fletcher, T., Steenland, K., Shankar, A., Knox, S.S., Pollard, C. and Halverson, J.A., 2009. The C8 health project: design, methods, and participants. Environmental health perspectives, 117(12), pp.1873-1882.
Available at: https://ehp.niehs.nih.gov/doi/full/10.1289/ehp.0800379
Gallo V, Leonardi G, Genser B, Lopez-Espinosa MJ, Frisbee SJ, Karlsson L, Ducatman AM and Fletcher T. (2012). Serum perfluorooctanoate (PFOA) and perfluorooctane sulfonate (PFOS) concentrations and liver function
biomarkers in a population with elevated PFOA exposure. Environmental Health Perspectives. 120: 655–660.
[German Human Biomonitoring Commission (2017). Fortschreibung der vorläufigen Bewertung von per- und polyfluorierten Chemikalien (PFC)
im Trinkwasser Empfehlung des Umweltbundesamtes nach Anhörung der Trinkwasserkommission. Bundesgesundheitsblatt. 60:350-352.
Available at: fortschreibung_der_uba-pfc-bewertungen_bundesgesundheitsbl_2017-60_s_350-352.pdf (umweltbundesamt.de)
Glüge, J., Scheringer, M., Cousins, I.T., DeWitt, J.C., Goldenman, G., Herzke, D., Lohmann, R., Ng, C.A., Trier, X. and Wang, Z., 2020. An overview of the uses of per-and polyfluoroalkyl substances (PFAS). Environmental Science : Processes & Impacts, 22(12), pp.2345-2373.
Available at : An overview of the uses of per- and polyfluoroalkyl substances (PFAS) - Environmental Science: Processes & Impacts (RSC Publishing) DOI:10.1039/D0EM00291G
Grandjean P, Andersen EW, Budtz-Jorgensen E, Nielsen F, Molbak K, Weihe P and Heilmann C. (2012). Serum Vaccine antibody concentrations in children exposed to perfluorinated compounds. JAMA. 307 : 391-397. Doi : 10.1001/jama.2011.2034.
Available at: Serum vaccine antibody concentrations in children exposed to perfluorinated compounds - PubMed (nih.gov)
Grandjean P, Heilmann C, Weihe P, Nielsen F, Mogensen UB, Timmermann A and Budtz-Jorgensen E (2017). Estimated exposures to perfluorinated compounds in infancy predict attenuated vaccine antibody concentrations at age 5-years. J Immunotoxicol. 14(1) :188-195. Doi : 10.1080/1547691X.2017.1360968.
Available at: Estimated exposures to perfluorinated compounds in infancy predict attenuated vaccine antibody concentrations at age 5-years - PubMed (nih.gov)
Goosey E and Harrad S. (2012). Perfluoroalkyl substances in UK indoor and outdoor air: spatial and seasonal variation, and implications for human exposure. Environment International. 45 : 86-90.
Available at: Perfluoroalkyl substances in UK indoor and outdoor air: spatial and seasonal variation, and implications for human exposure - PubMed (nih.gov)
Gyllenhammar, I., Berger, U., Sundström, M., McCleaf, P., Eurén, K., Eriksson, S., Ahlgren, S., Lignell, S., Aune, M., Kotova, N. and Glynn, A., 2015. Influence of contaminated drinking water on perfluoroalkyl acid levels in human serum–A case study from Uppsala, Sweden. Environmental research, 140, pp.673-683.
Available at: Influence of contaminated drinking water on perfluoroalkyl acid levels in human serum – A case study from Uppsala, Sweden - ScienceDirect
Harrad S, de Wit CA, Abdallah MA, Bergh C, Bjorklund JA, Covaci A, Darnerud PO, de Boer J, Diamond M, Huber S, Leonards P, Mandalakis M, Ostman C, Haug LS, Thomsen C and Webster TF, 2010. Indoor contamination with hexabromocyclododecanes, polybrominated diphenyl ethers, and perfluoroalkyl compounds: an important exposure pathway for people? Environmental Science & Technology, 44, 3221–3231.
Available at: Indoor contamination with hexabromocyclododecanes, polybrominated diphenyl ethers, and perfluoroalkyl compounds: an important exposure pathway for people? - PubMed (nih.gov)
Haug LS, Huber S, Schlabach M, Becher G and Thomsen C, 2011. Investigation on per- and polyfluorinated compounds in paired samples of house dust and indoor air from Norwegian homes. Environmental Science &
Technology, 45, 7991–7998.
Available at: Investigation on per- and polyfluorinated compounds in paired samples of house dust and indoor air from Norwegian homes - PubMed (nih.gov)
Meng, Q., Inoue, K., Ritz, B., Olsen, J. and Liew, Z., 2018. Prenatal exposure to perfluoroalkyl substances and birth outcomes; an updated analysis from the Danish National Birth Cohort. International journal of environmental research and public health, 15(9), p.1832.
Available at: IJERPH | Free Full-Text | Prenatal Exposure to Perfluoroalkyl Substances and Birth Outcomes; An Updated Analysis from the Danish National Birth Cohort (mdpi.com)
Michigan Science Advisory Workgroup (2019). Health-based drinking water value recommendations for PFAS in Michigan.
Available at: Health-Based Drinking Water Value Recommendations for PFAS in Michigan Report
Padilla-Sánchez JA, Papadopoulou E, Poothong S, and Haug LS. (2017). Investigation of the Best Approach for Assessing Human Exposure to Poly- and Perfluoroalkyl Substances through Indoor Air. Environmental Science and Technology. 51: 12836 – 12843.
Poothong S, Papadopoulou E, Padilla-Sánchez JA, Thomsen C and Haug LS. (2020). Multiple pathways of human exposure to poly- and perfluoroalkyl
substances (PFASs): From external exposure to human blood. Environment International. 134: 105244.
Available at: Multiple pathways of human exposure to poly- and perfluoroalkyl substances (PFASs): From external exposure to human blood - ScienceDirect
RIVM (National Institute for Public Health and the Environment Ministry of Health, Welfare and Sport) (2018). Mixture exposure to PFAS: A Relative Potency Factor approach.
Available at: Mixture exposure to PFAS: A Relative Potency Factor approach (rivm.nl)
Regulation (EU) 2019/1021 of the European Parliament and of the Council of 20 June 2019 on persistent organic pollutants.
Available at: EUR-Lex - 32019R1021 - EN - EUR-Lex (europa.eu)
Roberts C, Steer T, Maplethorpe N, Cox L, Meadows S, Nicholson S, Page P, and Swan G. (2018). National Diet and Nutrition Survey. Results from Years 7 and 8 (combined) of the Rolling Programme (2014/2015 to 2015/2016): National Diet and Nutrition Survey (publishing.service.gov.uk)
Schlummer M, Gruber L, Fiedler D, Kizlauskas M and Müller J. (2013). Detection of fluorotelomer alcohols in indoor environments and their relevance for human exposure. Environment International. 57-58: 42-49
Sunderland, E.M., Hu, X.C., Dassuncao, C., Tokranov, A.K., Wagner, C.C. and Allen, J.G., 2019. A review of the pathways of human exposure to poly-and perfluoroalkyl substances (PFASs) and present understanding of health effects. Journal of exposure science & environmental epidemiology, 29(2), pp.131-147.
Available at: A review of the pathways of human exposure to poly- and perfluoroalkyl substances (PFASs) and present understanding of health effects | Journal of Exposure Science & Environmental Epidemiology (nature.com)
Swedish Environmental Protection Agency (Borg D and Håkansson H) (2012). Environmental and Health Risk Assessment of Perfluoroalkylated and Polyfluoroalkylated Substances (PFASs) in Sweden. Available at: Vi hittar inte sidan... (naturvardsverket.se)
Vaccine Knowledge Project
Available at: Diphtheria | Vaccine Knowledge (ox.ac.uk)
Winkens K, Koponen J, Schuster J, Shoeib M, Vestergren R, Berger U, Karvonen A., Pekkanen J, Kiviranta H and Cousins IT. (2017). Perfluoroalkyl acids and their precursors in indoor air sampled in children's bedrooms. Environmental Pollution. 222: 423-432.
Available at: Perfluoroalkyl acids and their precursors in indoor air sampled in children's bedrooms - ScienceDirect
WHO/IPCS (World Health Organization/International Programme on Chemical Safety) (2012). Guidance for immunotoxicity risk assessment for chemicals. Available at: Harmonization Project Document No. 10: Guidance for Immunotoxicity Risk Assessment for Chemicals (inchem.org)
Abbreviations - Statement on the EFSA Opinion on the risks to human health related to the presence of perfluoroalkyl substances in food
In this guide
In this guide|
ADME |
absorption, distribution, metabolism and excretion |
|
AFFF |
aqueous film-forming foam |
|
ALT |
Alanine aminotransferase |
|
ANSES |
Agency for Food, Environmental and Occupational Health and Safety |
|
ATSDR |
Agency for Toxic Substances and Disease Registry |
|
BMD |
Benchmark dose |
|
BMDL |
Benchmark dose lower confidence limit |
|
BMDS |
Benchmark Dose Software |
|
BMDU |
Benchmark dose upper confidence limit |
|
BMR |
Benchmark response |
|
CI |
Confidence interval |
|
CONTAM |
Contaminants in the Food Chain |
|
COT |
The Committee on Toxicity of Chemicals in Food, Consumer products and the Environment |
|
EFSA |
European Food Safety Authority |
|
FSANZ |
Food Safety Australia New Zealand |
|
FSA |
Food Standards Agency |
|
FC-807 |
Ammonium bis[2-[N-ethyl(hepatodecafluorooctane)sulphonylamino]ethyl]phosphate |
|
8:2 FTOH |
8:2 Fluorotelomer alcohol |
|
8:2 monoPAP |
8:2 Fluorotelomer phosphate monoester |
|
8:2 diPAP |
8:2 Fluorotelomer phosphate diester |
|
GFR |
Glomerular filtration rate |
|
GI |
Gastrointestinal tract |
|
HBGV |
Health-based guidance value |
|
HBM |
German Human Biomonitoring |
|
Hib |
Haemophilus Influenzae type b |
|
IPCS |
International Programme on Chemical Safety |
|
LDL |
Low-density lipoprotein |
|
NOAEC |
No observed adverse effect concentration |
|
EtFOSA |
N-ethyl perfluorooctane sulphonamide |
|
EtFOSE |
N-ethyl perfluorooctane sulfonamidoethanol |
|
OATs |
Organic anion transporters |
|
FOSA |
Perfluorooctane sulphonamide |
|
PBPK |
Physiologically-based Pharmacokinetic |
|
PCP |
personal care product |
|
PFASs |
Perfluoroalkylated substances |
|
PFBA |
Perfluorobutanoic acid |
|
PFCAs |
Perfluoroalkyl carboxylic acids |
|
PFPeA |
Perfluoropentanoic acid |
|
PFHxA |
Perfluorohexanoic acid |
|
PFHpA |
Perfluoroheptanoic acid |
|
PFOA |
Perfluorooctanoic acid |
|
PFNA |
Perfluorononanoic acid |
|
PFDA |
Perfluorodecanoic acid |
|
PFUnDA |
Perfluoroundecanoic acid |
|
PFDoDA |
Perfluorododecanoic acid |
|
PFHxDA |
Perfluorohexadecanoic acid |
|
PFODA |
Perfluorooctadecanoic acid |
|
PFTrDA |
Perfluorotridecanoic acid |
|
PFteDA |
Perfluorotetradecanoic acid |
|
PFPeDA |
Perfluoropentadecanoic acid |
|
PFSAs |
Perfluoroalkane sulfonic acids |
|
PFBS |
Perfluorobutane sulfonic acid |
|
PFHxS |
Perfluorohexane sulfonic acid |
|
PFHpS |
Perfluoroheptane sulfonic acid |
|
PFOS |
Perfluorooctane sulfonic acid |
|
PFDS |
Perfluorodecane sulfonic acid |
|
PFOSI |
Perfluorooctane sulfinic acid |
|
POP |
persistent organic pollutants |
|
RIVM |
Dutch National Institute for Public Health and the Environment |
|
TEQ |
Toxic equivalent |
|
TWIs |
Tolerable weekly intakes |
|
WHO |
World Health Organisation |
Technical Information - Statement on the EFSA Opinion on the risks to human health related to the presence of perfluoroalkyl substances in food
In this guide
In this guide|
karyopyknosis |
Karyopyknosis is the irreversible condensation of chromatin in the nucleus of a cell undergoing necrosis or apoptosis. |
|
surface water |
A surface water is one abstracted form a river or reservoir and groundwater is abstracted from a well or borehole. Springs are a bit of a grey area and some groundwaters can be influenced by surface water. Generally, groundwaters are of better and more stable quality but can be affected by persistent pollutants. About 2/3 of the drinking water supply in England and Wales is derived from surface water and 1/3 from groundwater. The south and the east is more dependent on groundwater supplies than the north and the west (DWI, personal communication, 2021). |
Annex A - Statement for use of the EFSA 2020 Opinion on the risks to human health related to the presence of perfluoroalkyl substances in food in UK risk assessments
In this guide
In this guideBreast milk exposures
1. A literature search was carried out for concentrations of PFAS in human breast milk. There were no UK data. Only data from countries in the EU with breast milk samples taken after 2008 were considered. Only those that had median and/or maximum values were included in the exposure calculations. Tables 1 to 4 show the studies and breast milk concentrations for PFOS, PFOA, PFHxS and PFNA, respectively.
Table 1. Concentrations of PFOS in breast milk in EU studies where breast milk samples were taken after 2008.
|
Region, country |
Year of sampling |
Number of samples |
Mean LB-UB (SEMa, SDb or 95% CIc) (ng/L) |
Median (ng/L) |
Range (ng/L) |
LODa LOQb (ng/L) |
Detection frequency (%) |
Reference |
|
Barcelona, Spain |
2009 |
20 |
120# |
84# |
< LOQ-870 |
3.5a |
95# |
Llorca et al., 2010 |
|
France |
2010 |
30 |
78 |
74 |
24-170 |
2a |
100 |
Kadar et al., 2011 |
|
Belgium |
2009- 2010 |
40 (P & M) |
130 |
100 |
70 - 220 (P10 - P90) |
10b |
100 (>LOQ) |
Croes et al., 2012 |
|
Bologna, Italy |
2010 |
21 (P) |
57 (13a) |
NR |
<LOQ - 290 |
15b |
90 |
Barbarossa et al., 2013 |
|
Bologna, Italy |
2010 |
16 (M) |
36 (7a) |
NR |
<LOQ - 120 |
15b |
63 |
Barbarossa et al., 2014 |
|
France |
2010-2013 |
61 |
40* |
<LOQ |
<LOD - 380 |
NRa |
82 (>LOD) |
Cariou et al., 2015 |
|
Czech Republic |
2010 |
50 |
53 |
30 |
7-110 |
5b |
100 (>LOQ) |
Lankova et al., 2013 |
|
Czech Republic |
2010 |
50 |
54 |
17 (branched) |
<LOQ - 63 |
10b |
72 (>LOQ) |
Lankova et al., 2014 |
|
Seine-Saint Denis, Ardèche, Isère, Loire and Savoie (France) |
2007 |
48 (P) |
92 |
79 |
<LOD - 330 |
50a |
90 |
Antignac et al., 2013 |
|
Ireland |
Not identified in paper |
16 (P) pooled samples |
38 |
20 |
<20 - 120 |
20b |
62 |
Abdallah et al., 2020 |
|
Stockholm, Sweden |
2012 |
20 |
51# |
45# |
16 - 96 |
0.5a |
100 (linear) |
Nyburg et al., 2018 |
|
Gothenburg, Sweden |
2012 |
16 |
44# |
38# |
13 - 100 |
0.5a |
100 (linear) |
Nyburg et al., 2019 |
|
Stockholm, Sweden |
2016 |
10 |
46# |
45# |
24 - 72 |
0.5a |
100 (linear) |
Nyburg et al., 2020 |
Values are given to 2 significant figures. P – primiparous; M – multiparous; SEM – standard error of the mean; LB - lower bound assigns the value of zero to non-quantified data; UB - upper bound assigns the value of the LOD/LOQ to non-quantified data; SD – standard deviation; 95% CI – 95th percent confidence interval; NR – not reported; LOD – limit of detection; LOQ – limit of quantification P10 – P90 – 10th to 90th percentiles. *identified by year; #calculated from individual data in the published paper.
Table 2. Concentrations of PFOA in breast milk in recent EU studies where breast milk samples were taken after 2008.
|
Region, country |
Year of sampling |
No. of samples |
Mean LB-UB (SEMa, SDb or 95% CIc) (ng/L) |
Median (ng/L) |
Range (ng/L) |
LODa LOQb (ng/L) |
Detection frequency (%) |
Reference |
|
Barcelona, Spain |
2008 |
20 |
150-151# |
<LOQ# |
< LOQ-907 |
4.5a |
45 |
Llorca et al., 2010 |
|
France |
2010 |
30 |
59 |
57 |
18-102 |
3a |
100 |
Kadar et al., 2011 |
|
Belgium |
2009- 2010 |
40 (P & M) |
80 |
70 |
60 - 150 (P10 - P90) |
10b |
100 (>LOQ) |
Croes et al., 2012 |
|
Bologna, Italy |
2010 |
21 (P) |
76 (14)a |
NR |
24 - 241 |
24b |
81 |
Barbarossa et al., 2013 |
|
Bologna, Italy |
2010 |
16 (M) |
43 (6)a |
NR |
24 - 100 |
24b |
69 |
Barbarossa et al., 2013 |
|
France |
2010-2013 |
61 |
41* |
<LOQ |
<LOD - 308 |
NRa |
77 (>LOD) |
Cariou et al., 2015 |
|
Czech Republic |
2010 |
50 |
50 |
44 |
12 - 128 |
6b |
100 (>LOQ) |
Lankova et al., 2013 |
|
Murcia, Spain |
2014 |
67 (P & M) |
54 (54)b |
26 |
<LOQ - 211 |
10b |
60 |
Guzman et al., 2016 |
|
Seine-Saint Denis, Ardèche, Isère, Loire and Savoie (France) |
2007 |
48 |
82 |
75 |
<LOD - 224 |
50a |
98 |
Antignac et al., 2013 |
|
Ireland |
Not identified in paper |
16 (P) pooled samples |
130 |
100 |
16 - 350 |
20b |
100 |
Abdallah et al., 2020 |
|
Stockholm, Sweden |
2012 |
20 |
53# |
45# |
23 - 102 |
2a |
100 |
Nyburg et al., 2018 |
|
Gothenburg, Sweden |
2012 |
16 |
53# |
49# |
21 - 104 |
2a |
100 |
Nyburg et al., 2019 |
|
Stockholm, Sweden |
2016 |
10 |
44# |
42# |
3 - 83 |
2a |
100 |
Nyburg et al., 2020 |
Values are given to 2 significant figures. P – primiparous; M – multiparous; SEM – standard error of the mean; LB - lower bound assigns the value of zero to non-quantified data; UB - upper bound assigns the value of the LOD/LOQ to non-quantified data; SD – standard deviation; 95% CI – 95th percent confidence interval; NR – not reported; LOD – limit of detection; LOQ – limit of quantification P10 – P90 – 10th to 90th percentiles. *identified by year; #calculated from individual data in the published paper.
Table 3. Concentrations of PFHxS in breast milk in recent EU studies where breast milk samples were taken after 2008.
|
Region, country |
Year of sampling |
No. of samples |
Mean LB-UB (SEMa, SDb or 95% CIc) (ng/L) |
Median (ng/L) |
Range (ng/L) |
LODa LOQb (ng/L) |
Detection frequency (%) |
Reference |
|
Belgium |
2009- 2010 |
40 (P & M) |
NC |
<LOQ |
<LOQ - 20 (P10 - P90) |
10b |
20 (>LOQ) |
Croes et al., 2012 |
|
France |
2010-2013 |
61 |
26* |
<LOD |
<LOD-217 |
10 - 30a |
15 (>LOD) |
Cariou et al., 2015 |
|
Czech Republic |
2010 |
50 |
NC |
NC |
<6 - 12 |
6b |
8 (>LOQ) |
Lankova et al., 2013 |
|
Seine-Saint Denis, Ardèche, Isère, Loire and Savoie (France) |
2007 |
48 |
49 |
50 |
40 - 66 |
NRa,b |
100 |
Antignac et al., 2013 |
|
Ireland |
Not identified in paper |
16 (P) pooled samples |
<40 |
<40 |
<40 - 87 |
40b |
31 |
Abdallah et al., 2020 |
|
Stockholm, Sweden |
2012 |
20 |
8.38 |
7.55 |
0.8 - 25.4 |
0.8a |
95 (linear) |
Nyburg et al., 2018 |
|
Gothenburg, Sweden |
2012 |
16 |
5.60625 |
4.1 |
1.4 - 14.4 |
0.8a |
94 (linear) |
Nyburg et al., 2019 |
|
Stockholm, Sweden |
2016 |
10 |
7.63 |
8.2 |
0.8 - 13.4 |
0.8a |
80 (linear) |
Nyburg et al., 2020 |
Values are given to 2 significant figures. P – primiparous; M – multiparous; SEM – standard error of the mean; LB - lower bound assigns the value of zero to non-quantified data; UB - upper bound assigns the value of the LOD/LOQ to non-quantified data; SD – standard deviation; 95% CI – 95th percent confidence interval; NC not calculated; NR – not reported; LOD – limit of detection; LOQ – limit of quantification P10 – P90 – 10th to 90th percentiles. *identified by year; #calculated from individual data in the published paper.
Table 4. Concentrations of PFNA in breast milk in recent EU studies where breast milk samples were taken after 2008.
|
Region, country |
Year of sampling |
No. of samples |
Mean LB-UB (SEMa, SDb or 95% CIc) (ng/L) |
Median (ng/L) |
Range (ng/L) |
LODa LOQb (ng/L) |
Detection frequency (%) |
Reference |
|
Belgium |
2009- 2010 |
40 (P & M) |
NC |
<LOQ |
<LOQ - 20 (P10 - P90) |
10b |
43 (>LOQ) |
Croes et al., 2012 |
|
France |
2010-2013 |
0/61 quantified |
11* |
<LOD |
<LOD-<LOD |
NRa |
0 (>LOD) |
Cariou et al., 2015 |
|
Czech Republic |
2010 |
50 |
NC |
NC |
<6 - 15 |
6b |
48 (>LOQ) |
Lankova et al., 2013 |
|
Murcia, Spain |
2014 |
67 (P & M) |
41 (29)b |
40 |
15 - 70 |
10b |
6 |
Guzman et al., 2016 |
|
Seine-Saint Denis, Ardèche, Isère, Loire and Savoie (France) |
2007 |
Detected 1/48 |
NC |
NC |
<LOD - 64 |
50a |
2 |
Antignac et al., 2013 |
|
Ireland |
Not identified in paper |
16 (P) pooled samples |
26 |
14 |
<10 - 100 |
10b |
69 |
Abdallah et al., 2020 |
|
Stockholm, Sweden |
2012 |
20 |
15 |
15 |
3 - 30 |
2a |
100 |
Nyburg et al., 2018 |
|
Gothenburg, Sweden |
2012 |
16 |
17 |
16 |
5 - 38 |
2a |
100 |
Nyburg et al., 2019 |
|
Stockholm, Sweden |
2016 |
10 |
9.3 |
10 |
1 - 18 |
2a |
70 |
Nyburg et al., 2020 |
Values are given to 2 significant figures. P – primiparous; M – multiparous; SEM – standard error of the mean; LB - lower bound assigns the value of zero to non-quantified data; UB - upper bound assigns the value of the LOD/LOQ to non-quantified data; SD – standard deviation; 95% CI – 95th percent confidence interval; NC not calculated; NR – not reported; LOD – limit of detection; LOQ – limit of quantification P10 – P90 – 10th to 90th percentiles. *identified by year; #calculated from individual data in the published paper.
2. In the absence of a suitable UK study of PFAS in breast milk, data from EU studies for which all samples were taken after 2008 have been used to calculate exposures to PFAS from breast milk in this paper. The exposure estimates are based on concentrations derived as an average of the median (Table 5) or maximum (Table 6) values reported in the literature.
Table 5. Concentrations (ng/L) derived as an average of the median values reported in the literature.
|
Chemical |
Average of reported median values (ng/L) |
References |
|
PFOS |
53 |
Llorca et al., 2010; Kadar et al., 2011; Croes et al., 2012; Lankova et al., 2013; Antignac et al., 2013; Abdallah et al., 2020; and Nyburg et al., 2018 |
|
PFOA |
56 |
Kadar et al., 2011; Croes et al., 2012; Lankova et al., 2013; Guzman et al., 2016; Antignac et al., 2013; Abdallah et al., 2020; and Nyburg et al., 2018 |
|
PFHxS |
17 |
Antignac et al., 2013; and Nyburg et al., 2018 |
|
PFNA |
19 |
Guzman et al., 2016; Abdallah et al., 2020; and Nyburg et al., 2018 |
Table 6. Concentrations (ng/L) derived as an average of the maximum values reported in the literature.
|
Chemical |
Average of reported maximum values (ng/L) |
References |
|
PFOS |
170* |
Llorca et al., 2010; Kadar et al., 2011; Croes et al., 2012; Barbarossa et al., 2013; Cariou et al., 2015; Lankova et al., 2013; Antignac et al., 2013; Abdallah et al., 2020; and Nyburg et al., 2018 |
|
PFOA |
180 |
Llorca et al., 2010; Kadar et al., 2011; Croes et al., 2012; Barbarossa et al., 2013; Cariou et al., 2015; Lankova et al., 2013; Guzman et al., 2016; Antignac et al., 2013; Abdallah et al., 2020; and Nyburg et al., 2018 |
|
PFHxS |
30 |
Antignac et al., 2013; and Nyburg et al., 2018 |
|
PFNA |
51 |
Guzman et al., 2016; Abdallah et al., 2020; and Nyburg et al., 2018 |
*The maximum PFOS value in the Llorca et al., (2010) study was from an individual and was approximately 5 – 30-fold higher than all other measure values. Therefore, the second highest value from this study was used.
3. No consumption data were available for exclusive breastfeeding in infants aged 0 to 6 months. Therefore, the default consumption values used by the COT in other evaluations of the infant diet of average (800 mL) and high-level (1200 mL) consumption have been used to estimate exposures to PFOS and PFOA from breast milk. Bodyweights of 5.9 and 7.8 kg were used for infants aged 0 - <4 and 4 - <6 months, respectively.
4. For the average median PFASs concentrations in breast milk the following ranges of exposures were calculated which included average and high consumers:
- PFOS: 38 – 75 ng/kg bw per week
- PFOA: 40 – 80 ng/kg bw per week
- PFHxS: 12 – 24 ng/kg bw per week
- PFNA: 14 – 27 ng/kg bw per week
5. For the average maximum PFASs concentrations in breast milk the following ranges of exposures were calculated which included average and high consumers:
- PFOS: 120 - 240 ng/kg bw per week
- PFOA: 130 - 260 ng/kg bw per week
- PFHxS: 22 - 43 ng/kg bw per week
- PFNA: 37 - 73 ng/kg bw per week
Table 7. Estimated PFOS, PFOA, PFHxS and PFNA exposure (ng/kg bw per week) in 0 to 6-month-old infants and from breast milk
|
PFOS concentration ng/L |
0 to <4 months (800 mL) |
0 to <4 months (1,200 mL) |
4 to <6 months (800 mL) |
4 to <6 months (1,200 mL) |
|
PFOS concentration 53 ng/L |
50 |
75 |
38 |
57 |
|
PFOS concentration 170 ng/L |
160 |
240 |
120 |
180 |
|
PFOA concentration 56 ng/L |
53 |
80 |
40 |
60 |
|
PFOA concentration 180 ng/L |
170 |
260 |
130 |
190 |
|
PFHxS concentration 17 ng/L |
16 |
24 |
12 |
18 |
|
PFHxS concentration 30 ng/L |
28 |
43 |
22 |
32 |
|
PFNA concentration 19 ng/L |
18 |
27 |
14 |
20 |
|
PFNA concentration 51 ng/L |
48 |
73 |
37 |
55 |
Exposure values were calculated based on default consumption values of 800 and 1200 mL for average and high-level exclusive consumption of breast milk and expressed on a bodyweight (5.9 kg for infants aged 0-4 months and 7.8 kg for infants aged 4 to < 6 months) basis.
COT
October 2022
Statement Number 04/22
References
Abdallah MA-E, Wemken N, Drage DS, Tlustos C, Cellarius C, Cleere K, Morrison JJ, Daly S, Coggins MA and Harrad S. (2020). Concentrations of perfluoroalkyl substances in human milk from Ireland: Implications for adult and nursing infant exposure. Chemosphere. 246: 125724.
Antignac J-P, Veyrand B, Kadar H, Marchand P, Oleko A, Le Bizec B, and Vandentorren S. (2013). Occurrence of perfluorinated alkylated substances in breast milk of French women and relation with socio-demographical and clinical parameters: Results of the ELFE pilot study. Chemosphere. 91: 802-808.
Barbarossa A, Masetti R, Gazzotti T, Zama D, Astolfi A, Veyrand B, Pession A, Pagliuca G. (2013). Perfluoroalkyl substances in human milk: a first survey in Italy. Environment International. 51:27-30.
Available at: Perfluoroalkyl substances in human milk: a first survey in Italy - PubMed (nih.gov)
Cariou R, Veyrand B, Yamada A, Berrebi A, Zalko D, Durand S, Pollono C, Marchand P, Leblanc JC, Antignac JP, Le Bizec B. (2015). Perfluoroalkyl acid (PFAA) levels and profiles in breast milk, maternal and cord serum of French women and their newborns. Environment International. 84:71-81.
Available at: Perfluoroalkyl acid (PFAA) levels and profiles in breast milk, maternal and cord serum of French women and their newborns - PubMed (nih.gov)
Croes K, Colles A, Koppen G, Govarts E, Bruckers L, Van de Mieroop E, Nelen V, Covaci A, Dirtu AC, Thomsen C, Haug LS, Becher G, Mampaey M, Schoeters G, Van Larebeke N, Baeyens W. (2012). Persistent organic pollutants (POPs) in human milk: a biomonitoring study in rural areas of Flanders (Belgium). Chemosphere. 89(8):988-94.
Available at: Persistent organic pollutants (POPs) in human milk: a biomonitoring study in rural areas of Flanders (Belgium) - PubMed (nih.gov)
Kadar H, Veyrand B, Barbarossa A, Pagliuca G, Legrand A, Bosher C, Boquien CY, Durand S, Monteau F, Antignac JP, Le Bizec B. (2011). Development of an analytical strategy based on liquid chromatography–high resolution mass spectrometry for measuring perfluorinated compounds in human breast milk: Application to the generation of preliminary data regarding perinatal exposure in France. Chemosphere. 85(3):473-80.
Available at: Development of an analytical strategy based on liquid chromatography-high resolution mass spectrometry for measuring perfluorinated compounds in human breast milk: application to the generation of preliminary data regarding perinatal exposure in France - PubMed (nih.gov)
Lankova D, Lacina O, Pulkrabova J, Hajslova J. (2013). The determination of perfluoroalkyl substances, brominated flame retardants and their metabolites in human breast milk and infant formula. Talanta. 117:318-25.
Available at: The determination of perfluoroalkyl substances, brominated flame retardants and their metabolites in human breast milk and infant formula - PubMed (nih.gov)
Llorca M, Farré M, Picó Y, Teijón ML, Alvarez JG, Barceló D. (2010). Infant exposure of perfluorinated compounds: levels in breast milk and commercial baby food. Environment International. 36(6):584-92.
Available at: Infant exposure of perfluorinated compounds: levels in breast milk and commercial baby food - PubMed (nih.gov)
Guzmàn M, Clementini C, Pérez-Cárceles MD, Jiménez Rejón S, Cascone A, Martellini T, Guerranti C, Cincinelli A. (2016). Perfluorinated carboxylic acids in human breast milk from Spain and estimation of infant's daily intake. The Science of the Total Environment. 544:595-600.
Available at: Perfluorinated carboxylic acids in human breast milk from Spain and estimation of infant's daily intake - PubMed (nih.gov)
Nyberg E, Awad R, Bignert A, Ek C, Sallsten G and Benskin JP. (2018). Inter-individual, inter-city, and temporal trends of per- and polyfluoroalkyl substances in human milk from Swedish mothers between 1972 and 2016. Environmental Science: Processes and Impacts. 20: 1136.
Annex B - Statement for use of the 2020 EFSA Opinion on the risks to human health related to the presence of perfluoroalkyl substances in food in UK risk assessments
In this guide
In this guideUK dietary exposures (non-breast milk)
1. UK exposures from the EFSA Opinion have been tabulated for ease. The values were taken from Annex A, Table/Spreadsheet A5. Only data from UK surveys for the sum of all 4 PFASs were included. The data in the Opinion were on a ng/kg bw per day basis (Table 1a). The values were multiplied by 7 (Table 1b) to gives values for ng/kg bw per week.
Table 1a. Mean and 95th percentile(a) chronic exposures to the 4 PFASs (ng/kg b.w. per day) for total population.
|
Survey |
Age |
Number of subjects |
LB Mean exposure |
UB Mean exposure |
LB 95th Exposure |
UB 95th Exposure |
|
NDNS years 1-3 |
Toddlers |
185 |
2.4 |
64 |
6.4 |
120 |
|
NDNS years 1-3 |
Other children |
651 |
1.4 |
47 |
3.9 |
91 |
|
NDNS years 1-3 |
Adolescents |
666 |
0.5 |
21 |
1.5 |
49 |
|
NDNS years 1-3 |
Adults |
1266 |
0.6 |
14 |
1.8 |
29 |
|
NDNS years 1-3 |
Elderly |
166 |
0.8 |
14 |
2.1 |
29 |
|
NDNS years 1-3 |
Very elderly |
139 |
0.8 |
16 |
2.2 |
32 |
|
DNSIYC 2011 |
Infants |
1369 |
8.8 |
85 |
15 |
120 |
|
DNSIYC 2011 |
Toddlers |
1314 |
4.1 |
66 |
11 |
110 |
Exposures are to 2 significant figures.
Table 1b. Mean and 95th percentile(a) chronic exposures to the 4 PFASs (ng/kg b.w. per week) for total population.
|
Survey |
Age |
Number of subjects |
LB Mean exposure |
UB Mean exposure |
LB 95th Exposure |
UB 95th Exposure |
|
NDNS years 1-3 |
Toddlers |
185 |
17 |
450 |
45 |
850 |
|
NDNS years 1-3 |
Other children |
651 |
9.7 |
330 |
27 |
640 |
|
NDNS years 1-3 |
Adolescents |
666 |
3.2 |
150 |
10 |
350 |
|
NDNS years 1-3 |
Adults |
1266 |
4.3 |
97 |
13 |
200 |
|
NDNS years 1-3 |
Elderly |
166 |
5.5 |
100 |
14 |
210 |
|
NDNS years 1-3 |
Very elderly |
139 |
5.6 |
110 |
15 |
220 |
|
DNSIYC 2011 |
Infants |
1369 |
61 |
590 |
110 |
870 |
|
DNSIYC 2011 |
Toddlers |
1314 |
29 |
460 |
74 |
770 |
Exposures are to 2 significant figures.
COT
October 2022
Statement Number 04/22
Annex C - Statement for use of the 2020 EFSA Opinion on the risks to human health related to the presence of perfluoroalkyl substances in food in UK risk assessments
In this guide
In this guideDust exposures
1. A literature search was carried out for concentrations of PFAS in dust. There were few UK data. Therefore, data from countries in the EU where dust samples in the home had been collected, were also considered. Only studies with samples collected in homes that had median and/or maximum values were included in the exposure calculations. Tables 1 to 4 show the study information and dust concentrations for PFOS and PFOA, PFHxS and PFNA, respectively.
Table 1. Concentrations of PFOS in dust (ng/g) in UK and EU studies where samples were taken in homes, after 2008.
|
Region, country |
Year of sampling |
No. of samples |
Mean LB-UB (ng/g) (SEMa, SDb or 95% CIc) |
Median (ng/g) |
Range (ng/g) |
LODa LOQb (ng/g) |
Detection frequency (%) |
Reference |
|
Birmingham, UK |
2007 - 2009 |
45 |
450 |
140 |
3.5 - 7400 |
|
100 |
Goosey and Harrad, 2011 |
|
Annecy, France |
2007 - 2009 |
10 |
330 |
160 |
54 - 1700 |
|
100 |
Goosey and Harrad, 2011 |
|
Augsburg and Michelstadt, Germany |
2007 - 2009 |
10 |
310 |
170 |
47 - 1000 |
|
100 |
Goosey and Harrad, 2011 |
|
Ireland |
2016 - 2017 |
32 |
6 |
0.96 |
<0.1 - 140 |
0.1 |
63 |
Harrad et al., 2020 |
|
Belgium |
2016 - 2017 |
22 |
NC |
0.77 |
ND - 6.81 |
0.04 |
73 |
de la Torre et al., 2019 |
|
Italy |
2016 - 2017 |
22 |
NC |
0.33 |
ND - 11.9 |
0.04 |
73 |
de la Torre et al., 2019 |
|
Spain |
2016 - 2017 |
21 |
NC |
0.03 |
ND - 2.45 |
0.04 |
43 |
de la Torre et al., 2019 |
|
Catalonia, Spain |
2009 |
10 |
2.8# |
2.5# |
1.1 - 12 |
0.13a |
100 |
Jogsten et al., 2012 |
Values are given to 2 significant figures. SEM – standard error of the mean; LB - lower bound assigns the value of zero to non-quantified data; UB - upper bound assigns the value of the LOD/LOQ to non-quantified data; SD – standard deviation; 95% CI – 95th percent confidence interval; NC not calculated; ND – not determined; LOD – limit of detection; LOQ – limit of quantification; #calculated from individual data in the published paper.
Table 2. Concentrations of PFOA in dust (ng/g) in UK and EU studies where samples were taken in homes, after 2008.
|
Region, country |
Year of sampling |
No. of samples |
Mean LB-UB (ng/g) (SEMa, SDb or 95% CIc) |
Median (ng/g) |
Range (ng/g) |
LODa LOQb (ng/g) |
Detection frequency (%) |
Reference |
|
Birmingham, UK |
2007 - 2009 |
45 |
310 |
190 |
<0.98 - 4100 |
0.98 |
98 |
Goosey and Harrad, 2011 |
|
Annecy, France |
2007 - 2009 |
10 |
52 |
31 |
15 - 220 |
0.98 |
100 |
Goosey and Harrad, 2011 |
|
Augsburg and Michelstadt, Germany |
2007 - 2009 |
10 |
290 |
300 |
19 - 730 |
0.98 |
100 |
Goosey and Harrad, 2011 |
|
Ireland |
2016 - 2017 |
32 |
4.7 |
0.42 |
<0.05 - 83 |
0.05 |
66 |
Harrad et al., 2020 |
|
Belgium |
2016 - 2017 |
22 |
NC |
1.54 |
0.31 - 24.2 |
0.11 |
100 |
de la Torre et al., 2019 |
|
Italy |
2016 - 2017 |
22 |
NC |
1.56 |
0.21 - 53 |
0.11 |
100 |
de la Torre et al., 2019 |
|
Spain |
2016 - 2017 |
21 |
NC |
1 |
0.42 - 12.5 |
0.11 |
100 |
de la Torre et al., 2019 |
|
Catalonia, Spain |
2009 |
10 |
5.4# |
4.2# |
1.5 - 36 |
0.16a |
100 |
Jogsten et al., 2012 |
Values are given to 2 significant figures. SEM – standard error of the mean; LB - lower bound assigns the value of zero to non-quantified data; UB - upper bound assigns the value of the LOD/LOQ to non-quantified data; SD – standard deviation; 95% CI – 95th percent confidence interval; NC not calculated; LOD – limit of detection; LOQ – limit of quantification; #calculated from individual data in the published paper.
Table 3. Concentrations of PFHxS in dust (ng/g) in UK and EU studies where samples were taken in homes, after 2008.
|
Region, country |
Year of sampling |
No. of samples |
Mean LB-UB (ng/g) (SEMa, SDb or 95% CIc) |
Median (ng/g) |
Range (ng/g) |
LODa LOQb (ng/g) |
Detection frequency (%) |
Reference |
|
Birmingham, UK |
2007 - 2009 |
45 |
450 |
210 |
7.6 - 6100 |
|
100 |
Goosey and Harrad, 2011 |
|
Annecy, France |
2007 - 2009 |
10 |
130 |
77 |
54 - 320 |
|
100 |
Goosey and Harrad, 2011 |
|
Augsburg and Michelstadt, Germany |
2007 - 2009 |
10 |
290 |
150 |
16 - 790 |
|
100 |
Goosey and Harrad, 2011 |
|
Ireland |
2016 - 2017 |
32 |
1.4 |
<0.1 |
<0.1 - 9.9 |
0.1 |
47 |
Harrad et al., 2020 |
|
Belgium |
2016 - 2017 |
22 |
NC |
0.13 |
ND - 11.3 |
0.18 |
23 |
de la Torre et al., 2019 |
|
Italy |
2016 - 2017 |
22 |
NC |
0.13 |
ND - 3.62 |
0.18 |
36 |
de la Torre et al., 2019 |
|
Spain |
2016 - 2017 |
21 |
NC |
0.95 |
ND - 7.16 |
0.18 |
76 |
de la Torre et al., 2019 |
|
Catalonia, Spain |
2009 |
10 |
0.57# |
0.45# |
0.17 - 5.3 |
0.003a |
100 |
Jogsten et al., 2012 |
Values are given to 2 significant figures. SEM – standard error of the mean; LB - lower bound assigns the value of zero to non-quantified data; UB - upper bound assigns the value of the LOD/LOQ to non-quantified data; SD – standard deviation; 95% CI – 95th percent confidence interval; NC not calculated; ND – not determined; LOD – limit of detection; LOQ – limit of quantification; #calculated from individual data in the published paper.
Table 4. Concentrations of PFNA in dust (ng/g) in UK and EU studies where samples were taken in homes, after 2008.
|
Region, country |
Year of sampling |
No. of samples |
Mean LB-UB (ng/g) (SEMa, SDb or 95% CIc) |
Median (ng/g) |
Range (ng/g) |
LODa LOQb (ng/g) |
Detection frequency (%) |
Reference |
|
Ireland |
2016 - 2017 |
32 |
0.52 |
<0.05 |
<0.05 - 14 |
0.05 |
9 |
Harrad et al., 2020 |
|
Belgium |
2016 - 2017 |
22 |
NC |
0.04 |
ND - 9.04 |
0.06 |
36 |
de la Torre et al., 2019 |
|
Italy |
2016 - 2017 |
22 |
NC |
0.1 |
ND - 6.54 |
0.06 |
55 |
de la Torre et al., 2019 |
|
Spain |
2016 - 2017 |
21 |
NC |
0.04 |
ND - 5.7 |
0.06 |
48 |
de la Torre et al., 2019 |
|
Catalonia, Spain |
2009 |
10 |
1.9# |
0.87# |
0.4 - 37 |
0.038a |
100 |
Jogsten et al., 2012 |
Values are given to 2 significant figures. SEM – standard error of the mean; LB - lower bound assigns the value of zero to non-quantified data; UB - upper bound assigns the value of the LOD/LOQ to non-quantified data; SD – standard deviation; 95% CI – 95th percent confidence interval; NC not calculated; ND – not determined; LOD – limit of detection; LOQ – limit of quantification; #calculated from individual data in the published paper.
2. The exposure estimates are based on concentrations derived as an average of the median (Table 5) or maximum (Table 6) values reported in the literature.
Table 5. Concentrations derived (ng/g) as an average of the median values reported in the literature.
|
Chemical |
Average of reported median values (ng/g) |
References |
|
PFOS |
59 |
Goosey and Harrad, 2011; Harrad et al., 2020; de la Torre et al., 2019; and Jogsten et al., 2012 |
|
PFOA |
66 |
Goosey and Harrad, 2011; Harrad et al., 2020; de la Torre et al., 2019; and Jogsten et al., 2012 |
|
PFHxS |
55 |
Goosey and Harrad, 2011; Harrad et al., 2020; de la Torre et al., 2019; and Jogsten et al., 2012 |
|
PFNA |
0.22 |
Harrad et al., 2020; de la Torre et al., 2019; and Jogsten et al., 2012 |
Concentrations are given to 2 sig. figs.
Table 6. Concentrations derived as an average of the maximum values reported in the literature.
|
Chemical |
Average of reported maximum values (ng/g) |
References |
|
PFOS |
1300 |
Goosey and Harrad, 2011; Harrad et al., 2020; de la Torre et al., 2019; and Jogsten et al., 2012 |
|
PFOA |
660 |
Goosey and Harrad, 2011; Harrad et al., 2020; de la Torre et al., 2019; and Jogsten et al., 2012 |
|
PFHxS |
910 |
Goosey and Harrad, 2011; Harrad et al., 2020; de la Torre et al., 2019; and Jogsten et al., 2012 |
|
PFNA |
14 |
Harrad et al., 2020; de la Torre et al., 2019; and Jogsten et al., 2012 |
Concentrations are given to 2 sig. figs.
3. Dust ingestion rates were taken from the EPA Exposure Factors Handbook (2011) Exposure Factors Handbook 2011 Edition (Final Report) | Science Inventory | US EPA which had been updated in 2017. Average bodyweights for the UK populations were calculated from NDNS (18 months – 95 years) and DNSIYC (4 – 18 months) data for different age groups. These are all shown in Table 7. Two bodyweights were provided for the toddler age group: 10 Kg for the 7 - 18 months age group and 16 Kg for those aged 18 months to 4 years. As the 16 Kg represented a wider age range, that was used in the exposure calculations.
4. Exposures from dust ingestion were calculated for median and high concentrations of PFOS, PFOA, PFHxS and PFNA and mean median ingestion rates, for each UK population group (Table 8).
Table 7. Dust ingestion rates and average UK bodyweights for UK population groups.
|
Population group |
dust ingestion (mg/day), mean +/- SD |
average UK bodyweight |
|
Infants |
36 ± 130 |
7.8 |
|
Toddlers |
41 ± 71 |
16 |
|
Children |
32 ± 59 |
31 |
|
Teenagers |
2.2 ± 3.6 |
63 |
|
Adults |
2.6 ± 4.2 |
79 |
|
Seniors |
2.6 ± 4.2 |
77 |
5. For the average median PFASs concentrations in dust, the following ranges of exposures were calculated for all UK population groups for each of the compounds (Table 8):
- PFOS (59 ng/g): 0.014 – 1.9 ng/kg bw per week
- PFOA (66 ng/g): 0.015 – 2.1 ng/kg bw per week
- PFHxS (55 ng/g): 0.013 – 1.8 ng/kg bw per week
- PFNA (0.22 ng/g): 0.000051 – 0.0071 ng/kg bw per week
6. For the average maximum PFASs concentrations in dust, the following ranges of exposures were calculated for all UK population groups for each of the compounds (Table 8):
- PFOS (1300 ng/g): 0.30 - 42 ng/kg bw per week
- PFOA (660 ng/g): 0.15 – 21 ng/kg bw per week
- PFHxS (910 ng/g): 0.21 – 29 ng/kg bw per week
- PFNA (14 ng/g): 0.0032 – 0.45 ng/kg bw per week
7. For all PFASs considered, infants had the highest exposures and teenagers, adults and seniors had the lowest exposures.
Table 8. Estimated exposures for PFOS, PFOA, PFHxS and PFNA (ng/kg bw per week) for UK population groups (mean dust ingestion rates (mg/day).
|
Exposure (ng/kg bw/week) |
Infants
|
Toddlers
|
Children
|
Teenagers
|
Adults
|
Seniors
|
|
PFOS (59 ng/g) |
1.9 |
1.1 |
0.43 |
0.014 |
0.014 |
0.014 |
|
PFOS (1300 ng/g) |
42 |
23 |
9.4 |
0.32 |
0.30 |
0.31 |
|
PFOA (66 ng/g) |
2.1 |
1.2 |
0.48 |
0.016 |
0.015 |
0.016 |
|
PFOA (660 ng/g) |
21 |
12 |
4.8 |
0.16 |
0.15 |
0.16 |
|
PFHxS (55 ng/g) |
1.8 |
0.99 |
0.40 |
0.013 |
0.013 |
0.013 |
|
PFHxS (910 ng/g) |
29 |
16 |
6.6 |
0.22 |
0.21 |
0.22 |
|
PFNA (0.22 ng/g) |
0.0071 |
0.0039 |
0.0016 |
0.000054 |
0.000051 |
0.000052 |
|
PFNA (14 ng/g) |
0.45 |
0.25 |
0.10 |
0.0034 |
0.0032 |
0.0033 |
Mean dust ingestion rates: infants 36 mg/day; toddlers 41 mg/day; children 32 mg/day; teenagers 2.2 mg/day; adults and seniors 2.6 mg/day.
COT
October 2022
Statement Number 04/22
References
Bates, B.; Collins, D.; Jones, K.; Page, P.; Roberts, C.; Steer, T.; Swan, G.(2020) National Diet and Nutrition Survey Results from years 9, 10 and 11 (combined) of the Rolling Programme (2016/2017 to 2018/2019)
Available at: National Diet and Nutrition Survey (publishing.service.gov.uk)
Bates, B.; Cox, L.; Nicholson, S.; Page, P.; Prentice, A.; Steer, T.; Swan, G. (2016) National Diet and Nutrition Survey Results from Years 5 and 6 (combined) of the Rolling Programme (2012/2013 – 2013/2014)
Available at: Main heading (publishing.service.gov.uk)
Bates, B.; Lennox, A.; Prentice, A.; Bates, C.; Page, P.; Nicholson, S.; Swan, G. (2014) National Diet and Nutrition Survey Results from Years 1, 2, 3 and 4 (combined) of the Rolling Programme (2008/2009 – 2011/2012) Available at: Main heading (publishing.service.gov.uk)
de la Torre A, Navarro I, Sanz P, de los Ángeles Mártinez M. (2019). Occurrence and human exposure assessment of perfluorinated
substances in house dust from three European countries. Science of the Total Environment. 685: 308-314.
DH (2013). Diet and Nutrition Survey of Infants and Young Children (DNSIYC), 2011.
Available at: Diet and nutrition survey of infants and young children, 2011 - GOV.UK (www.gov.uk)
Goosey E and Harrad S. (2011). Perfluoroalkyl compounds in dust from Asian, Australian, European, and North American homes and UK cars, classrooms, and offices. Environment International. 37: 86-92.
Harrad S, Wemken N, Drage DS, Abdallah MA-E and Coggins A-M. (2020). Perfluoroalkyl Substances in Drinking Water, Indoor Air and Dust from Ireland: Implications for Human Exposure. Environmental Science and Technology. 53, 22, 13449–13457.
Jogsten IE, Nadal M, van Bavel B, Lindström G and Domingo JL. (2012). Per- and polyfluorinated compounds (PFCs) in house dust and indoor air in Catalonia, Spain: Implications for human exposure. Environment International. 39: 172-180
Roberts, C.; Steer, T.; Maplethorpe, N.; Cox, L.; Meadows, S.; Page, P.; Nicholson, S.; Swan, G. (2018) National Diet and Nutrition Survey Results
from Years 7 and 8 (combined) of the Rolling Programme (2014/2015 – 2015/2016)
Available at: National Diet and Nutrition Survey (publishing.service.gov.uk)
U.S. EPA. (2011). Exposure Factors Handbook 2011 Edition (Final Report). U.S. Environmental Protection Agency, Washington, DC, EPA/600/R-09/052F, 2011.
Available at: Exposure Factors Handbook 2011 Edition (Final Report) | Science Inventory | US EPA
Annex D - Statement for use of the EFSA 2020 Opinion on the risks to human health related to the presence of perfluoroalkyl substances in food in UK risk assessments
In this guide
In this guideIndoor air exposures
1. A literature search was carried out for concentrations of PFASs in air. There were only 2 studies for which indoor air samples had been measured for one or more of PFOS, PFOA, PFHxS and/or PFNA in homes. Tables 1 to 4 show the study information and dust concentrations for PFOS and PFOA, PFHxS and PFNA, respectively. Data for the branched and linear isomers of chemicals were summed to provide a single value.
Table 1. Concentrations of PFOS in indoor air (pg/m3) in UK and EU studies where samples were taken in homes, after 2008.
|
Region, country |
Year of sampling |
No. of samples |
Mean LB-UB (pg/m3) (SEMa, SDb or 95% CIc) |
Median (pg/m3) |
Range (pg/m3) |
LODa LOQb (pg/m3) |
Detection frequency (%) |
Reference |
|
Kuopio, Finland |
2014- 2015 |
57 |
0.74 |
0.67 |
<LOD - 2.9 |
0.22a |
93 (>LOD) |
Winkens et al., 2017 |
|
Kuopio, Finland |
2014- 2016 |
57 |
1.3 |
1.2 |
<LOD - 5.0 |
0.47a |
88 (>LOD) |
Winkens et al., 2017 |
|
Kuopio, Finland (Sum of branched and linear PFOS) |
|
|
2 |
1.87 |
<LOD - 7.9 |
|
|
|
|
Birmingham UK |
2008 - 2009 |
20 |
38 |
11 |
< 1.0 - 400 |
1 |
90 |
Goosey and Harrad, 2012 |
Values are given to 2 significant figures. SEM – standard error of the mean; LB - lower bound assigns the value of zero to non-quantified data; UB - upper bound assigns the value of the LOD/LOQ to non-quantified data; SD – standard deviation; 95% CI – 95th percent confidence interval; LOD – limit of detection; LOQ – limit of quantification.
Table 2. Concentrations of PFOA in indoor air (pg/m3) in UK and EU studies where samples were taken in homes, after 2008.
|
Region, country |
Year of sampling |
No. of samples |
Mean LB-UB (pg/m3) (SEMa, SDb or 95% CIc) |
Median (pg/m3) |
Range (pg/m3) |
LODa LOQb (pg/m3) |
Detection frequency (%) |
Reference |
|
Kuopio, Finland |
2014- 2015 |
57 |
NC |
<LOD |
<LOD - 2.7 |
0.20a |
5 (>LOD) |
Winkens et al., 2017 |
|
Kuopio, Finland |
2014- 2015 |
57 |
21 |
15 |
<LOD - 100 |
4.5a |
98 (>LOD) |
Winkens et al., 2018 |
|
Sum of branched and linear |
n/a |
n/a |
21 |
15 |
<LOD - 100 |
n/a |
n/a |
n/a |
|
Birmingham UK |
2008 - 2009 |
20 |
52 |
24 |
<1.9 - 440 |
1.9 |
n/a |
Goosey et al., 2012 |
Values are given to 2 significant figures. SEM – standard error of the mean; LB - lower bound assigns the value of zero to non-quantified data; UB - upper bound assigns the value of the LOD/LOQ to non-quantified data; SD – standard deviation; 95% CI – 95th percent confidence interval; NC not calculated; LOD – limit of detection; LOQ – limit of quantification.
Table 3. Concentrations of PFHxS in indoor air (pg/m3) in UK and EU studies where samples were taken in homes, after 2008.
|
Region, country |
Year of sampling |
No. of samples |
Mean LB-UB (pg/m3) (SEMa, SDb or 95% CIc) |
Median (pg/m3) |
Range (pg/m3) |
LODa LOQb (pg/m3) |
Detection frequency (%) |
Reference |
|
Kuopio, Finland |
2014- 2015 |
57 |
NC |
<LOD |
<LOD - 0.3 |
0.25a |
2 (>LOD) |
Winkens et al., 2017 |
|
Kuopio, Finland |
2014- 2015 |
57 |
NC |
<LOD |
<LOD - 1.6 |
0.52a |
16 (>LOD) |
Winkens et al., 2018 |
|
Sum of branched and linear PFHxS |
n/a |
n/a |
NC |
<LOD |
<LOD - 1.9 |
n/a |
n/a |
n/a |
|
Birmingham UK |
n/a |
20 |
36 |
23 |
<1.1 - 220 |
1.1 |
n/a |
Goosey et al., 2012 |
Values are given to 2 significant figures. SEM – standard error of the mean; LB - lower bound assigns the value of zero to non-quantified data; UB - upper bound assigns the value of the LOD/LOQ to non-quantified data; SD – standard deviation; 95% CI – 95th percent confidence interval; NC not calculated; LOD – limit of detection; LOQ – limit of quantification.
Table 4. Concentrations of PFNA in indoor air (pg/m3) in UK and EU studies where samples were taken in homes, after 2008.
|
Region, country |
Year of sampling |
No. of samples |
Mean LB-UB (pg/m3) (SEMa, SDb or 95% CIc) |
Median (pg/m3) |
Range (pg/m3) |
LODa LOQb (pg/m3) |
Detection frequency (%) |
Reference |
|
Kuopio, Finland |
2014- 2015 |
57 |
3.1 |
2.4 |
0.95 - 17 |
0.57 |
100 (>LOD) |
Winkens et al., 2017 |
Values are given to 2 significant figures. SEM – standard error of the mean; LB - lower bound assigns the value of zero to non-quantified data; UB - upper bound assigns the value of the LOD/LOQ to non-quantified data; SD – standard deviation; 95% CI – 95th percent confidence interval; LOD – limit of detection; LOQ – limit of quantification.
2. The maximum values from the datasets for PFOS (400 pg/m3) and PFOA (440 pg/m3) are both from the study by Goosey and Harrad (2012) and are approximately 3 - 4-fold the next highest values for each of the chemicals. Using these values in the exposure calculation is a conservative approach.
3. The exposure estimates are based on concentrations derived as an average of the median (Table 5) or maximum (Table 6) values reported in the literature.
Table 5. Concentrations derived (ng/g) as an average of the median values reported in the literature.
|
Chemical |
Average of reported median values (pg/m3) |
References |
|
PFOS |
6.4 |
Goosey and Harrad, 2012; and Winkens et al., 2017 |
|
PFOA |
20 |
Goosey and Harrad, 2012; and Winkens et al., 2017 |
|
PFHxS |
12 |
Goosey and Harrad, 2012; and Winkens et al., 2017 |
|
PFNA |
2.4 |
Winkens et al., 2017 |
Concentrations are given to 2 sig. figs.
Table 6. Concentrations derived as an average of the maximum values reported in the literature.
|
Chemical |
Average of reported maximum values (ng/g) |
References |
|
PFOS |
200 |
Goosey and Harrad, 2012; and Winkens et al., 2017 |
|
PFOA |
270 |
Goosey and Harrad, 2012; and Winkens et al., 2017 |
|
PFHxS |
220 |
Goosey and Harrad, 2012; and Winkens et al., 2017 |
|
PFNA |
17 |
Winkens et al., 2017 |
Concentrations are given to 2 sig. figs.
4. Inhalation rates were taken from the EPA Exposure Factors Handbook (2011) Exposure Factors Handbook 2011 Edition (Final Report) | Science Inventory | US EPA. The number of age groups for which inhalation rates were provided was greater than the 6 population groups. The inhalation rates selected were those that covered much of the UK population group. Average bodyweights for the UK populations were calculated from NDNS (18 months – 95 years) and DNSIYC (4 – 18 months) data for different age groups. These are all shown in Table 7.
5. Exposures from inhalation were calculated for median and high concentrations of PFOS, PFOA, PFHxS and PFNA and mean inhalation rates, for each UK population group (Table 8).
Table 7. Dust ingestion rates and average UK bodyweights for UK population groups.
|
Population group |
Mean inhalation rates (m3/day) |
average UK bodyweight |
|
Infants |
3.4 |
7.8 |
|
Toddlers |
9.3 |
16 |
|
Children |
12 |
31 |
|
Teenagers |
17 |
63 |
|
Adults |
16 |
79 |
|
Seniors |
15 |
77 |
6. For the average median PFASs concentrations in indoor air in homes, the following ranges of exposures were calculated for all UK population groups for each of the compounds (Table 8):
- PFOS (6.4 pg/m3): 0.0085 – 0.027 ng/kg bw per week
- PFOA (20 pg/m3): 0.027 – 0.083 ng/kg bw per week
- PFHxS (12 pg/m3): 0.016 – 0.050 ng/kg bw per week
- PFNA (2.4 pg/m3): 0.0032 – 0.010 ng/kg bw per week
7. For the average maximum PFASs concentrations in indoor air in homes, the following ranges of exposures were calculated for all UK population groups for each of the compounds (Table 8):
- PFOS (200 pg/m3): 0.27 – 0.83 ng/kg bw per week
- PFOA (270 pg/m3): 0.36 – 1.1 ng/kg bw per week
- PFHxS (220 pg/m3): 0.29 – 0.91 ng/kg bw per week
- PFNA (17 pg/m3): 0.023 – 0.070 ng/kg bw per week
8. For all PFASs considered, toddlers had the highest exposures via inhalation and seniors had the lowest exposures.
Table 8. Estimated exposures for PFOS, PFOA, PFHxS and PFNA (ng/kg bw per week) from indoor air for UK population groups (mean inhalation rates (m3/day).
|
Exposure (ng/kg bw/week) |
Infants |
Toddlers |
Children |
Teenagers |
Adults |
Seniors |
|
PFOS 6.4 pg/m3 |
0.020 |
0.027 |
0.017 |
0.012 |
0.0093 |
0.0085 |
|
PFOS 200 pg/m3 |
0.61 |
0.83 |
0.53 |
0.38 |
0.29 |
0.27 |
|
PFOA 20 pg/m3 |
0.061 |
0.083 |
0.053 |
0.038 |
0.029 |
0.027 |
|
PFOA 270 pg/m3 |
0.83 |
1.1 |
0.71 |
0.51 |
0.39 |
0.36 |
|
PFHxS 12 pg/m3 |
0.037 |
0.050 |
0.032 |
0.023 |
0.017 |
0.016 |
|
PFHxS 220 pg/m3 |
0.68 |
0.91 |
0.58 |
0.42 |
0.32 |
0.29 |
|
PFNA 2.4 pg/m3 |
0.0074 |
0.010 |
0.0063 |
0.0046 |
0.0035 |
0.0032 |
|
PFNA 17 pg/m3 |
0.052 |
0.070 |
0.045 |
0.032 |
0.025 |
0.023 |
Mean inhalation rates: infants 3.4 m3/day; toddlers 9.3 m3/day; children 12 m3/day; teenagers 17 m3/day; adults 16 m3/day and seniors 15 m3/day.
COT
October 2022
Statement Number 04/22
References
Bates, B.; Collins, D.; Jones, K.; Page, P.; Roberts, C.; Steer, T.; Swan, G.(2020) National Diet and Nutrition Survey Results from years 9, 10 and 11 (combined) of the Rolling Programme (2016/2017 to 2018/2019)
Available at: National Diet and Nutrition Survey (publishing.service.gov.uk)
Bates, B.; Cox, L.; Nicholson, S.; Page, P.; Prentice, A.; Steer, T.; Swan, G. (2016) National Diet and Nutrition Survey Results from Years 5 and 6 (combined) of the Rolling Programme (2012/2013 – 2013/2014)
Available at: Main heading (publishing.service.gov.uk)
Bates, B.; Lennox, A.; Prentice, A.; Bates, C.; Page, P.; Nicholson, S.; Swan, G. (2014) National Diet and Nutrition Survey Results from Years 1, 2, 3 and 4 (combined) of the Rolling Programme (2008/2009 – 2011/2012)
Available at: Main heading (publishing.service.gov.uk)
DH (2013). Diet and Nutrition Survey of Infants and Young Children (DNSIYC), 2011.
Available at: Diet and nutrition survey of infants and young children, 2011 - GOV.UK (www.gov.uk)
Goosey E and Harrad S. (2012). Perfluoroalkyl substances in UK indoor and outdoor air: Spatial and seasonal variation, and implications for human exposure. Environment International. 45: 86-90.
Roberts, C.; Steer, T.; Maplethorpe, N.; Cox, L.; Meadows, S.; Page, P.; Nicholson, S.; Swan, G. (2018) National Diet and Nutrition Survey Results from Years 7 and 8 (combined) of the Rolling Programme (2014/2015 – 2015/2016)
Available at: National Diet and Nutrition Survey (publishing.service.gov.uk)
U.S. EPA. (2011). Exposure Factors Handbook 2011 Edition (Final Report). U.S. Environmental Protection Agency, Washington, DC, EPA/600/R-09/052F, 2011.
Available at: Exposure Factors Handbook 2011 Edition (Final Report) | Science Inventory | US EPA
Winkens K, Koponen J, Schuster J, Shoeib M, Vestergren R, Berger U, Karvonen AM, Pekkanen J, Kiviranta H and Cousins IT. (2017). Perfluoroalkyl acids and their precursors in indoor air sampled in children's bedrooms. Environmental Pollution. 222: 423-432.