Per- and polyfluoroalkyl substances: evaluation of thyroid effects using in vitro data - PFAS/2023/05
Introduction, Background and Literature Search
In this guide
In this guideThis is a paper for discussion. This does not represent the views of the Committee and should not be cited.
Introduction
1. This paper is part of a series of papers supporting the COT assessment of the toxicology of per- and polyfluoroalkyl substances (PFAS). It provides the evidence on thyroid toxicity based on in vitro toxicity studies.
2. A paper on evidence of thyroid toxicity based on in vivo animal toxicity studies is also presented at this meeting (PFAS/2023/04). Future papers will include human evidence of the effects on the thyroid, and groups of papers covering other endpoints including developmental toxicity, liver toxicity and immunotoxicity.
Background
3. The COT has previously considered PFAS on a number of occasions (see summary in TOX/2022/53), and has recently published a statement on the EFSA opinion. A paper summarising health-based guidance values (HBGV) was presented in December 2022 (TOX/2022/67) and following agreement in March 2023 the PFAS subgroup was established and an interim position published outlining future work.
Literature search
4. Search terms used previously by the European Food Safety Authority (EFSA) (2018 and 2020) were replicated. These search terms, the inclusion and exclusion criteria and the search results are presented in Annex B to this paper.
5. A total of 13 published papers were identified, some of which comprised more than one assay and involved more than one PFAS. All papers and reports were evaluated using the ToxRTool (Klimisch et al., 1997) to determine data quality and reliability. Nine studies were classified as K1 or K2 and hence were further evaluated and are included in the tables below. Four studies were classified as K3 and were not further evaluated, as agreed at the first subgroup meeting.
In vitro thyroid toxicity studies and Endpoints investigated
In this guide
In this guideThis is a paper for discussion. This does not represent the views of the Committee and should not be cited.
In vitro thyroid toxicity studies
6. For perfluorosulfonic acids (PFSAs), in vitro toxicity data are available for perfluorobutane sulfonic acid (PFBS), perfluorohexanesulfonic acid (PFHxS), perfluorodecane sulfonate (L-PFDS) and perfluorooctane sulfonic acid (PFOS) (Table 2 to Table 5).
7. For perfluoroalkane sulfinic acids (PFSIAs), data are available for perfluorooctane sulfinate (L-PFOSi) (Table 6).
8. For perfluoroalkyl carboxylic acids (PFCAs), data are available for perfluorobutanoic acid (PFBA), perfluoropentanoic acid (PFPeA), perfluorohexanoate (PFHxA), 7H-perfluoroheptanoic acid (7H-PFHpA), 2H-perfluoro-2-octenoicacid (6:2) (6:2 FTUA), perfluorooctanoic acid (PFOA), perfluorononanoic acid (PFNA), perfluorodecanoic acid (PFDA), perfluoroundecanoic acid (PFUnA), perfluorododecanoic acid (PFDoA), perfluorotridecanoic acid (PFTrDA), perfluorotetradecanoic acid (PFTeDA) (Table 7 to Table 19).
9. For perfluoroalkyl phosphonic acids (PFPAs), data are available for pentafluoropropionic anhydride (C6 PFPA) (Table 20).
10. For fluorotelomer alcohols (FTOH), data are available for 6:2 fluorotelomer alcohol (6:2 FTOH), 8:2 fluorotelomer alcohol (8:2 FTOH) and 10:2 fluorotelomer alcohol (10:2 FTOH) (Table 21).
11. For N-alkylperfluorooctane sulfonamidoethanols (FOSE), data are available for N-methyl perfluorooctane sulfonamide (N-MeFOSA), 2-(N-ethylperfluoro-1-octane sulfonamido) ethanol (N-EtFOSA), 2-(N-methylperfluoro-1-octane sulfonamido) ethanol (N-MeFOSE) and 2-(N-ethylperfluoro-1-octane sulfonamido) ethanol (N-EtFOSE) (Table 22).
12. For perfluorinated sulfonamides (FOSA), data are available for perfluorinated sulfonamide (PFOSA), N,N-dimethyl perfluorooctane sulfonamide (N,N-Me2FOSA) (Table 23).
13. For new generation PFAS, data are available for perfluoro{acetic acid, 2-[(5-methoxy-1,3-dioxolan-4-yl)oxy]}, ammonium salt (C6O4) and 6:2 chlorinated polyfluorinated ether sulfonate (F-53B) (Table 24).
14. Abbreviations used in Table 2 to Table 24 are not spelled out in the tables but are included in the abbreviations list. An overview of the PFAS chemical structure and molecular weight is presented in Annex C to this paper. Depending on the PFAS, studies have investigated the acid or anionic form.
Endpoints investigated
15. Multiple endpoints were investigated including competitive binding studies with thyroid hormone (TH) relevant proteins, aryl hydrocarbon receptor (AhR) function, effects on cell proliferation and viability, iodide accumulation, and gene expression.
16. Competitive binding assays (Ren et al., 2016; Weiss et al., 2009) investigated the ability of PFAS to bind with transport proteins (human transthyretin (TTR) or human thyroxine-binding globulin (TBG)), thereby displacing thyroid hormones (THs) from the transport proteins and decreasing levels of THs in the blood. Ren et al. (2016) used a direct fluorescent ligand binding assay with a fluorescence probe (fluorescein-thyroxine (FT4)) and Weiss et al. (2009) used radiolabelled 125I-labeled thyroxine (T4). The results from these studies enable an assessment of relative potency, relative to T4, of different PFAS.
17. AhR function was investigated by AhR transcriptional activity (AhR-tract), using the AhR-luciferase reporter gene bioassay and transfected mouse Hepa1.1 2cR cells (Long et al., 2013). The assay can detect compounds that can activate or inhibit the AhR, and therefore AhR-dependent gene expression. In the bioassay PFAS were tested alone or in co-treatment with 2,3,7,8 -tetrachlorodibenzo-p-dioxin (TCDD), which is one of the most studied AhR ligands.
18. Cell proliferation and viability were investigated in various studies, using cell lines that are under the influence of THs. Cell lines used included rat pituitary tumour (GH3) cells used in a T-screen assay, Fisher rat thyroid line-5 (FRTL-5) cells and Normal Human Thyroid (NHT) cells.
19. Iodide uptake by thyroid follicular cells is an early step in the synthesis of THs, with sodium iodide symporter (NIS) playing a critical role in this process. Two studies investigated the effect of PFAS on iodide uptake using FRTL5-YFP cells (a clonal population of FRTL-5 cells with stable expression of YFPH148Q/I152L used to monitor intracellular iodide) (Conti et al., 2020) and FRTL-5 cells (De Toni et al., 2022).
20. Increased intracellular cyclic adenosine monophosphate (cAMP) results from the binding of TSH to its membrane receptor and the activation of adenylyl cyclase. cAMP is the main mediator of the stimulating effect of thyroid stimulating hormone (TSH) on TH production, thyroid cell differentiation and growth, and events mediated by cAMP drive the expression of genes such as NIS and thyroperoxidase (TPO). Two studies (Croce et al., 2019; De Toni et al., 2022) investigated the effects of PFAS on cAMP production using FRTL-5 cells.
Summary of results
In this guide
In this guideThis is a paper for discussion. This does not represent the views of the Committee and should not be cited.
21. Table 2 to Table 24 present summaries of in vitro data for 29 different PFAS, taken from nine published sources.
22. Taken together, the endpoints investigated provide valuable information towards understanding the mechanisms by which PFAS may exert their effects on THs and thyroid function. An indication of the relative potency of individual PFAS in causing the observed effects is also available from in vitro studies where multiple PFAS were studied in the same test system (Table 1). Ren et al. (2016) stated that concentrations tested in such in vitro studies were generally relevant to the range of serum levels known to arise in the general population.
Competitive binding studies
23. Weiss et al. (2009) and Ren et al. (2016) investigated the displacement of the natural ligand thyroxine (T4) from key functional proteins, as well as TTR (Ren et al., 2016; Weiss et al., 2009) and TBG (Ren et al., 2016). These two authors investigated binding affinities of different PFSAs, including PFBS, PFHxS, PFOS, L-PFDS, and the PFSIA L-PFOSi.
24. Using a fluorescence probe in a fluorescein-thyroxine (F-T4) competitive binding assay, Ren et al. (2016) measured the binding affinities of PFBS, PFHxS and PFOS, which all bound to wild type human TTR with potency values (relative to T4) ranging from 0.24 (PFOS) to 0.0002 (PFBS). These potency values were similar to those obtained by Weiss et al. (2009) who studied the binding affinities of PFSAs and PFSIAs (i.e. PFBS, PFHxS, PFOS, L-PFDS and L-PFOSi) to TTR using a radioisotope method. No activity was detected for L-PFDS, and binding affinities for the other three PFSAs ranged from 0.065 (PFHxS) to 0.003 (PFBS). In contrast to Ren et al. (2016), where PFOS had the highest relative potency of 0.24, in the study by Weiss et al. (2009) PFHxS had the highest relative potency of 0.085, followed by PFOS at 0.065. No competitive binding affinity of the three PFSAs to human TBG was reported by Ren et al. (2016) (see Table 1).
25. For the PFCAs, Weiss et al. (2009) and Ren et al. (2016) measured binding affinities for the same nine chemicals to TTR (PFBA, PFHxA, PFHpA, PFOA, PFNA, PFDA, PFUnA, PFDoA, PFTeDA). In addition, Weiss et al. (2009) investigated 7H-PFHpA and 6:2FTUA, as well as N-MeFOSA, N-EtFOSA, PFOSA, N,N-Me2FOSE, N-MeFOSA and N-EtFOSE, while Ren et al. (2016) also investigated PFTrDA (see Table 1).
26. In both studies, all of the PFCAs displayed competitive binding activity to TTR, with the highest relative potencies (relative to T4), being for PFOA of 0.083 in the study by Ren et al. (2016) and 0.064 in the study by Weiss et al. (2009).
27. Of the PFAS studied, only two PFCAs (PFTrDA and PFTeDA) showed any affinity for binding to TBG, albeit both at a very low relative potency of 0.0002 (Ren et al., 2016).
28. For the four FOSE, none displayed competitive binding activity to TTR, and for the two FOSA only PFOSA (not N,N-Me2FOSA) displayed competitive binding to TTR.
29. Overall, binding affinities of PFAS to TTR were very much stronger than those of the same PFAS to TBG (Ren et al., 2016).
30. Ren et al. (2016) concluded that TTR binding potency was clearly associated with carbon chain length and the charged end group. Highest binding affinities to TTR were seen for PFAS with carbon chain lengths ranging from seven to 12 carbon atoms, and optimally at eight carbon atoms. They concluded this is due to the molecular sizes of long-chain perfluoroalkyl acids being larger than the volume of the T4 binding pocket. Potency was associated with the charged end group in the order of sulfonate > carboxylate > alcoholic hydroxyl.
31. In contrast, PFTrDA and PFTeDA, with an alkyl chain length longer than C12, bound to TBG with weak affinity (Ren et al., 2016). The authors concluded that this is because perfluoroalkyl acids with carbon chains longer than C12 could fill the TBG ligand-binding pocket, whereas the short-chain PFASs could not.
32. These competitive binding studies have shown that PFAS can displace T4 from serum transport proteins (primarily TTR) and so provide a possible explanation of the TT4 decrease seen in in vivo studies in the absence of increases in thyroid-stimulating hormone (TSH) (see paper PFAS/2023/04 – in vivo studies paper). Relative binding potencies compared to the natural ligands have also provided an insight into which PFAS may have the greatest adverse effect upon these processes. PFAS with alkyl chain ranging from seven to 12 carbon atoms and with a sulphonate end group (i.e. the PFSAs) appear to be most potent in this respect when considering binding to the TH transport protein, TTR.
33. The relative potency for competitive binding to TTR, relative to T4, from the studies by Ren et al. (2016) and Weiss et al. (2009) are presented in Table 1 in descending order.
Table's 1 Relative potencies of PFAS, relative to T4, from competitive binding assays with TTR.
|
PFAS |
Relative potency (Ren et al., 2016) |
|
PFOS |
0.24 |
|
PFOA |
0.083 |
|
PFHxS |
0.053 |
|
PFHpA |
0.028 |
|
PFDA |
0.019 |
|
PFNA |
0.016 |
|
PFHxA |
0.009 |
|
PDUnA |
0.006 |
|
PFTrDA |
0.006 |
|
PFTeDA |
0.005 |
|
PFDoA |
0.004 |
|
PFBS |
0.002 |
|
PFBA |
0.0003 |
|
6:2 FTOH |
ND |
|
8:2 FTOH |
ND |
|
10:2 FTOH |
ND |
|
PFAS |
Relative potency (Weiss et al., 2009) |
|
PFHxS |
0.085 |
|
PFOS |
0.065 |
|
PFOA |
0.064 |
|
PFHpA |
0.039 |
|
L-PFOSi |
0.035 |
|
PFNA |
0.022 |
|
FOSA |
0.01 |
|
PFHxA |
0.007 |
|
PFDA |
0.007 |
|
7H-PFHpA |
0.007 |
|
6:2 FTUA |
0.007 |
|
PFUnA |
0.003 |
|
PFBS |
0.003 |
|
PFTdA |
0.002 |
|
PFDoA |
0.001 |
|
PFBA |
ND |
|
L-PFDS |
ND |
|
6:2 FTOH |
ND |
|
8:2 FTOH |
ND |
|
N-MeFOSE |
ND |
|
N-EtFOSE |
ND |
|
N,N-Me2FOSA |
ND |
|
N-MeFOSA |
ND |
|
N-EtFOSA |
ND |
AhR transactivation (TCDD comparison)
34. The effect of seven PFAS (PFOS, PFHxS, PFOA, PFNA, PFDA, PFUnA and PFDoA) on AhR transactivation in the AhR luciferase reporter gene bioassay was investigated by Long et al. (2013), using stably transfected mouse Hepa1.12cR cells (AhR-tact bioassay).
35. PFAS were tested alone (agonistic response) or co-treated with TCDD (competitive response). Compared to TCDD, only PFDoA weakly induced the AhR-tact in an agonistic response with a tentative AhR-relative potency of 5 x 10⁻⁶; the other PFAS had no significant effect. In the presence of TCDD, only PFDA and PFDoA further increased the TCDD-induced AhR-tact in an antagonistic response. PFDA and PFDoA have 10 and 12 carbon atoms, respectively, and therefore may have a different toxic effect than the shorter PFOS and PFOA. Long et al. (2013) concluded that the two long chain PFAS studied interfered with AhR function and this may be one mechanism by which PFAS affect the endocrine system via interference with nuclear receptor pathways.
36. The results indicate, based on the five long-chain PFCAs and two long-chain PFSAs studied, that only the longer chain PFAS with alkyl chains of 10 to 12 carbon atoms appear to have the ability to interact with AhR and influence gene expression profiles of key factors involved in thyroid function.
Cell proliferation and cell viability studies
37. A number of studies have investigated the potential proliferative effects of PFAS on cell lines that are under the influence of THs, including GH3 cells (T-screen assay), FRTL-5 cells and NHT cells.
38. The T-screen assay employs the GH3 cell line in which cell growth is totally dependent on the active thyroid hormone triiodothyronine (T3), which, on interacting with various TH responsive elements, ultimately leads to gene expression and cell growth. Conflicting results on cell proliferation were found in the studies reviewed.
39. Long et al. (2013) studied the effect of seven PFAS (PFOS, PFHxS, PFOA, PFNA, PFDA, PFUnA and PFDoA ) on GH3 cell proliferation in the absence (agonistic response) or presence (antagonistic response) of T3.
40. In the absence of T3, all seven PFAS significantly decreased GH3 cell proliferation, with PFOS, PFHxS, PFNA, PFDA and PFUnA decreasing such cell proliferation in a dose-dependent manner. No dose-response was seen with PFOA and PFDoA. Cytotoxicity was seen at the highest dose tested (1 x 10⁵ nM) with PFUnA and PFDoA.
41. In the presence of T3, apart from PFOA where no significant effect on cell proliferation was reported, all six other PFAS significantly decreased T3-induced cell proliferation. Cytotoxicity was seen at the highest dose tested (1 x 10⁵ nM) with PFUnA and PFDoA.
42. Deng et al. (2018) showed that a PFOS substitute, F-53B (described as a Chinese PFOS alternative with a similar structure), enhances proliferation of GH3 cells in a concentration-dependent manner, with a higher relative cell proliferation than T3. Cytotoxicity was not assessed. The authors concluded that F-53B may be considered a strong TH agonist.
43. Coperchini et al. (2021) evaluated the effect of in vitro exposure to PFOS and PFOA in both a thyroid cell proliferation assay and cell viability (WST-1) assay using FRTL-5 and NHT cells. Cell death was seen following exposure to PFOS in FRTL-5 and NHT cells, but only in FRTL-5 cells following exposure to PFOA.
44. In this study, FRTL-5 cells cultured in the presence of PFOS up to 2 x10² nM displayed a decrease in cell viability from 2 x 101 nM (10 ng/mL) and a decrease in cell proliferation from 2 nM (1 ng/mL). In the presence of PFOA, cells displayed a decrease in cell viability from 2.41 x101 nM (10 ng/mL) and a decrease in cell proliferation from 2.41 nM (1 ng/mL).
45. NHT cells cultured with PFOS showed a decrease in cell viability from 2 x 10⁻² nM (0.01 ng/mL) and a decrease in cell proliferation from 2 nM (1 ng/mL). PFOA had no effect on cell viability or cell proliferation. 46. In the same study, a new generation PFAS (C6O4) was also tested in FRTL-5 and NHT cells. Treatment with C6O4 did not affect FRTL-5 or NHT cell viability or proliferation, in contrast to both PFOA and PFOS which reduced cell viability and cell proliferation in FRTL-5 cells, but only PFOA reduced cell viability and cell proliferation in NHT cells. The concentrations of PFAS used in these experiments were stated to be based on human serum data previously reported.
47. Evidence from in vitro studies shows that PFAS can decrease cell viability and cell proliferation, although this is not consistently seen across different cell types with the same PFAS.
Iodide accumulation and metabolism
48. Conti et al. (2020) evaluated the acute effects of PFOS and PFOA on iodide transport in FRTL5-YFP cells (a clonal population of FRTL-5 cells with stable expression of YFPH148Q/I152L) and human HEK-293 cells transiently expressing NIS, by monitoring changes in intracellular iodide concentration using live cell imaging. No cytotoxicity was reported up to the highest dose tested of 1 x 10⁵ nM (FRTL-5 cells) for PFOS or PFOA. PFOS, but not PFOA, acutely and reversibly inhibited iodide accumulation in FRTL5-YFP cells and HEK-293 cells. PFOS did not affect iodide efflux from thyroid cells nor the activation of efflux channels/transporters. However, the authors noted that effects occurred at PFOS concentrations that the general population are unlikely to be exposed to.
49. De Toni et al. (2022) investigated the effect of PFOA, PFOS and C6O4 on cell iodide-uptake induced by TSH in FRTL-5 cells. No cytotoxicity was reported up to the highest dose tested of 2 x 10² nM or 2.41 x 10² nM for PFOS and PFOA, respectively. Following exposure to PFOS and in the absence of TSH stimulation, no effect on basal iodide uptake was reported. However, following exposure to PFOA in the absence of TSH, a decrease in basal iodide uptake was seen. For both PFAS, an increase in iodide update was seen following TSH stimulation.
50. Therefore, in contrast to effects reported by Conti et al. (2020) using FRTL5-YFP cells in the absence of TSH stimulation, PFOA, but not PFOS, was associated with significant impairment of iodide uptake in FRTL-5 cells. It is noted that the dose at which effects were seen with PFOS (Conti et al., 2020) were above the highest dose tested in the study by De Toni et al. (2022), although a lower dose of PFOA in the study by De Toni et al. (2022) did show an effect. In addition, a clonal population of FRTL-5 cells (FRTL5-YFP) was used in the study by Conti et al. (2020), whereas unmodified FRTL-5 cells were used in the study by De Toni et al. (2022). C6O4 was only associated with an increase in iodide update following TSH stimulation.
51. Disruption of iodide homeostasis in thyroid cells may be a one of the potential mechanisms for the anti-thyroid effects of some PFAS (Conti et al., 2020).
cAMP production and gene expression
52. Croce et al. (2019) assessed whether PFBS, PFOS, PFBA, C6 PFPA, PFPeA and PFOA interfered with endocrine function by inhibiting the TSH-induced production of cAMP in FRTL-5 cells. No cytotoxicity was reported in FRTL-5 cells for PFBS, PFBA, C6 PFPA, PFPeA and PFOA, up to the highest dose tested of 1 x 10⁵ nM, with only PFOS being cytotoxic at high concentrations (from 1 x 10⁵ nM), in a dose dependent manner. None of the six PFAS exerted a significant inhibition of TSH-induced cAMP production in FRTL-5 cells up to the highest doses tested (1 x 10⁵ nM). The authors stated that the lower concentrations used were comparable to the concentration range found in sera of the general population and exposed workers, but the highest concentrations tested were higher than those ever reported in human sera.
53. De Toni et al. (2022) investigated the impact of PFOS, PFOA and C6O4 on intracellular cAMP levels induced by TSH. No cytotoxicity was reported up to the highest dose tested of 2 x 10², 2.41 x 10² or 2.9 x 10² nM for PFOS, PFOA and C6O4, respectively. TSH-stimulated FRTL-5 cells exposed for 24 hours to C6O4 or PFOS showed a significant decrease of intracellular cAMP levels but only at the highest concentration tested, whereas PFOA was associated with a dose-related decrease of intracellular cAMP levels at all concentrations tested.
54. As subsequent events mediated by cAMP drive the expression of downstream genes such as NIS and TPO, the effect of PFAS exposure on expression of these genes was also investigated. Exposure to PFOA, in spite of having no effect on TSH-receptor gene expression, was associated with a significant reduction in both NIS and TPO gene expression upon TSH stimulation, but neither C6O4 or PFOS exerted any major alteration of the gene pattern.
55. There is variation in the ability of different PFAS to affect cell function in FRTL-5 cells, as shown with PFOS and PFOA in the studies by De Toni et al. (2022) and Croce et al. (2019) above. No effect on cAMP production was reported for PFOS and PFOA in the study by Croce et al. (2019), although exposure to both PFAS resulted in a decrease in cAMP levels at lower concentrations in the study by De Toni et al. (2022).
Discussion
In this guide
In this guideThis is a paper for discussion. This does not represent the views of the Committee and should not be cited.
56. Competitive binding studies show that PFAS can compete with T4 for binding to serum transport proteins and so disturb TH homeostasis, with binding affinities to TTR stronger than to TBG. Binding affinity to TTR is associated with PFAS carbon chain length and the charged end group.
57. Results from the study by Long et al. (2013) indicated that only the longer chain PFAS with alkyl chains of 10 to 12 carbon atoms appear to have the ability to interact with AhR and influence gene expression profiles of key factors involved in thyroid function.
58. Evidence from cell proliferation and cell viability studies show that PFAS can decrease both, although this is not consistently seen across different cell types (rat or human cells) with the same PFAS.
59. Disruption of iodide homeostasis in thyroid cells may be a one of the potential mechanisms for the thyroid-disrupting effects of some PFAS, but this was not seen consistently across the PFAS studied.
60. Decreases in cAMP production was also not seen consistently across the PFAS studied.
61. A deeper understanding as to which PFAS may present greater impacts upon the thyroid and why PFAS may differ in their ability to bind to critical targets involved in the regulation of thyroid function may be gained from relative potency estimates seen in the studies by Ren et al. (2016) and Weiss et al. (2009), supported by molecular docking simulations (not presented in this paper). PFOS, PFHxS and PFOA displayed the highest relative potencies in these studies, although depending on the study the most potent of these three PFAS varied.
62. In vitro studies on new generation PFAS (C6O4 and F-53B) are presented, comprising different test models and endpoints. C6O4 is reported to have no effect on FRTL-5 or NHT cell viability or apoptosis (Coperchini et al., 2021) and to increase iodide uptake in cells following TSH stimulation and decrease intracellular cAMP levels, with no effect on NIS and TPO gene expression (De Toni et al., 2022). The study by Deng et al. (2018), on F-53B demonstrated that F-53B is a strong TH agonist.
63. Taken together, the in vitro evidence reviewed for various PFSAs and PFCAs, and new generation PFAS, shows that in vitro exposure of thyroid cells (rat or human) and of thyroid relevant proteins can have various thyroid-disrupting effects. These are not always consistent, but do, in some cases, support the findings on thyroid function displayed in in vivo studies where consistent decreases in THs are seen.
Questions on which the views of the Committee are sought
64. Members are invited to consider the following questions:
i) Are there any specific papers that the subgroup would like to review in more detail?
IEH Consulting under contract supporting the UKHSA COT Secretariat
December 2023
List of Abbreviations
In this guide
In this guideThis is a paper for discussion. This does not represent the views of the Committee and should not be cited.
|
6:2 FTOH |
6:2 Fluorotelomer alcohol |
|
6:2 FTUA |
2H-Perfluoro-2-octenoic acid (6:2) |
|
7H PFHpA |
7H-Perfluoroheptanoic acid |
|
8:2 FTOH |
8:2 Fluorotelomer alcohol |
|
10:2 FTOH |
10:2 Fluorotelomer alcohol |
|
AhR |
Aryl hydrocarbon receptor |
|
AhR-REP |
AhR-mediated relative potency |
|
AhR-tact |
AhR transactivity |
|
C6O4 |
Perfluoro{acetic acid, 2-[(5-methoxy-1,3-dioxolan-4-yl) oxy]}, ammonium salt |
|
C6 PFPA |
Pentafluoropropionic anhydride |
|
cAMP |
Cyclic adenosine monophosphate |
|
CAS |
Chemical abstract service |
|
COT |
Committee on Toxicity of Chemicals in Food, Consumer Products and the Environment |
|
DMSO |
Dimethyl sulfoxide |
|
EFSA |
European Food Safety Authority |
|
EtOH |
Ethyl alcohol |
|
EU |
European Union |
|
F-53B |
6:2 chlorinated polyfluorinated ether sulfonate |
|
FOSA |
Perfluorinated sulfonamide |
|
FOSE |
N-alkylperfluorooctane sulfonamidoethanols |
|
FRTL |
Fischer rat thyroid cell line |
|
F-T4 |
Fluorescein-thyroxine |
|
FTOH |
Fluorotelomer alcohol |
|
GL |
Guideline |
|
GLP |
Good laboratory practice |
|
HBGV |
Health-based guidance value |
|
HEK |
Human Embryonic Kidney |
|
IC50 |
Inhibitory concentration 50% |
|
LDH |
Lactate dehydrogenase |
|
LOEC |
Lowest observed effect concentration |
|
L-PFDS |
Perfluorodecane sulfonate |
|
L-PFOSi |
Perfluorooctane sulfinate |
|
MC540 |
Merocyanine 540 |
|
MOEC |
Maximum observed effect concentration |
|
NA |
Not applicable |
|
ND |
Not detected |
|
N-EtFOSA |
2-(N-ethylperfluoro-1-octane sulfonamido) ethanol |
|
N-EtFOSE |
2-(N-ethylperfluoro-1-octane sulfonamido) ethanol |
|
NHT |
Normal Human Thyroid |
|
NIS |
Sodium/iodide symporter |
|
N-MeFOSA |
N-methyl perfluorooctane sulfonamide |
|
N-MeFOSE |
2-(N-methylperfluoro-1-octane sulfonamido) ethanol |
|
N,N-Me2FOSA |
N,N-dimethyl perfluorooctane sulfonamide |
|
PFAS |
Per- and polyfluoroalkyl substances |
|
PFBA |
Perfluorobutanoate / Perfluorobutanoic acid |
|
PFBS |
Perfluorobutane sulfonate / Perfluorobutane sulfonic acid |
|
PFCs |
Poly- and perfluorinated compounds |
|
PFCA |
Perfluoroalkyl carboxylic acids |
|
PFDA |
Perfluorodecanoate / Perfluorodecanoic acid |
|
PFDoA |
Perfluorododecanoic acid |
|
PFHpA |
Perfluoroheptanoate / Perfluoroheptanoic acid |
|
PFHxA |
Perfluorohexanoate / Perfluorohexanoic acid |
|
PFHxDA |
Perfluorohexadecanoic acid |
|
PFHxS |
Perfluorohexane sulfonate |
|
PFNA |
Perfluorononanoate / Perfluorononanoic acid |
|
PFOA |
Perfluorooctanoate / Perfluorooctanoic acid |
|
PFOS |
Perfluorooctane sulfonate / Perfluorooctane sulfonic acid |
|
PFOSA |
Perfluorooctane sulfonamide |
|
PFOSi |
Perfluorooctane sulfinic acid |
|
PFPA |
Perfluoroalkyl phosphonic acids |
|
PFPeA |
Perfluoropentanoate / Perfluoropentanoic acid |
|
PFSA |
Perfluorosulfonic acids |
|
PFSIA |
Perfluoroalkane sulfinic acid |
|
PFTrDA |
Perfluorotridecanoate /Perfluorotridecanoic acid |
|
PFTeDA |
Perfluorotetradecanoate / Perfluorotetradecanoic acid |
|
PFUnA |
Perfluoroundecanoate / Perfluoroundecanoic acid |
|
PPAR |
Proliferator-activated receptor |
|
RNA |
Ribonucleic acid |
|
ROS |
Reactive oxygen species |
|
RP |
Relative potency |
|
T3 |
Triiodothyronine |
|
T4 |
Thyroxine |
|
TBG |
Thyroxine-binding globulin |
|
TCDD |
2,3,7,8 -Tetrachlorodibenzo-p-dioxin |
|
TH |
Thyroid hormone |
|
TPO |
Thyroperoxidase |
|
TR |
Thyroid hormone receptor |
|
TSH |
Thyroid stimulating hormone |
|
TSH-R |
Thyroid stimulating hormone receptor |
|
TTR |
Transthyretin (thyroid hormone transport protein) |
|
US EPA |
United States Environmental Protection Agency |
|
WT |
Wild type |
References - PFAS/2023/05
In this guide
In this guideThis is a paper for discussion. This does not represent the views of the Committee and should not be cited.
Conti, A., Strazzeri, C., & Rhoden, K. J. (2020). Perfluorooctane sulfonic acid, a persistent organic pollutant, inhibits iodide accumulation by thyroid follicular cells in vitro [Article]. Molecular and Cellular Endocrinology, 515, Article 110922. https://doi.org/10.1016/j.mce.2020.110922
Coperchini, F., Croce, L., Pignatti, P., Ricci, G., Gangemi, D., Magri, F., Imbriani, M., Rotondi, M., & Chiovato, L. (2021). The new generation PFAS C6O4 does not produce adverse effects on thyroid cells in vitro [Article]. Journal of Endocrinological Investigation, 44(8), 1625-1635. https://doi.org/10.1007/s40618-020-01466-4
Coperchini, F., Pignatti, P., Lacerenza, S., Negri, S., Sideri, R., Testoni, C., de Martinis, L., Cottica, D., Magri, F., Imbriani, M., Rotondi, M., & Chiovato, L. (2015). Exposure to perfluorinated compounds: in vitro study on thyroid cells [Article]. Environmental Science and Pollution Research, 22(3), 2287-2294. https://doi.org/10.1007/s11356-014-3480-9
Croce, L., Coperchini, F., Tonacchera, M., Imbriani, M., Rotondi, M., & Chiovato, L. (2019). Effect of long- and short-chain perfluorinated compounds on cultured thyroid cells viability and response to TSH [Article]. Journal of Endocrinological Investigation, 42(11), 1329-1335. https://doi.org/10.1007/s40618-019-01062-1
De Toni, L., Di Nisio, A., Rocca, M. S., Pedrucci, F., Garolla, A., Dall'Acqua, S., Guidolin, D., Ferlin, A., & Foresta, C. (2022). Comparative Evaluation of the Effects of Legacy and New Generation Perfluoralkyl Substances (PFAS) on Thyroid Cells In Vitro. Front Endocrinol (Lausanne), 13, 915096. https://doi.org/10.3389/fendo.2022.915096
Deng, M., Wu, Y., Xu, C., Jin, Y., He, X., Wan, J., Yu, X., Rao, H., & Tu, W. (2018). Multiple approaches to assess the effects of F-53B, a Chinese PFOS alternative, on thyroid endocrine disruption at environmentally relevant concentrations [Article]. Science of the Total Environment, 624, 215-224. https://doi.org/10.1016/j.scitotenv.2017.12.101
EFSA. (2018). Risk to human health related to the presence of perfluorooctane sulfonic acid and perfluorooctanoic acid in food. EFSA Journal, 16(12), 5194. https://doi.org/https://doi.org/10.2903/j.efsa.2018.5194
EFSA. (2020). Risk to human health related to the presence of perfluoroalkyl substances in food. EFSA Journal, 18(9), 6223. https://doi.org/https://doi.org/10.2903/j.efsa.2020.6223
Klimisch, H. J., Andreae, M., & Tillmann, U. (1997). A systematic approach for evaluating the quality of experimental toxicological and ecotoxicological data. Regul Toxicol Pharmacol, 25(1), 1-5. https://doi.org/10.1006/rtph.1996.1076
Long, M., Ghisari, M., & Bonefeld-Jørgensen, E. C. (2013). Effects of perfluoroalkyl acids on the function of the thyroid hormone and the aryl hydrocarbon receptor [Article]. Environmental Science and Pollution Research, 20(11), 8045-8056. https://doi.org/10.1007/s11356-013-1628-7
Ren, X. M., Qin, W. P., Cao, L. Y., Zhang, J., Yang, Y., Wan, B., & Guo, L. H. (2016). Binding interactions of perfluoroalkyl substances with thyroid hormone transport proteins and potential toxicological implications [Article]. Toxicology, 366-367, 32-42. https://doi.org/10.1016/j.tox.2016.08.011
Weiss, J. M., Andersson, P. L., Lamoree, M. H., Leonards, P. E., van Leeuwen, S. P., & Hamers, T. (2009). Competitive binding of poly- and perfluorinated compounds to the thyroid hormone transport protein transthyretin. Toxicol Sci, 109(2), 206-216. https://doi.org/10.1093/toxsci/kfp055
Annex A Tables 2 to 13
In this guide
In this guideThis is a paper for discussion. This does not represent the views of the Committee and should not be cited.
Table 2 In vitro toxicity studies for PFSAs – PFBS
|
Substance / CAS no. / purity / reference |
Test model / replicates / Guideline (GL) study / Good Laboratory Practice (GLP) status |
Conc. (nM) / duration |
Negative ctrl / positive ctrl Cytotoxicity |
Endpoints |
Results |
Study author conclusions |
Comments |
|
PFBS CAS No. not given. Purity not given. Croce et al. (2019). |
WST-1 assay: FRTL-5 cells. 2 x 10⁴ cells/well (96 well plate). 3 expts. No. of replicates not given. cAMP assay: No. cells not given (80% confluence). 3 expts. No. of replicates not given. Non-GL study. GLP not stated. |
0, 1 x 10⁻¹, 1, 1 x 101, 1 x 10², 1 x 10³ or 1 x 10⁵. 24 hr.
|
6H medium. 1 mU/L TSH (cAMP assay). WST-1 assay. Not cytotoxic (data only reported in figures) up to 1 x 10⁵ nM. |
Thyroid cell viability. TSH-stimulated cAMP production. |
No effect on inhibition of TSH-induced. cAMP production in FRTL-5 cells (data only reported in figures). |
cAMP production is not modulated by PFBS. The study excludes an interference with the TSH-dependent control of thyroid function as a mechanism by which PFBS would interfere with thyroid function. |
K2 Aim of the study was to investigate whether PFBS could affect thyroid cell viability and/or interfere with the functional effect of TSH by investigating TSH-induced cAMP production in FRTL-5 cells. Number of replicates not given. Purity not given. No details of funding given. Authors declare no conflict of interest.
|
|
PFBS CAS No. not given. Purity not given. Ren et al. (2016). |
Human WT TTR. 50 nM. Human mutant TTRmutK15G. 500 nM. 3 expt. in triplicate. Non-GL study. GLP not stated. |
Human WT and TTRmutK15G. 1 – 1 x 10⁶ (estimated from figures). 5 minutes.
|
Competitive binding assay: NA. 50 nM F-T4. Cytotoxicity NA.
|
Binding potency to TTR. |
WT TTR. IC50 = 1.33 x 10⁴ nM. RP = 0.002 relative to T4. TTRmutK15G No observed effect.
|
Binding affinities of TTR to PFAS were much stronger than those of TBG to the same PFAS. PFAS might bind to TTR but not TBG when ingested and enter the blood stream. Displacement of T4 from TTR may be a concern for workers occupationally exposed to PFAS but not for the general population. |
K1 Aim of the study was to investigate the binding affinities of PFAS with human TH transport proteins TTR and TBG (see below). Purity not given. Funded by the Chinese Academy of Sciences and the National Natural Science Foundation of China. Authors declared no conflicts of interest. |
|
PFBS CAS No. not given. Purity not given. Ren et al. (2016) |
Human WT TBG. 50 nM. Human mutant TBGmutR378G. 1000 nM. Human mutant. TBGmutR381G. 1000 nM. 3 expt. in triplicate. Non-GL study. GLP not stated. |
Human WT TBG, TBGmutR378G and TBGmutR381G. 1 – 1 x 10⁶ (estimated from figures). 5 minutes.
|
NA. 50 nM F-T4. Cytotoxicity NA.
|
Binding potency to TBG. |
WT TBG. No observed effect. TBGmutR378G. No observed effect. TBGmutR381G. No observed effect.
|
Binding affinities of TTR to PFAS were much stronger than those of TBG to the same PFAS. PFAS might bind to TTR but not TBG when ingested and enter the blood stream.. |
K1 Aim of the study was to investigate the binding affinities of PFAS with human TH transport proteins TTR and TBG. Purity not given. Funded by the Chinese Academy of Sciences and the National Natural Science Foundation of China. Authors declared no conflicts of interest. |
|
PFBS CAS No. 2795-39-3. Purity not given. Weiss et al. (2009) |
TTR. 30nM. No. of expts and replicates not given. Non-GL study. GLP not stated. |
1 x 10⁻¹ – 1 x 10⁵ Overnight. |
NA. T4. Cytotoxicity NA. |
T4-TTR-binding. |
IC50 = 1.94 x 10⁴ nM. RP = 0.003 relative to T4. |
Competitive binding of PFCs to TTR, as observed for human TTR in the present study with certain PFAS, may explain altered TH levels described for PFC-exposed rats and monkeys. |
K2 Aim of the study was to investigate if PFAS compete with T4 for binding to TTR. Number of replicates and experiments not given. CAS No. given is for potassium perfluorooctanesulfonate, not perfluorobutane sulfonate which is the name given in the study. Study funded by EU-supported program MODELKEY and the Marie Curie Research Training Network KEYBIOEFFECTS. |
Table 3 In vitro toxicity studies for PFSAs - PFHxS
|
Substance / CAS no. / purity / reference |
Test model / replicates / GL study / GLP status |
Conc. (nM) / duration |
Negative ctrl / positive ctrl Cytotoxicity |
Endpoints |
Results |
Study author conclusions |
Comments |
|
PFHxS CAS No. 355-46-4. 98%. Long et al. (2013). |
GH3 cells. 3 x 10³ cells/well (96 well plate). 3 expts. in quadruplicate. Non-GL study. GLP not stated. |
1 - 1 x 10⁵. 6 days. |
0.02% DMSO. 0.5 nM T3. LDH. Cytotoxic at > 1 x 10⁶ nM. |
Thyroid hormone-dependent cell growth (T-screen assay). |
Without T3 (agonistic response). ↓ cell proliferation. LOEC = 1 nM. REP at MOEC = -4.03% relative to T3. With T3 (competitive response). ↓ T3-induced cell proliferation. LOEC = 10 nM REP at MOEC = -1.49/1.80% relative to T3. |
PFHxS has the potential to inhibit the function of the TH system. |
K2 Aim of the study was to assess the potential impacts of seven PFAS on TH activity using the rat pituitary tumour cell line GH3 expressing intracellular TR and responding to physiological concentration of TH by proliferation (named as T-screen). T-screen assay exposure duration 6 days. Study funded by the Danish Strategic Research Council and Aarhus University. |
|
PFHxS CAS No. 355-46-4. 98%. Long et al. (2013). |
Hepa1.12cR cells. 6 × 10⁴ cells/per well. 2 expts. in triplicate. Non-GL study. GLP not stated. |
1 - 1 x 10⁵ 4 hr. |
0.02% DMSO. 60 pM TCDD. LDH. Cytotoxic at > 1 x 10⁶ nM. |
Activation / inhibition of AhR. (AhR transcriptional activation bioassay). |
Without TCDD (agonistic response). ↓ in AhR-tact LOEC = 1 x 10⁵ nM. AhR-REP No effect. With TCDD (competitive response). No observed effect.
|
No obvious cytotoxicity at 1 x 10⁻⁴ M measured in LDH assay. The higher concentration. (1 x 10⁶ nM) of PFHxS elicited cytotoxicity in the cells. Thus, the decreased AhR-tact of PFHxS might be related to the starting of cytotoxicity. |
K1 Aim of the study was to assess the potential impacts of seven PFAS on AhR function. The AhR transcriptional activity was determined by AhR-luciferase reporter gene bioassay using the stably transfected mouse Hepa1.1 2cR cell. Study funded by the Danish Strategic Research Council and Aarhus University. |
|
PFHxS CAS No. not given. Purity not given. Ren et al. (2016). |
Human WT TTR 50 nM. Human mutant TTRmutK15G. 500 nM. 3 expts. in triplicate. Non-GL study. GLP not stated. |
Human WT and mutant TTRmutK15G. 1 – 1 x 10⁶ (estimated from figures). 5 minutes.
|
Competitive binding assay: NA. 50 nM F-T4. Cytotoxicity NA.
|
Binding potency to TTR. |
WT TTR IC50 = 5.94 x 10² nM. RP = 0.053 relative to T4. TTRmutK15G. No observed effect.
|
Binding affinities of TTR to PFAS were much stronger than those of TBG to the same PFAS. PFAS might bind to TTR but not TBG when ingested and enter the blood stream. Displacement of T4 from TTR may be a concern for workers occupationally exposed to PFAS but not for the general population. |
K1 Aim of the study was to investigate the binding affinities of PFAS with human TH transport proteins TTR and TBG. Purity not given. Funded by the Chinese Academy of Sciences and the National Natural Science Foundation of China. Authors declared no conflicts of interest. |
|
PFHxS CAS No. not given. Purity not given. Ren et al. (2016) |
Human WT TBG. 50 nM. Human mutant TBGmutR378G. 1000 nM. Human mutant. TBGmutR381G. 1000 nM. 3 expts. in triplicate. Non-GL study. GLP not stated. |
Human WT TBG, mutant TBGmutR378G and mutant. TBGmutR381G. 1 – 1 x 10⁶ (estimated from figures). 5 minutes.
|
NA. 50 nM F-T4. Cytotoxicity NA.
|
Binding potency to TBG. |
WT TBG. No observed effect. TBGmutR378G. No observed effect. TBGmutR381G. No observed effect.
|
Binding affinities of TTR to PFAS were much stronger than those of TBG to the same PFAS. PFAS might bind to TTR but not TBG when ingested and enter the blood stream. |
K1 Aim of the study was to investigate the binding affinities of PFAS with human TH transport proteins TTR and TBG. Purity not given. Funded by the Chinese Academy of Sciences and the National Natural Science Foundation of China. Authors declared no conflicts of interest. |
|
PFHxS CAS No. 3871-99-6. ≥98%. Weiss et al. (2009). |
TTR. 30nM. No. of expts. and replicates not given. Non-GL study. GLP not stated. |
1 x 101 – 1 x 10⁴ Overnight. |
NA. T4. Cytotoxicity NA. |
T4-TTR-binding. |
IC50 = 7.17 x 10² nM. RP = 0.085 relative to T4. |
Competitive binding of PFCs to TTR, as observed for human TTR in the present study with certain PFAS, may explain altered TH levels described for PFC-exposed rats and monkeys. |
K2 Aim of the study was to investigate if PFAS compete with T4 for binding to TTR. Of the 24 PFAS studied, PFHxS had the highest potency, relative to T4. Number of experiments and replicates and not given. Study funded by EU-supported program MODELKEY and the Marie Curie Research Training Network KEYBIOEFFECTS. |
Table 4 In vitro toxicity studies for PFSAs - PFOS
|
Substance / CAS no. / purity / reference |
Test model / replicates / GL study / GLP status |
Conc. (nM) / duration |
Negative ctrl / positive ctrl Cytotoxicity |
Endpoints |
Results |
Study author conclusions |
Comments |
|
PFOS CAS No. not given. Purity not given. Conti et al. (2020). |
FRTL-5 cells. FRTL5-YFP cells. No. of cells not given. 6-9 expts. No. of replicates not given. Non-GL study. GLP not stated. |
0, 3 x 10², 1 x 10³, 3 x 10³, 1 x 10⁵. 2 or 10 minutes. |
Coon’s modified nutrient mixture F-12 Ham. NaClO4. Quick Cell Proliferation Colorimetric Assay. No cytotoxicity up to 1 x 10⁵ nM (FRTL-5 cells). |
Iodide accumulation by thyroid follicular FRTL5-YFP cells. |
↓ intracellular iodide concentration from 3 x 10² nM (150 ng/mL) (data only reported in figures).
|
PFOS inhibits NIS mediated iodide uptake by thyroid cells in vitro, although at concentrations unlikely to impact the general population. No effect on iodide efflux from thyroid cells. Disruption of iodide homeostasis in thyroid cells may be a potential mechanism for anti-thyroid health effects of PFOS. |
K2 Aim of the study was to evaluate the acute effects of PFOS on iodide transport by thyroid follicular cells in vitro. No data on the number of cells plated. Number of replicates not given. No details of funding given. Authors declare no conflicts of interest. |
|
PFOS CAS No. not given. Purity not given. Coperchini et al. (2015). |
FRTL-5 cells. 5 x 10⁴ cells/well (6 well plate). 2 expts. in triplicate. Non-GL study. GLP not stated. |
0, 1, 1 x 101, 1 x 10², 1 x 10³, 1 x 10⁴, 1 x 10⁵. 72 hr.
|
6H medium. NA.. Cytotoxicity. ↑ cell death at 1 x 10⁵ nM (15.6% vs 47.5%).
|
Thyroid cell proliferation and viability. |
↓ cell proliferation at 1 x 10⁵ nM (4.25% vs 3.9%). ↑ cell death at 1 x 10⁵ nM (15.6% vs 47.5%).
|
At a concentration of 105 nM significant inhibition of cell proliferation mainly due to cell death. The experimental design only allows identification of an acute in vitro exposure, but the possibility that a toxic effect may be produced by prolonged in vivo exposure to even lower concentrations of PFCs cannot be ruled out. Results indicate that PFOS enters thyroid cells by a gradient-based passive diffusion mechanism. |
K1 Aim of the study was to evaluate the effect of the in vitro exposure to PFOS on thyroid cell proliferation and viability. No details of funding given. |
|
PFOS CAS No. not given. Purity not given. Coperchini et al. (2021).
|
FRTL-5 cells. WST-1 assay: 2 x 10⁴ cells/well. (96 well plate). No. of expts. and replicates not given. Annexin V‑FITC/PI assay: 1 x 10⁴ cells/well. (24 well plate). No. of expts. and replicates not given. Cell proliferation assay: 500 cells/well (12 well plate). No. of expts. and replicates not given Non-GL study. GLP not stated. |
WST-1 assay: 0, 2 x 10⁻², 2 x 10⁻¹, 2, 2 x 101, 2 x 10². (originally reported as 0, 0.01, 0.1, 1, 10 or 100 ng/mL). 24, 48, 72, or 144 hr. Annexin V‑FITC/PI assay: 0 or 2.0 x 10² (originally reported as 100 ng/mL). 144 hr. Cell proliferation assay: 0, 2 x 10⁻², 2 x 10⁻¹, 2, 2 x 101, 2 x 10². (originally reported as 0, 0.01, 0.1, 1, 10 or 100 ng/mL). 6 days. |
6H medium NA. WST-1 assay ↓ FRTL-5 cell viability from 2.0 x 101 nM (10 ng/mL) at 24, 48, 72, or 144 hr (data only reported in figures).
|
Cell viability Cell death (apoptosis), late apoptotic, or necrotic cells Cell proliferation. |
WST-1 assay: ↓ FRTL-5 cell viability from 2 x 101 nM (10 ng/mL) at 24, 48, 72, or 144 hr (data only reported in figures). Annexin V‑FITC/PI assay: ↑ FRTL-5 cell death (data only reported in figures). Cell proliferation assay: ↓ FRTL-5 cell proliferation from 1 nM (1 ng/mL) data only reported in figures). |
PFOS exposure reduced viability and proliferation of FRTL5 and NHT cells. |
K2 Aim of the study was to evaluate the in vitro effects of PFOS on a strain of differentiated rat-thyroid cells (FRTL5 cells) in terms of cell viability, proliferation rate, and reactive oxygen species (ROS) production, after both short and long time of exposure. No details of number of replicates or experiments given. Conversion from ng/mL based on a molecular weight of 500.13 for CAS No. 1763-23-1. Funded by Università degli Studi di Pavia. Authors declared no conflicts of interest.
|
|
PFOS CAS No. not given. Purity not given. Coperchini et al. (2021).
|
NHT cells. WST-1 assay: 2 x 10⁴ cells/well. (96 well plate). No. of expts. and replicates not given . Annexin V‑FITC/PI assay: 1 x 10⁴ cells/well. (24 well plate). Replicates not given. Cell proliferation assay: 500 cells/well (12 well plate). Replicates not given. Non-GL study. GLP not stated. |
WST-1 assay: 0, 2 x 10⁻², 2 x 10⁻¹, 2, 2 x 101, 2 x 10². (originally reported as 0, 0.01, 0.1, 1, 10 or 100 ng/mL). 24, 48, 72, or 144 hr. Annexin V‑FITC/PI assay: 0 or 1 x 10-.1 (originally reported as100 ng/mL). 144 hr. Cell proliferation assay: 0, 2 x 10⁻², 2 x 10⁻¹, 2, 2 x 101, 2 x 10². (originally reported as 0, 0.01, 0.1, 1, 10 or 100 ng/mL). 6 days. |
6H medium. NA. WST-1 assay. ↓ NHT cell viability from 2 nM (1 ng/mL) at 24 hr, from 2.0 x 10⁻¹ nM (0.1 ng/mL) at 24 hr, from 2.0 x 101 nM (10 ng/mL) at 72 hr and from 2.0 x 10⁻² nM (0.01 ng/mL) at 144 hr (data only reported in figures).
|
Cell viability. Cell death (apoptosis), late apoptotic, or necrotic cells. Cell proliferation. |
WST-1 assay: ↓ NHT cell viability from 2.0 nM (1 ng/mL) at 24 hr, from 2 x 10⁻¹ nM (0.1 ng/mL) at 24 hr, from 2 x 101 nM (10 ng/mL) at 72 hr and from 2 x 10⁻² nM (0.01 ng/mL) at 144 hr (data only reported in figures). Annexin V‑FITC/PI assay: ↑ NHT cell death (data only reported in figures). Cell proliferation assay: ↓ NHT cell proliferation from 2 nM (1 ng/mL) (data only reported in figures). |
PFOS exposure reduced viability and proliferation of FRTL5 and NHT cells. |
K2 Aim of the study was to evaluate the in vitro effects of PFOA on primary cultures of normal human thyroid cells (NHT) in terms of cell viability, proliferation rate, and ROS production, after both short and long time of exposure. No details of number of replicates or experiments given. Conversion from ng/mL based on a molecular weight of 500.13 for CAS No. 1763-23-1. Funded by Università degli Studi di Pavia. Authors declared no conflicts of interest.
|
|
PFOS CAS No. not given. Purity not given. Croce et al. (2019) |
WST-1 assay: FRTL-5 cells. 2 x 10⁴ cells/well (96 well plate). 3 expts. No. of replicates not given, cAMP assay: No. cells not given (80% confluence). 3 expts. No. of replicates not given. Non-GL study. GLP not stated. |
1 x 10⁻¹, 1, 1 x 101, 1 x 10², 1 x 10³, 1 x 10⁵ 24 hr.
|
6H medium. 1 mU/LTSH (cAMP assay). WST-1 assay. Cytotoxic at 1 x 10⁵ nM (data only reported in figures). |
Thyroid cell viability. TSH-stimulated cAMP production. |
No effect on inhibition of TSH-induced. cAMP production in FRTL-5 cells (data only reported in figures). |
PFOS is cytotoxic at high concentrations (rarely, if ever, observed in humans), and its effect appears to be concentration-dependent. cAMP production is not modulated by PFOS. The study excludes an interference with the TSH-dependent control of thyroid function as a mechanism by which PFOS would interfere with thyroid function. |
K2 Aim of the study was to investigate whether PFBS could affect thyroid cell viability and/or interfere with the functional effect of TSH by investigating TSH-induced cAMP production in FRTL-5 cells. Number of replicates not given. Purity not given. No details of funding given. Authors declare no conflict of interest.
|
|
PFOS CAS No. not given. Purity not given. De Toni et al. (2022).
|
FRTL-5 cells. Cell growth (MTT assay): 3-8 x 10³ cells/well (96 well plate). 3 expts. in triplicate. cAMP assay: No. cells not given (80% confluence). (96 well plate). 3 expts. in triplicate. Iodide uptake assay: No. cells not given (60% confluence) (96 well plate). 3 expts. in triplicate. Non-GL study. GLP not stated. |
0, 2 x 10⁻¹, 2, 2 x 101, 2 x 10² (originally reported as (originally reported as 0, 0.1, 1, 10 or 100 ng/mL). Cell growth: 24 hr. cAMP assay: 72h. Iodide uptake assay: 24 hr. |
Coon′s modified Ham′s F12. Medium. 1 mU/L TSH (cAMP assay). NaSCN (Iodide uptake assay). MTT assay. No effect on cytotoxicity up to 2 x 10² (100 ng/ml) (data only reported in figures). |
Cell growth and membrane fluidity. Total RNA. TSH-stimulated cAMP production. Iodide uptake. |
No effect on basal iodide uptake in cells in the absence of TSH stimulation. ↑ increase in iodide uptake in cells following TSH stimulation from 2 x 10⁻¹ nM (0.1 ng/mL) (data only reported in figures). No effect on mean fluorescence intensity of MC540 staining (a proxy of membrane fluidity). ↓ intracellular cAMP levels at 2 x 10² (100 ng/ml) (data only reported in figures). No effect on NIS and TPO gene expression following TSH stimulation (data only reported in figures). |
Legacy and new generation PFAS can differentially influence TSH dependent signalling pathways through the direct interaction with TSH-R. Computer-Based Molecular Docking and Molecular Dynamics Analysis shows the possible interference the TSH/TSH-R interaction. |
K2 Aim of the study was to assess the potential disrupting effect of PFAS, on FRTL-5 normal rat thyroid follicular cell lines via cell function, cell toxicity, membrane biophysical properties and computational modelling of the possible interaction with TSH-Receptor. Number of replicates not given, Purity not given. Conversion from ng/mL based on a molecular weight of 500.13 for CAS No. 1763-23-1. Molecular docking studies were also conducted but no quantitative data reported. Study funded by Solvay Specialty Polymers Italy S.p.A. The funder had no role in the design and conduct of the study; collection, management, analysis, and interpretation of the data, or approval of the manuscript; and decision to submit the manuscript for publication. |
|
PFOS CAS No. 1763-23-1. 98%. Long et al. (2013). |
GH3 cells. 3 x 10³ cells/well (96 well plate). 3 expts. in quadruplicate. Non-GL study. GLP not stated. |
1 – 1 x 10⁵. 6 days. |
0.02% DMSO. 0.5 nM T3. LDH. Cytotoxic at >1 x 10⁶. |
Thyroid hormone-dependent cell growth (T-screen assay). |
Without T3 (agonistic response). ↓ cell proliferation. LOEC = 1 nM. RPE at MOEC = -3.87% relative to T3. With T3 (competitive response). ↓ T3-induced cell proliferation. LOEC = 10 nM RPE at MOEC = -1.69% relative to T3. |
PFOS has the potential to inhibit the function of the TH system. Thus, PFOS might affect the endocrine homeostasis via interfering with nuclear receptor pathways including PPAR, ER, AR, TR and AhR. |
K2 Aim of the study was to assess in vitro the potential impacts of seven PFAS on TH activity using the rat pituitary tumour cell line GH3 expressing intracellular TR and responding to physiological concentration of TH by proliferation (named as T-screen). T-screen assay exposure duration 6 days. Study funded by the Danish Strategic Research Council and Aarhus University. |
|
PFOS CAS No. 1763-23-1. 98%. Long et al. (2013). |
Hepa1.12cR cells. 6 × 10⁴ cells/per well. 2 expts. in triplicate. Non-GL study. GLP not stated. |
1 - 1 x 10⁵ Duration not given. |
0.02% DMSO. 60 pM TCDD. LDH. Cytotoxic at >1 x 10⁶. |
Activation / inhibition of AhR. (AhR transcriptional activation bioassay). |
Without TCDD (agonistic response). No observed effect. With TCDD (competitive response). No observed effect.
|
No effect on AhR. |
K1 Aim of the study was to assess in vitro the potential impacts of seven PFAS on AhR function. The AhR transcriptional activity was determined by AhR-luciferase reporter gene bioassay using the stably transfected mouse Hepa1.1 2cR cell. No data on the number of cells plated or duration of exposure. Study funded by the Danish Strategic Research Council and Aarhus University. |
|
PFOS CAS No. not given. Purity not given. Ren et al. (2016). |
Human WT TTR. 50 nM. Human mutant TTRmutK15G. 500 nM. in triplicate. Non-GL study. GLP not stated. |
Human WT and mutant TTRmutK15G. 1 – 1 x 10⁶ (estimated from figures). 5 minutes.
|
Competitive binding assay: NA. 50 nM F-T4. Cytotoxicity NA.
|
Binding potency to TTR. |
WT TTR. IC50 = 1.30 x 10² nM. RP = 0.24 relative to T4. TTRmutK15G. IC50 = 4.31 x 10⁴ nM.
|
Binding affinities of TTR to PFAS were much stronger than those of TBG to the same PFAS. PFAS might bind to TTR but not TBG when ingested and enter the blood stream. Displacement of T4 from TTR may be a concern for workers occupationally exposed to PFAS but not for the general population. PFOS could completely displace T4 from TTR in production workers. |
K1 Aim of the study to investigate the binding affinities of PFAS with human TH transport proteins TTR and TBG. Purity not given. Of the 16 PFAS studied, PFOS had the highest potency relative to T4 with WT TTR. Funded by the Chinese Academy of Sciences and the National Natural Science Foundation of China. Authors declared no conflicts of interest. |
|
PFOS CAS No. not given. Purity not given. Ren et al. (2016). |
Human WT TBG. 50 nM. Human mutant TBGmutR378G. 1000 nM. Human mutant. TBGmutR381G. 1000 nM. 3 expts. in triplicate. Non-GL study. GLP not stated. |
Human WT TBG, TBGmutR378G and TBGmutR381G. 1 – 1 x 10⁶ (estimated from figures). 5 minutes.
|
NA. 50 nM F-T4. Cytotoxicity NA.
|
Binding potency to TBG. |
No observed effect. TBGmutR378G. No observed effect. TBGmutR381G. No observed effect.
|
Binding affinities of TTR to PFAS were much stronger than those of TBG to the same PFAS. PFAS might bind to TTR but not TBG when ingested and enter the blood stream. |
K1 Aim of the study to investigate the binding affinities of PFAS with human TH transport proteins TTR and TBG. Purity not given. Funded by the Chinese Academy of Sciences and the National Natural Science Foundation of China. Authors declared no conflicts of interest. |
|
PFOS CAS No. 2795-39-3. ≥98%. Weiss et al. (2009). |
TTR. 30nM. No. of expts. and replicates not given. Non-GL study. GLP not stated. |
1 x 101 – 1 x 10⁴ . Overnight. |
NA T4. Cytotoxicity NA. |
T4-TTR-binding. |
IC50 = 9.4 x 10² nM. RP = 0.065 relative to T4. |
Competitive binding of PFCs to TTR, as observed for human TTR in the present study with certain PFAS, may explain altered TH levels described for PFC-exposed rats and monkeys. |
K2 Aim of the study was to investigate if PFAS compete with T4 for binding to TTR. Number of replicates and experiments not given. Study funded by EU-supported program MODELKEY and the Marie Curie Research Training Network KEYBIOEFFECTS. |
Table 5 In vitro toxicity studies for PFSAs – L-PFDS
|
Substance / CAS no. / purity / reference |
Test model / replicates/ GL study / GLP status |
Conc. (nM) / duration |
Negative ctrl / positive ctrl Cytotoxicity |
Endpoints |
Results |
Study author conclusions |
Comments |
|
L-PFDS CAS No. NA. ˃99%. Weiss et al. (2009). |
TTR. 30nM. No. of expts. and replicates not given. Non-GL study. GLP not stated. |
1 x 101 – 1 x 10⁴. Overnight. |
NA. T4. Cytotoxicity NA. |
T4-TTR-binding. |
IC50 = ND. RP = ND relative to T4. |
RP not calculated due to IC50 falling below the laboratory detection limit. Competitive binding of PFCs to TTR, as observed for human TTR in the present study with certain PFAS, may explain altered TH levels described for PFC-exposed rats and monkeys. |
K2 Aim of the study was to investigate if PFAS compete with T4 for binding to TTR. Number of replicates and experiments not given. Study funded by EU-supported program MODELKEY and the Marie Curie Research Training Network KEYBIOEFFECTS. |
Table 6 In vitro toxicity studies for PFSIAs – L-PFOSi
|
Substance / CAS no. / purity / reference |
Test model / replicates / GL study / GLP status |
Conc. (nM) / duration |
Negative ctrl / positive ctrl Cytotoxicity |
Endpoints |
Results |
Study author conclusions |
Comments |
|
L-PFOSi CAS No. NA. ˃99%. Weiss et al. (2009). |
TTR. 30nM. No. of expts. and replicates not given. Non-GL study. GLP not stated. |
1 x 101 – 1 x 10⁴ . Overnight. |
NA. T4. Cytotoxicity NA. |
T4-TTR-binding. |
IC50 = 1.73 x 10³ nM. RP = 0.035 relative to T4. |
Competitive binding of PFCs to TTR, as observed for human TTR in the present study with certain PFAS, may explain altered TH levels described for PFC-exposed rats and monkeys. |
K2 Aim of the study to investigate if PFAS compete with T4 for binding to TTR. Number of replicates and experiments not given. Of the 24 PFAS studied, PFOS had the second highest potency, relative to T4. Study funded by EU-supported program MODELKEY and the Marie Curie Research Training Network KEYBIOEFFECTS. |
Table 7 In vitro toxicity studies for PFCAs – PFBA
|
Substance / CAS no. / purity / reference |
Test model / replicates / GL study / GLP status |
Conc. (nM) / duration |
Negative ctrl / positive ctrl Cytotoxicity |
Endpoints |
Results |
Study author conclusions |
Comments |
|
PFBA. CAS No. not given. Purity not given. Croce et al. (2019). |
WST-1 assay: FRTL-5 cells. 2 x 10⁴ cells/well (96 well plate). 3 expts. No. of replicates not given. cAMP assay: No. cells not given (80% confluence). 3 expts. No. of replicates not given. Non-GL study. GLP not stated. |
0, 1 x 10⁻¹, 1 x 10, 1 x 10², 1 x 10³, 1 x 10⁴, 1 x 10⁵ 24 hr.
|
6H medium. 1 mU/L TSH (cAMP assay). WST-1 assay. No effect on cytotoxicity (data only reported in figures). |
Thyroid cell viability. TSH-stimulated cAMP production. |
No effect on inhibition of TSH-induced cAMP production in FRTL-5 cells (data only reported in figures). |
cAMP production is not modulated by PFBA. The study excludes an interference with the TSH-dependent control of thyroid function as a mechanism by which PFBA would interfere with thyroid function. |
K2 Aim of the study was to investigate whether PFBS could affect thyroid cell viability and/or interfere with the functional effect of TSH by investigating TSH-induced cAMP production in FRTL-5 cells. Number of replicates not given. Purity not given. No details of funding given. Authors declare no conflict of interest.
|
|
PFBA CAS No. not given. Purity not given. Ren et al. (2016). |
Human WT TTR. 50 nM. Human mutant TTRmutK15G. 500 nM. 3 expts. in triplicate. Non-GL study. GLP not stated. |
Human WT and TTRmutK15G. 1 – 1 x 10⁶ (estimated from figures). 5 minutes.
|
Competitive binding assay: NA. 50 nM F-T4. Cytotoxicity NA.
|
Binding potency to TTR. |
WT TTR. IC50 = 8.92 x 10⁴ nM. RP = 3 x 10⁻⁴ relative to T4. TTRmutK15G. No observed effect.
|
Binding affinities of TTR to PFAS were much stronger than those of TBG to the same PFAS. PFAS might bind to TTR but not TBG when ingested and enter the blood stream. Displacement of T4 from TTR may be a concern for workers occupationally exposed to PFAS but not for the general population. |
K1 Aim of the study was to investigate the binding affinities of PFAS with human TH transport proteins TTR and TBG. Purity not given. Funded by the Chinese Academy of Sciences and the National Natural Science Foundation of China. Authors declared no conflicts of interest. |
|
PFBA CAS No. not given. Purity not given. Ren et al. (2016). |
Human WT TBG. 50 nM.
Human mutant TBGmutR378G. 1000 nM. Human mutant. TBGmutR381G. 1000 nM. 3 expts. in triplicate. Non-GL study. GLP not stated. |
Human WT TBG, TBGmutR378G and TBGmutR381G. 1 – TTRmutK15G. 1 – 1 (estimated from figures) 5 minutes.
|
NA. 50 nM F-T4. Cytotoxicity NA.
|
Binding potency to TBG. |
WT TBG No observed effect. TBGmutR378G. No observed effect. TBGmutR381G. No observed effect.
|
Binding affinities of TTR to PFAS were much stronger than those of TBG to the same PFAS. PFAS might bind to TTR but not TBG when ingested and enter the blood stream. |
K1 Aim of the study was to investigate the binding affinities of PFAS with human TH transport proteins TTR and TBG. Purity not given. Funded by the Chinese Academy of Sciences and the National Natural Science Foundation of China. Authors declared no conflicts of interest. |
|
PFBA CAS No. 375-22-4. 99%. Weiss et al. (2009). |
TTR. 30nM. No. of expts. and replicates not given. Non-GL study. GLP not stated. |
1 x 101 – 1 x 10⁴. Overnight. |
NA. T4. Cytotoxicity NA. |
T4-TTR-binding. |
IC50 = ND. RP = ND relative to T4. |
RP not calculated due to IC50 falling below the laboratory detection limit. Competitive binding of PFCs to TTR, as observed for human TTR in the present study with certain PFAS, may explain altered TH levels described for PFC-exposed rats and monkeys. |
K2 Aim of the study was to investigate if PFAS compete with T4 for binding to TTR. Number of replicates and experiments not given. Study funded by EU-supported program MODELKEY and the Marie Curie Research Training Network KEYBIOEFFECTS. |
Table 8 In vitro toxicity studies for PFCAs – PFPeA
|
Substance / CAS no. / purity / reference |
Test model / replicates / GL study / GLP status |
Conc. (nM) / duration |
Negative ctrl / positive ctrl Cytotoxicity |
Endpoints |
Results |
Study author conclusions |
Comments |
|
PFPeA CAS No. not given. Purity not given. Croce et al. (2019). |
WST-1 assay: FRTL-5 cells. 2 x 10⁴ cells/well (96 well plate). 3 expts. No. of replicates not given. cAMP assay: No. cells not given (80% confluence) 3 expts. No. of replicates not given. Non-GL study. GLP not stated. |
0, 1 x 10⁻¹, 1 x 10, 1 x 10², 1 x 10³, 1 x 10⁴, 1 x 10⁵ 24 hr.
|
6H medium. 1 mU/LTSH (cAMP assay). WST-1 assay. No effect on cytotoxicity (data only reported in figures). |
Thyroid cell viability. TSH-stimulated cAMP production. |
No effect on inhibition of TSH-induced. cAMP production in FRTL-5 cells (data only reported in figures). |
cAMP production is not modulated by PFPeA. The study excludes an interference with the TSH-dependent control of thyroid function as a mechanism by which PFPeA would interfere with thyroid function. |
K2 Aim of the study was to investigate whether PFPeA could affect thyroid cell viability and/or interfere with the functional effect of TSH by investigating TSH-induced cAMP production in FRTL-5 cells. Number of replicates not given. Purity not given. No details of funding given. Authors declare no conflict of interest. |
Table 9 In vitro toxicity studies for PFCAs – PFHxA
|
Substance / CAS no. / purity / reference |
Test model / replicates / GL study / GLP status |
Conc. (nM) / duration |
Negative ctrl / positive ctrl Cytotoxicity |
Endpoints |
Results |
Study author conclusions |
Comments |
|
PFHxA CAS No. not given. Purity not given. Ren et al. (2016). |
Human WT TTR. 50 nM. Human mutant TTRmutK15G. 500 nM. 3 expts. in triplicate. Non-GL study. GLP not stated. |
Human WT and mutant TTRmutK15G. 1 – 1 x 10⁶ (estimated from figures). 5 minutes.
|
Competitive binding assay: NA. 50 nM F-T4. Cytotoxicity NA.
|
Binding potency to TTR. |
WT TTR. IC50 = 3.19 x 10³ nM. RP = 9 x 10⁻³ relative to T4. TTRmutK15G. No observed effect.
|
Binding affinities of TTR to PFAS were much stronger than those of TBG to the same PFAS. PFAS might bind to TTR but not TBG when ingested and enter the blood stream. Displacement of T4 from TTR may be a concern for workers occupationally exposed to PFAS but not for the general population. |
K1 Aim of the study was to investigate the binding affinities of PFAS with human TH transport proteins TTR and TBG. Purity not given. Funded by the Chinese Academy of Sciences and the National Natural Science Foundation of China. Authors declared no conflicts of interest. |
|
PFHxA CAS No. not given. Purity not given. Ren et al. (2016). |
Human WT TBG. 50 nM.
Human mutant TBGmutR378G. 1000 nM. Human mutant. TBGmutR381G. 1000 nM. 3 expts. in triplicate Non-GL study. GLP not stated. |
Human WT TBG, TBGmutR378G and TBGmutR381G. 1 – 1 x 10⁶ (estimated from figures) 5 minutes.
|
NA. 50 nM F-T4. Cytotoxicity NA.
|
Binding potency to TBG. |
WT TBG. No observed effect. TBGmutR378G. No observed effect. TBGmutR381G. No observed effect.
|
Binding affinities of TTR to PFAS were much stronger than those of TBG to the same PFAS. PFAS might bind to TTR but not TBG when ingested and enter the blood stream. |
K1 Aim of the study was to investigate the binding affinities of PFAS with human TH transport proteins TTR and TBG. Purity not given. Funded by the Chinese Academy of Sciences and the National Natural Science Foundation of China. Authors declared no conflicts of interest. |
|
PFHxA CAS No. 307-24-4. ≥98%. Weiss et al. (2009). |
TTR. 30nM. No. of expts. and replicates not given. Non-GL study. GLP not stated. |
1 x 101 – 1 x 10⁴. Overnight. |
NA. T4. Cytotoxicity NA. |
T4-TTR-binding. |
IC50 = 8.22 x 10³ nM. RP = 0.007 relative to T4. |
Competitive binding of PFCs to TTR, as observed for human TTR in the present study with certain PFAS, may explain altered TH levels described for PFC-exposed rats and monkeys. |
K2 Aim of the study was to investigate if PFAS compete with T4 for binding to TTR. Number of replicates and experiments not given. Study funded by EU-supported program MODELKEY and the Marie Curie Research Training Network KEYBIOEFFECTS. |
Table 10 In vitro toxicity studies for PFCAs – 7H-PFHpA
|
Substance / CAS no. / purity / reference |
Test model / replicates / GL study / GLP status |
Conc. (nM) / duration |
Negative ctrl / positive ctrl Cytotoxicity |
Endpoints |
Results |
Study author conclusions |
Comments |
|
7-H PFHpA CAS No. 1546-95-8. 98%. Weiss et al. (2009). |
TTR. 30nM. No. of expts. and replicates not given. Non-GL study. GLP not stated. |
1 x 101 – 1 x 10⁴. Overnight. |
NA. T4. Cytotoxicity NA. |
T4-TTR-binding. |
IC50 = 8.64 x 10³ nM. RP = 0.007 relative to T4. |
Competitive binding of PFCs to TTR, as observed for human TTR in the present study with certain PFAS, may explain altered TH levels described for PFC-exposed rats and monkeys. |
K2 Aim of the study was to investigate if PFAS compete with T4 for binding to TTR. Number of replicates and experiments not given. Study funded by EU-supported program MODELKEY and the Marie Curie Research Training Network KEYBIOEFFECTS. |
Table 11 In vitro toxicity studies for PFCAs – 6:2 FTUA
|
Substance / CAS no. / purity / reference |
Test model / replicates / GL study / GLP status |
Conc. (nM) / duration |
Negative ctrl / positive ctrl Cytotoxicity |
Endpoints |
Results |
Study author conclusions |
Comments |
|
6:2 FTUA CAS No. NA. 98%. Weiss et al. (2009). |
TTR. 30nM. No. of expts. and replicates not given. Non-GL study. GLP not stated. |
1 x 101 – 1 x 10⁴ . Overnight. |
NA. T4. Cytotoxicity NA. |
T4-TTR-binding. |
IC50 = 8.85 x 10³ nM. RP = 0.007 relative to T4. |
Competitive binding of PFCs to TTR, as observed for human TTR in the present study with certain PFAS, may explain altered TH levels described for PFC-exposed rats and monkeys. |
K2 Aim of the study was to investigate if PFAS compete with T4 for binding to TTR. Number of experiments and replicates not given. Study funded by EU-supported program MODELKEY and the Marie Curie Research Training Network KEYBIOEFFECTS. |
Table 12 In vitro toxicity studies for PFCAs – PFHpA
|
Substance / CAS no. / purity / reference |
Test model / replicates / GL study / GLP status |
Conc. (nM) / duration |
Negative ctrl / positive ctrl Cytotoxicity |
Endpoints |
Results |
Study author conclusions |
Comments |
|
PFHpA CAS No. not given. Purity not given. Ren et al. (2016). |
Human WT TTR. 50 nM. Human mutant TTRmutK15G. 500 nM. 3 expts. in triplicate. Non-GL study. GLP not stated. |
Human WT and TTRmutK15G. 1 – 1 x 10⁶ (estimated from figures) 5 minutes.
|
Competitive binding assay: NA. 50 nM F-T4. Cytotoxicity NA.
|
Binding potency to TTR. |
WT TTR. IC50 = 1.13 x 10³ nM. RP = 0.028 relative to T4. TTRmutK15G. No observed effect.
|
Binding affinities of TTR to PFAS were much stronger than those of TBG to the same PFAS. PFAS might bind to TTR but not TBG when ingested and enter the blood stream. Displacement of T4 from TTR may be a concern for workers occupationally exposed to PFAS but not for the general population. |
K1 Aim of the study was to investigate the binding affinities of PFAS with human TH transport proteins TTR and TBG. Purity not given. Funded by the Chinese Academy of Sciences and the National Natural Science Foundation of China. Authors declared no conflicts of interest. |
|
PFHpA CAS No. not given. Purity not given. Ren et al. (2016). |
Human WT TBG 50 nM.
Human mutant TBGmutR378G. 1000 nM. Human mutant. TBGmutR381G. 1000 nM. 3 expts. in triplicate. Non-GL study. GLP not stated. |
Human WT TBG, TBGmutR378G and TBGmutR381G. 1 – 1 x 10⁶ (estimated from figures) 5 minutes.
|
NA. 50 nM F-T4. Cytotoxicity NA.
|
Binding potency to TBG. |
WT TBG. No observed effect. TBGmutR378G. No observed effect. TBGmutR381G. No observed effect.
|
Binding affinities of TTR to PFAS were much stronger than those of TBG to the same PFAS. PFAS might bind to TTR but not TBG when ingested and enter the blood stream.. |
K1 Aim of the study was to investigate the binding affinities of PFAS with human TH transport proteins TTR and TBG. Purity not given. Funded by the Chinese Academy of Sciences and the National Natural Science Foundation of China. Authors declared no conflicts of interest. |
|
PFHpA CAS No. 375-85-9. 96%. Weiss et al. (2009). |
TTR. 30 nM. No. of expts. and replicates not given. Non-GL study. GLP not stated. |
1 x 101 – 1 x 10⁴. Overnight. |
NA. T4. Cytotoxicity NA. |
T4-TTR-binding. |
IC50 = 1.56 x 10³ nM. RP = 0.039 relative to T4. |
Competitive binding of PFCs to TTR, as observed for human TTR in the present study with certain PFAS, may explain altered TH levels described for PFC-exposed rats and monkeys. |
K2 Aim of the study was to investigate if PFAS compete with T4 for binding to TTR. Number of experiments and replicates not given. Study funded by EU-supported program MODELKEY and the Marie Curie Research Training Network KEYBIOEFFECTS. |
Table 13 In vitro toxicity studies for PFCAs – PFOA
|
Substance / CAS no. / purity / reference |
Test model / replicates / GL study / GLP status |
Conc. (nM) / duration |
Negative ctrl / positive ctrl Cytotoxicity |
Endpoints |
Results |
Study author conclusions |
Comments |
|
PFOA CAS No. not given. Purity not given. Conti et al. (2020). |
FRTL-5 cells. FRTL5-YFP cells. 6-9 expts Replicates not given. Non-GL study. GLP not stated. |
0 or 1 x 10⁵. 2 or 10 minutes. |
Coon’s modified nutrient mixture F-12 Ham. NaClO4. Quick Cell Proliferation Colorimetric Assay. Not cytotoxic up to 1 x 10⁵ nM. |
Iodide accumulation by thyroid follicular cells. |
No effect on intracellular iodide concentration at 1 x 10⁵ nM (100 µM) (data only reported in figures).
|
PFOA did not inhibit NIS mediated iodide uptake by thyroid cells in vitro. |
K2 Aim of the study was to evaluate the acute effects of PFOA on iodide transport by thyroid follicular cells in vitro. No data on the number of cells plated. Number of replicates not given. No details of funding given. Authors declare no conflicts of interest. |
|
PFOA CAS No. not given. Purity not given. Coperchini et al. (2015). |
FRTL-5 cells. 5 x 10⁴ cells/well (6 well plate). 2 expts. in triplicate. Non-GL study GLP not stated. |
0, 1, 10, 1 x 10², 1 x 10³, 1 x 10⁴, and 1 x 10⁵. 6H medium 72 hr. |
6H medium. NA. Cytotoxicity. ↑ cell death at 105 (15.6% vs 37.9%).
|
Thyroid cell proliferation and viability. |
↓ cell proliferation at 1 x 10⁵ nM (4.25% vs 7.5%). ↑ cell death at 1 x 10⁵ nM (15.6% vs 37.9%).
|
At a concentration of 1 x 10⁴ nM significant inhibition of cell proliferation mainly due to cell death. Results indicate that PFOA enters thyroid cells by a gradient-based passive diffusion mechanism. |
K1 Aim of the study was to evaluate the effect of the in vitro exposure to PFOS on thyroid cell proliferation and viability. No details of funding given. |
|
PFOA CAS No. not given. Purity not given. Coperchini et al. (2021).
|
FRTL-5 cells. WST-1 assay: 2 x 10⁴ cells/well. (96 well plate) No. of expts. and replicates not given. Annexin V‑FITC/PI assay: 1 x 10⁴ cells/well. (24 well plate) No. of expts. and replicates not given. Cell proliferation assay: 500 cells/well (12 well plate). No. of expts. and replicates not given. Non-GL study. GLP not stated. |
WST-1 assay: 0, 2.41 x 10⁻², 2.41 x 10⁻¹, 2.41, 2.41 x 101 or 2.41 x 10². (originally reported as 0, 0.01, 0.1, 1, 10 or 100 ng/mL). 6H medium. 24, 48, 72, or 144 hr. Annexin V‑FITC/PI assay: 0 or 2.41 x 10². (originally reported as 100 ng/mL). 6H medium. 144 hr. Cell proliferation assay: 0, 2.41 x 10⁻², 2.41 x 10⁻¹, 2.41, 2.41 x 101 or 2.41 x 10². (originally reported as 0, 0.01, 0.1, 1, 10 or 100 ng/mL). 6H medium. 6 days. |
6H medium NA. WST-1 assay. ↓ FRTL-5 cell viability from 2.41 x 101 nM (10 ng/mL) at 144 hr (data only reported in figures).
|
Cell viability. Cell death (apoptosis), late apoptotic, or necrotic cells Cell proliferation. |
WST-1 assay: ↓ FRTL-5 cell viability from 2.41 x 101 (10 ng/mL) at 144 hr (data only reported in figures). Annexin V‑FITC/PI assay: ↑ FRTL-5 cell death (data only reported in figures). Cell proliferation assay: ↓ FRTL-5 cell proliferation from 2.41 nM (1 ng/mL) (data only reported in figures).
|
PFOA exposure reduced viability and of FRTL5 cells, and proliferation of FRTL5 and NHT cells. |
K2 Aim of the study was to evaluate the effect of the in vitro exposure to PFOA on thyroid cell proliferation and viability. Number of experiments and replicates not given. Conversion from ng/mL based on a molecular weight of 414 for CAS No. 335-67-1. Funded by Università degli Studi di Pavia. Authors declared no conflicts of interest.
|
|
PFOA CAS No. not given. Purity not given. Coperchini et al. (2021).
|
NHT cells. WST-1 assay: 2 x 10⁴ cells/well. (96 well plate). No. of expts. and replicates not given. Annexin V‑FITC/PI assay: 1 x 10⁴ cells/well. (24 well plate). No. of expts. and replicates not given. Cell proliferation assay: 500 cells/well (12 well plate)No. of expts. and replicates not given. Non-GL study. GLP not stated. |
WST-1 assay: 0, 2.41 x 10⁻², 2.41 x 10⁻¹, 2.41, 2.41 x 101 or 2.41 x 10². (originally reported as 0, 0.01, 0.1, 1, 10 or 100 ng/mL). 6H medium. 24, 48, 72, or 144 hr. Annexin V‑FITC/PI assay: 0 or 2.41 x 10². (originally reported as 100 ng/mL). 6H medium. 144 hr. Cell proliferation assay: 0, 2.41 x 10⁻², 2.41 x 10⁻¹, 2.41, 2.41 x 101 or 2.41 x 10². (originally reported as 0, 0.01, 0.1, 1, 10 or 100 ng/mL). 6H medium. 6 days. |
6H medium. NA. WST-1 assay. No effect on cytotoxicity. |
Cell viability. Cell death (apoptosis), late apoptotic, or necrotic cells. Cell proliferation. |
WST-1 assay: No effect on NHT cells (data only reported in figures). Annexin V‑FITC/PI assay: No effect on NHT cells (data only reported in figures). Cell proliferation assay: No effect on NHT cells (data only reported in figures).
|
PFOA exposure reduced viability and of FRTL5 cells, and proliferation of FRTL5 and NHT cells. |
K2 Aim of the study was to evaluate the in vitro effects of PFOA on primary cultures of NHT cells in terms of cell viability, proliferation rate, and ROS production, after both short and long time of exposure. Number of experiments and replicates not given. Conversion from ng/mL based on a molecular weight of 414 for CAS No. 335-67-1. Funded by Università degli Studi di Pavia. Authors declared no conflicts of interest.
|
|
PFOA CAS No. not given. Purity not given. Croce et al. (2019). |
WST-1 assay: FRTL-5 cells. 2 x 10⁴ cells/well (96 well plate). 3 expts. No. of replicates not given. cAMP assay: No. cells not given (80% confluence). No. of replicates not given, 3 expts. Non-GL study. GLP not stated. |
0, 1 x 10⁻¹, 1 x 10, 1 x 10², 1 x 10³, 1 x 10⁴ or 1 x 10⁵ 24 hr.
|
6H medium. 1 mU/LTSH (cAMP assay). WST-1 assay. No effect on cytotoxicity (data only reported in figures). |
Thyroid cell viability. TSH-stimulated cAMP production. |
No effect on inhibition of TSH-induced cAMP producton in FRTL-5 cells (data only reported in figures). |
cAMP production is not modulated by PFOA. The study excludes an interference with the TSH-dependent control of thyroid function as a mechanism by which PFOA would interfere with thyroid function. |
K2 Aim of the study was to investigate whether PFBS could affect thyroid cell viability and/or interfere with the functional effect of TSH by investigating TSH-induced cAMP production in FRTL-5 cells. Number of replicates not given. Purity not given. No details of funding given. Authors declare no conflict of interest.
|
|
PFOA CAS No. not given. Purity not given. De Toni et al. (2022).
|
FRTL-5 cells. Cell growth (MTT assay): 3-8 x 10³ cells/well (96 well plate). 3 expts. in triplicate. cAMP assay: No. cells not given (80% confluence). (96 well plate). 3 expts. in triplicate. Iodide uptake assay: No. cells not given (60% confluence) (96 well plate). 3 expts. in triplicate. Non-GL study. GLP not stated. |
0, 2.41 x 10⁻¹, 2.41, 2.41 x 101 or 2.41 x 10². (originally reported as 0, 0.1, 1, 10 or 100 ng/mL). Cell growth: 24h. cAMP assay: 72h. Iodide uptake assay: 24 hr. |
Coon′s modified Ham′s F12. Medium. 1 mU/LTSH (cAMP assay). NaSCN (Iodide uptake assay). MTT assay. No effect on cytotoxicity. |
Cell growth and membrane fluidity. Total RNA. TSH-stimulated cAMP production. Iodide uptake. |
↓ basal iodide uptake in cells in the absence of TSH stimulation at 2.41 x 10⁻¹nM (0.1 ng/mL) and ≥ 24.1 nM (10 ng/mL) (data only reported in figures). ↑ increase in iodide uptake in cells following TSH stimulation from 2.41 x 10⁻¹nM (0.1 ng/mL) (data only reported in figures). No effect on mean fluorescence intensity of MC540 staining (a proxy of membrane fluidity). ↓ intracellular cAMP levels from 2.41 x 10⁻¹nM (0.1 ng/mL) (data only reported in figures). ↓ NIS and TPO gene expression from 2.41 x 10⁻¹ nM (0.1 ng/mL) following TSH stimulation (data only reported in figures). |
Legacy and new generation PFAS can differentially influence TSH dependent signalling pathways through the direct interaction with TSH-R. Computer-Based Molecular Docking and Molecular Dynamics Analysis shows the possible interference the TSH/TSH-R interaction. Focusing on the amino acid region of TSH-R around ASP160, previously shown to highly involved in the activation by TSH, shows that the modelled binding of PFOA was associated with an increase of the backbone flexibility. |
K2 Aim of the study was to assess the potential disrupting effect of PFAS, on FRTL-5 cells via cell function, cell toxicity, membrane biophysical properties and computational modelling of the possible interaction with TSH-Receptor. Number of replicates not given, Purity not given. Conversion from ng/mL based on a molecular weight of 414 for CAS No. 335-67-1. Study funded by Solvay Specialty Polymers Italy S.p.A. The funder had no role in the design and conduct of the study; collection, management, analysis, and interpretation of the data, or approval of the manuscript; and decision to submit the manuscript for publication. |
|
PFOA CAS No. 335-67-1. 95%. Long et al. (2013). |
GH3 cells. 3 x 10³ cells/well (96 well plate). 3 expts. in quadruplicate. Non-GL study. GLP not stated. |
1 - 1 x 10⁵. 6 days. |
0.02% DMSO / 0.02% EtOH. 0.5 nM T3. LDH. Cytotoxic at >1 x 10⁶ nM. |
Thyroid hormone-dependent cell growth (T-screen assay). |
Without T3 (agonistic response). ↓ cell proliferation. LOEC = 1 nM RPE at MOEC = -2.71% relative to T3. With T3 (competitive response). No effect on T3-induced cell proliferation. |
PFOA has the potential to inhibit the function of the TH system. Thus, PFOA might affect the endocrine homeostasis via interfering with nuclear receptor pathways including PPAR, ER, AR, TR and AhR. |
K2 Aim of the study was to assess in vitro the potential impacts of seven PFAS on AhR function. T-screen assay exposure duration 6 days. Study funded by the Danish Strategic Research Council and Aarhus University. |
|
PFOA CAS No. 335-67-1. 95%. Long et al. (2013). |
Hepa1.12cR cells. 6 × 10⁴ cells/per well. 2 expts. in triplicate. Non-GL study GLP not stated. |
1 - 1 x 10⁵ Duration not given. |
0.02% DMSO. 60 pM TCDD. LDH. Cytotoxic at >1 x 10⁶ nM. |
Activation / inhibition of AhR (AhR transcriptional activation bioassay). |
Without TCDD (agonistic response). No observed effect. With TCDD (antagonistic response). No observed effect.
|
No effect on AhR. |
K1 No data on the number of cells plated. The AhR transcriptional activity was determined by AhR-luciferase reporter gene bioassay using the stably transfected mouse Hepa1.1 2cR cell. Study funded by the Danish Strategic Research Council and Aarhus University. |
|
PFOA CAS No. not given. Purity not given. Ren et al. (2016). |
Human WT TTR. 50 nM. Human mutant TTRmutK15G. 500 nM. 3 expts. in triplicate. Non-GL study. GLP not stated. |
Human WT and TTRmutK15G. 1 – 1 x 10⁶ (estimated from figures. 5 minutes.
|
Competitive binding assay: NA. 50 nM F-T4. Cytotoxicity NA.
|
Binding potency to TTR. |
WT TTR. IC50 = 3.78 x 10² 5 nM. RP = 0.083 relative to T4. TTRmutK15G. No observed effect.
|
Binding affinities of TTR to PFAS were much stronger than those of TBG to the same PFAS. PFAS might bind to TTR but not TBG when ingested and enter the blood stream. Displacement of T4 from TTR may be a concern for workers occupationally exposed to PFAS but not for the general population. PFOA could completely displace T4 from TTR in production workers. |
K1 Aim of the study was to investigate the binding affinities of PFAS with human TH transport proteins TTR and TBG. Of the 16 PFAS studied, PFOA had the second highest potency relative to T4, for WT TTR. Purity not given. Funded by the Chinese Academy of Sciences and the National Natural Science Foundation of China. Authors declared no conflicts of interest. |
|
PFOA CAS No. not given. Purity not given. Ren et al. (2016). |
Human WT TBG. 50 nM.
Human mutant TBGmutR378G. 1000 nM. Human mutant. TBGmutR381G. 1000 nM. 3 expts in triplicate. Non-GL study. GLP not stated. |
Human WT TBG, TBGmutR378G and TBGmutR381G. 1 – 1 x 10⁶ (estimated from figures). 5 minutes.
|
NA. 50 nM F-T4. Cytotoxicity NA.
|
Binding potency to TBG. |
WT TBG. No observed effect. TBGmutR378G. No observed effect. TBGmutR381G. No observed effect.
|
Binding affinities of TTR to PFAS were much stronger than those of TBG to the same PFAS. PFAS might bind to TTR but not TBG when ingested and enter the blood stream. |
K1 Aim of the study was to investigate the binding affinities of PFAS with human TH transport proteins TTR and TBG. Purity not given. Funded by the Chinese Academy of Sciences and the National Natural Science Foundation of China. Authors declared no conflicts of interest. |
|
PFOA CAS No. 335-67-1. 96%. Weiss et al. (2009). |
TTR. 30nM. No. of expts. and replicates not given. Non-GL study. GLP not stated. |
1 x 101 – 1 x 10⁴. Overnight. |
NA. T4. Cytotoxicity NA. |
T4-TTR-binding. |
IC50 = 9.49 x 10² nM. RP = 0.064 relative to T4. |
Competitive binding of PFCs to TTR, as observed for human TTR in the present study with certain PFAS, may explain altered TH levels described for PFC-exposed rats and monkeys. |
K2 Aim of the study was to investigate if PFAS compete with T4 for binding to TTR. Number of experiments and replicates not given. Study funded by EU-supported program MODELKEY and the Marie Curie Research Training Network KEYBIOEFFECTS. |
Annex A Tables 14 to 24
In this guide
In this guideThis is a paper for discussion. This does not represent the views of the Committee and should not be cited.
Table 14 In vitro toxicity studies for PFCAs – PFNA
|
Substance / CAS no. / purity / reference |
Test model / replicates / GL study / GLP status |
Conc. (nM) / duration |
Negative ctrl / positive ctrl Cytotoxicity |
Endpoints |
Results |
Study author conclusions |
Comments |
|
PFNA CAS No. 375-95-1. 97%. Long et al. (2013). |
GH3 cells. 3 x 10³ cells/well (96 well plate). 3 expts. in quadruplicate. Non-GL study. GLP not stated. |
1 - 1 x 10⁵ 6 days. |
0.02% DMSO. 0.5 nM T3. LDH. Cytotoxic at >1 x 10⁶ nM. |
Thyroid hormone-dependent cell growth (T-screen assay). |
Without T3 (agonistic response). ↓cell proliferation. LOEC = 1 nM. RPE at MOEC = -2.87% relative to T3. With T3 (competitive response). ↓ T3-induced cell proliferation. LOEC = 10 nM. RPE at MOEC = -1.89% relative to T3. |
PFNA has the potential to inhibit the function of the TH system. |
K2 Aim of the study was to assess in vitro the potential impacts of seven PFAS on TH activity using the rat pituitary tumour cell line GH3 expressing intracellular TR and responding to physiological concentration of TH by proliferation (named as T-screen). T-screen assay exposure duration 6 days. Study funded by the Danish Strategic Research Council and Aarhus University. |
|
PFNA CAS No. 375-95-1 97%. Long et al. (2013). |
Hepa1.12cR cells. 6 × 10⁴ cells/per well 2 expts. in triplicate. Non-GL study. GLP not stated. |
1 - 1 x 10⁵ Duration not given. |
0.02% DMSO. 60 pM TCDD. LDH. Cytotoxic at >1 x 10⁶. |
Activation / inhibition of AhR. (AhR transcriptional activation bioassay). |
Without TCDD (agonistic response). No observed effect. With TCDD (antagonistic response). No observed effect. |
No effect on AhR. |
K1 No data on the number of cells plated. Aim of the study was to assess in vitro the potential impacts of seven PFAS on AhR function. The AhR transcriptional activity was determined by AhR-luciferase reporter gene bioassay using the stably transfected mouse Hepa1.1 2cR cell. Study funded by the Danish Strategic Research Council and Aarhus University. |
|
PFNA CAS No. not given. Purity not given. Ren et al. (2016). |
Human WT TTR. 50 nM. Human mutant TTRmutK15G. 500 nM. 3 expts. in triplicate. Non-GL study. GLP not stated. |
Human WT and TTRmutK15G. 1 – 1 x 10⁶ (estimated from figures). 5 minutes.
|
Competitive binding assay: NA. 50 nM F-T4. Cytotoxicity NA.
|
Binding potency to TTR. |
WT TTR. IC50 = 1977 ± 1698 nM. RP = 0.016 relative to T4. TTRmutK15G. IC50 = 6.00 x 10³ nM.
|
Compared to WT TTRT4 exhibited much weaker binding affinity to TTRmutK15G. Binding affinities of TTR to PFAS were much stronger than those of TBG to the same PFAS. PFAS might bind to TTR but not TBG when ingested and enter the blood stream. Displacement of T4 from TTR may be a concern for workers occupationally exposed to PFAS but not for the general population. |
K1 Aim of the study was to investigate the binding affinities of PFAS with human TH transport proteins TTR and TBG. Purity not given. Funded by the Chinese Academy of Sciences and the National Natural Science Foundation of China. Authors declared no conflicts of interest. |
|
PFNA CAS No. not given. Purity not given. Ren et al. (2016). |
Human WT TBG. 50 nM. Human mutant TBGmutR378G. 1000 nM. Human mutant. TBGmutR381G 1000 nM. 3 expts in triplicate. Non-GL study. GLP not stated. |
Human WT TBG, TBGmutR378G and TBGmutR381G. 1 – 1 x 10⁶ (estimated from figures). 5 minutes.
|
NA. 50 nM F-T4. Cytotoxicity NA.
|
Binding potency to TBG. |
WT TBG. No observed effect. TBGmutR378G. IC50 = 2.26 x 10⁵ nM. TBGmutR381G. IC50 = 7.00 x 10⁴ nM.
|
Binding affinities of TTR to PFAS were much stronger than those of TBG to the same PFAS. PFAS might bind to TTR but not TBG when ingested and enter the blood stream. |
K1 Aim of the study was to investigate the binding affinities of PFAS with human TH transport proteins TTR and TBG. Purity not given. Funded by the Chinese Academy of Sciences and the National Natural Science Foundation of China. Authors declared no conflicts of interest. |
|
PFNA CAS No. 375-95-1. 97%. Weiss et al. (2009). |
TTR. 30nM. No. of expts. and replicates not given. Non-GL study. GLP not stated. |
1 x 101 – 1 x 10⁴ . Overnight. |
NA. T4. Cytotoxicity NA. |
T4-TTR-binding. |
IC50 = 2.74 x 10³ nM. RP = 0.022 relative to T4. |
Competitive binding of PFCs to TTR, as observed for human TTR in the present study with certain PFAS, may explain altered TH levels described for PFC-exposed rats and monkeys. |
K2 Aim of the study was to investigate if PFAS compete with T4 for binding to TTR. Number of experiments and replicates not given. Study funded by EU-supported program MODELKEY and the Marie Curie Research Training Network KEYBIOEFFECTS. |
Table 15 In vitro toxicity studies for PFCAs – PFDA
|
Substance / CAS no. / purity / reference |
Test model / replicates / GL study / GLP status |
Conc. (nM) / duration |
Negative ctrl / positive ctrl Cytotoxicity |
Endpoints |
Results |
Study author conclusions |
Comments |
|
PFDA CAS No. 375-76-2. 98%. Long et al. (2013). |
GH3 cells. 3 x 10³ cells/well (96 well plate). 3 expts. in quadruplicate. |
1 - 1 x 10⁵ 6 days. |
0.02% DMSO. 0.5 nM T3. LDH. Cytotoxic at >1 x 10⁶ nM. |
Thyroid hormone-dependent cell growth (T-screen assay). |
Without T3 (agonistic response). ↓ in cell proliferation. LOEC = 10 nM. RPE at MOEC = -3.13% relative to T3. With T3 (competitive response). ↓ T3-induced cell proliferation. LOEC = 1 x 10⁵ nM RPE at MOEC = -2.57% relative to T3. |
PFDA has the potential to inhibit the function of the TH system. |
K2 Aim of the study was to assess in vitro the potential impacts of seven PFAS on TH activity using the rat pituitary tumor cell line GH3 expressing intracellular TR and responding to physiological concentration of TH by proliferation (named as T-screen). T-screen assay exposure duration 6 days. Study funded by the Danish Strategic Research Council and Aarhus University. |
|
PFDA CAS No. 335-76-2. 98%. Long et al. (2013). |
Hepa1.12cR cells. 6 × 10⁴ cells/per well 2 expts. in triplicate. Non-GL study. GLP not stated. |
1 - 1 x 10⁵ Duration not given. |
0.02% DMSO. 60 pM TCDD. LDH. Cytotoxic at >1 x 10⁶ nM. |
Activation / inhibition of AhR. (AhR transcriptional activation bioassay). |
Without TCDD (agonistic response). No observed effect. With TCDD (competitive response). ↓ T3-induced cell proliferation. LOEC = 1 nM. |
No effect on AhR. |
K1 No data on the number of cells plated. Aim of the study was to assess in vitro the potential impacts of seven PFAS on AhR function. The AhR transcriptional activity was determined by AhR-luciferase reporter gene bioassay using the stably transfected mouse Hepa1.1 2cR cell. Study funded by the Danish Strategic Research Council and Aarhus University. |
|
PFDA CAS No. not given. Purity not given. Ren et al. (2016). |
Human WT TTR. 50 nM. Human mutant TTRmutK15G. 500 nM. 3exps. in triplicate. |
Human WT and TTRmutK15G. 1 – 1 x 10⁶ (estimated from figures). 5 minutes.
|
Competitive binding assay: NA. 50 nM F-T4. Cytotoxicity NA.
|
Binding potency to TTR. |
WT TTR. IC50 = 1.62 x 10³ 0 nM. RP = 0.019 relative to T4. TTRmutK15G. IC50 = 1.83 x 10⁴ nM.
|
Compared to WT TTRT4 exhibited much weaker binding affinity to TTRmutK15G. Binding affinities of TTR to PFAS were much stronger than those of TBG to the same PFAS. PFAS might bind to TTR but not TBG when ingested and enter the blood stream. Displacement of T4 from TTR may be a concern for workers occupationally exposed to PFAS but not for the general population. |
K1 Aim of the study was to investigate the binding affinities of PFAS with human TH transport proteins TTR and TBG. Purity not given. Funded by the Chinese Academy of Sciences and the National Natural Science Foundation of China. Authors declared no conflicts of interest. |
|
PFDA CAS No. not given. Purity not given. Ren et al. (2016). |
Human WT TBG. 50 nM. Human mutant TBGmutR378G. 1000 nM. Human mutant. TBGmutR381G. 1000 nM. 3 expts. in triplicate. Non-GL study. GLP not stated. |
Human WT TBG, TBGmutR378G and TBGmutR381G. 1 – 1 x 10⁶ (estimated from figures). 5 minutes.
|
NA. 50 nM F-T4. Cytotoxicity NA.
|
Binding potency to TBG. |
WT TBG. No observed effect. TBGmutR378G IC50 = 1.52 x 10⁵ nM. TBGmutR381G. IC50 = 5.00 x 10⁵ nM.
|
Binding affinities of TTR to PFAS were much stronger than those of TBG to the same PFAS. PFAS might bind to TTR but not TBG when ingested and enter the blood stream. |
K1 Aim of the study was to investigate the binding affinities of PFAS with human TH transport proteins TTR and TBG. Purity not given. Funded by the Chinese Academy of Sciences and the National Natural Science Foundation of China. Authors declared no conflicts of interest. |
|
PFDA CAS No. 335-76-2. ≥98%. Weiss et al. (2009). |
TTR. 30nM. No. of expts. and replicates not given. Non-GL study. GLP not stated. |
1 x 101 – 1 x 10⁴. Overnight. |
NA. T4. Cytotoxicity NA. |
T4-TTR-binding. |
IC50 = 8.95 x 10³ nM. RP = 0.007 relative to T4. |
Competitive binding of PFCs to TTR, as observed for human TTR in the present study with certain PFAS, may explain altered TH levels described for PFC-exposed rats and monkeys. |
K2 Aim of the study was to investigate if PFAS compete with T4 for binding to TTR. Number of experiments and replicates not given. Authors use the acronym PFDcA for perfluorodecanoic acid. Study funded by EU-supported program MODELKEY and the Marie Curie Research Training Network KEYBIOEFFECTS. |
Table 16 In vitro toxicity studies for PFCAs – PFUnA
|
Substance / CAS no. / purity / reference |
Test model / replicates / GL study / GLP status |
Conc. (nM) / duration |
Negative ctrl / positive ctr Cytotoxicity |
Endpoints |
Results |
Study author conclusions |
Comments |
|
PFUnA CAS No. 2058-94-8. 95%. Long et al. (2013). |
GH3 cells. 3 x 10³ cells/well (96 well plate). 3 expts. in quadruplicate. Non-GL study. GLP not stated. |
1 - 1 x 10⁵ 6 days. |
0.02% EtOH. 0.5 nM T3. LDH. Cytotoxic at > 1 x 10⁵ nM. |
Thyroid hormone-dependent cell growth (T-screen assay). |
Without T3 (agonistic response). ↓ in cell proliferation. LOEC = 1 nM. RPE at MOEC = -3.59% relative to T3. With T3 (competitive response). ↓ T3-induced cell proliferation. LOEC = 1 nM. RPE at MOEC = -2.41% relative to T3. |
PFUnA has the potential to inhibit the function of the TH system. |
K2 Aim of the study was to assess in vitro the potential impacts of seven PFAS on TH activity using the rat pituitary tumor cell line GH3 expressing intracellular TR and responding to physiological concentration of TH by proliferation (named as T-screen). T-screen assay exposure duration 6 days. Study funded by the Danish Strategic Research Council and Aarhus University. |
|
PFUnA CAS No. 2058-94-8. 95%. Long et al. (2013). |
Hepa1.12cR cells. 6 × 10⁴ cells/per well. 2 expts. in triplicate. Non-GL study. GLP not stated. |
1 - 1 x 10⁵ Ethanol and culture medium. Duration not given. |
0.02% EtOH. 60 pM TCDD. LDH. Cytotoxic at > 1 x 10⁶ nM (. |
Activation / inhibition of AhR. (AhR transcriptional activation bioassay). |
Without TCDD (agonistic response). ↓ AhR-tract. LOEC = 1 x 10⁵ nM. AhR-REP No observed effect. With TCDD (antagonistic response). No observed effect.
|
No effect on AhR-tract. |
K1 No data on the number of cells plated. Aim of the study was to assess in vitro the potential impacts of seven PFAS on AhR function. The AhR transcriptional activity was determined by AhR-luciferase reporter gene bioassay using the stably transfected mouse Hepa1.1 2cR cell. Study funded by the Danish Strategic Research Council and Aarhus University. |
|
PFUnA CAS No. not given. Purity not given. Ren et al. (2016). |
Human WT TTR. 50 nM. Human mutant TTRmutK15G. 500 nM. 3 expts. in triplicate. Non-GL study. GLP not stated. |
Human WT and TTRmutK15G. 1 – 1 x 10⁶ (estimated from figures). 5 minutes.
|
Competitive binding assay: NA. 50 nM F-T4. Cytotoxicity NA.
|
Binding potency to TTR. |
WT TTR. IC50 = 5.34 x 10³ nM. RP = 0.006 relative to T4. TTRmutK15G. IC50 = 3.00 x 10⁵ nM.
|
Compared to WT TTRT4 exhibited much weaker binding affinity to TTRmutK15G. Binding affinities of TTR to PFAS were much stronger than those of TBG to the same PFAS. PFAS might bind to TTR but not TBG when ingested and enter the blood stream. Displacement of T4 from TTR may be a concern for workers occupationally exposed to PFAS but not for the general population. |
K1 Aim of the study was to investigate the binding affinities of PFAS with human TH transport proteins TTR and TBG. Purity not given. Funded by the Chinese Academy of Sciences and the National Natural Science Foundation of China. Authors declared no conflicts of interest. |
|
PFUnA CAS No. not given. Purity not given. Ren et al. (2016). |
Human WT TBG. 50 nM. Human mutant TBGmutR378G 1000 nM. Human mutant TBGmutR381G. 1000 nM. 3 expts. in triplicate. Non-GL study. GLP not stated. |
Human WT TBG, TBGmutR378G and TBGmutR381G. 1 – 1 x 10⁶ (estimated from figures) 5 minutes.
|
NA. 50 nM F-T4. Cytotoxicity NA.
|
Binding potency to TBG. |
WT TBG. No observed effect. TBGmutR378G. No observed effect. TBGmutR381G. No observed effect.
|
Binding affinities of TTR to PFAS were much stronger than those of TBG to the same PFAS. PFAS might bind to TTR but not TBG when ingested and enter the blood stream. |
K1 Aim of the study was to investigate the binding affinities of PFAS with human TH transport proteins TTR and TBG. Purity not given. Funded by the Chinese Academy of Sciences and the National Natural Science Foundation of China. Authors declared no conflicts of interest. |
|
PFUnA CAS No. 2058-94-8. 95%. Weiss et al. (2009). |
TTR. 30nM. No. of expts. and replicates not given. Non-GL study. GLP not stated. |
1 x 101 – 1 x 10⁴. Overnight. |
NA. T4. Cytotoxicity NA. |
T4-TTR-binding. |
IC50 = 2.16 x 10⁴ nM. RP = 0.003 relative to T4. |
Competitive binding of PFCs to TTR, as observed for human TTR in the present study with certain PFAS, may explain altered TH levels described for PFC-exposed rats and monkeys. |
K2 Aim of the study was to investigate if PFAS compete with T4 for binding to TTR. Number of experiments and replicates not given. Study funded by EU-supported program MODELKEY and the Marie Curie Research Training Network KEYBIOEFFECTS. |
Table 17 In vitro toxicity studies for PFCAs – PFDoA
|
Substance / CAS no. / purity / reference |
Test model / replicates / GL study / GLP status |
Conc. (nM) / duration |
Negative ctrl / positive ctrl Cytotoxicity |
Endpoints |
Results |
Study author conclusions |
Comments |
|
PFDoA CAS No. 307-55-1. 96%. Long et al. (2013). |
GH3 cells. 3 x 10³ cells/well (96 well plate). 3 expts. in quadruplicate. Non-GL study. GLP not stated. |
1 - 1 x 10⁵. 6 days. |
0.02% EtOH. 0.5 nM T3. LDH. Cytotoxic at >1 x 10⁵ nM. |
Thyroid hormone-dependent cell growth (T-screen assay). |
Without T3 (agonistic response). ↓ cell proliferation. LOEC = 1 nM. RPE at MOEC = -3.60% relative to T3. With T3 (competitive response). ↓ T3-induced cell proliferation. LOEC = 1 x 10⁴ nM RPE at MOEC = -1.76% relative to T3. |
PFDoA has the potential to inhibit the function of the TH system. |
K2 Aim of the study was to assess in vitro the potential impacts of seven PFAS on TH activity using the rat pituitary tumor cell line GH3 expressing intracellular TR and responding to physiological concentration of TH by proliferation (named as T-screen). T-screen assay exposure duration 6 days. Study funded by the Danish Strategic Research Council and Aarhus University. |
|
PFDoA CAS No. 307-55-1. 96%. Long et al. (2013). |
Hepa1.12cR cells. 6 × 10⁴ cells/per well. 2 expts. in triplicate. Non-GL study. GLP not stated. |
1 - 1 x 10⁵. Duration not given. |
0.02% EtOH. 60 pM TCDD. LDH. Cytotoxic at >1 x 10⁶ nM (1x10⁻³ M). |
Activation / inhibition of AhR. (AhR transcriptional activation bioassay). |
Without TCDD (agonistic response). ↓ AhR-tract. LOEC = 1 nM ( AhR-REP = 5 x 10⁻⁶. With TCDD (antagonistic response). ↓ AhR-tract. LOEC = 1 x. 102 nM. |
PFDoA significantly induced the AhR-tact agonistic response, although no obvious concentration–response trend was observed. PFDoA affected AhR. |
K1 Aim of the study was to assess in vitro the potential impacts of seven PFAS on AhR function. The AhR transcriptional activity was determined by AhR-luciferase reporter gene bioassay using the stably transfected mouse Hepa1.1 2cR cell. No data on the number of cells plated. Study funded by the Danish Strategic Research Council and Aarhus University. |
|
PFDoA CAS No. not given. Purity not given. Ren et al. (2016). |
Human WT TTR. 50 nM. Human mutant TTRmutK15G. 500 nM. 3 expts. in triplicate. Non-GL study. GLP not stated. |
Human WT and TTRmutK15G. 1 – 1 x 10⁶ (estimated from figures). 5 minutes.
|
Competitive binding assay: NA. 50 nM F-T4. Cytotoxicity NA.
|
Binding potency to TTR. |
WT TTR. IC50 = 8.08 x 10³ nM. RP = 0.004 relative to T4. TTRmutK15G. IC50 = 1.00 x 10⁵ nM.
|
Compared to WT TTRT4 exhibited much weaker binding affinity to TTRmutK15G. Binding affinities of TTR to PFAS were much stronger than those of TBG to the same PFAS. PFAS might bind to TTR but not TBG when ingested and enter the blood stream. Displacement of T4 from TTR may be a concern for workers occupationally exposed to PFAS but not for the general population. |
K1 Aim of the study was to investigate the binding affinities of PFAS with human TH transport proteins TTR and TBG. Purity not given. Funded by the Chinese Academy of Sciences and the National Natural Science Foundation of China. Authors declared no conflicts of interest.. |
|
PFDoA CAS No. not given. Purity not given. Ren et al. (2016). |
Human WT TBG. 50 nM. Human mutant TBGmutR378G. 1000 nM. Human mutant. TBGmutR381G. 1000 nM. 3 expts. in triplicate. Non-GL study. GLP not stated. |
Human WT. TBG, TBGmutR378G and TBGmutR381G. 1 – 1 x 10⁶ (estimated from figures). 5 minutes.
|
NA. 50 nM F-T4. Cytotoxicity NA.
|
Binding potency to TBG. |
WT TBG. No observed effect. TBGmutR378G. IC50 = 280000 nM. TBGmutR381G. No observed effect.
|
Binding affinities of TTR to PFAS were much stronger than those of TBG to the same PFAS. PFAS might bind to TTR but not TBG when ingested and enter the blood stream. |
K1 Aim of the study was to investigate the binding affinities of PFAS with human TH transport proteins TTR and TBG. Purity not given. Funded by the Chinese Academy of Sciences and the National Natural Science Foundation of China. Authors declared no conflicts of interest. |
|
PFDoA CAS No. 307-55-1. 95%. Weiss et al. (2009). |
TTR. 30nM. No. of expts. and replicates not given. Non-GL study. GLP not stated. |
1 x 101 – 1 x 10⁴. Overnight. |
NA. T4. Cytotoxicity NA. |
T4-TTR-binding. |
IC50 = 4.69 x 10⁴ nM. RP = 0.001 relative to T4. |
Competitive binding of PFCs to TTR, as observed for human TTR in the present study with certain PFAS, may explain altered TH levels described for PFC-exposed rats and monkeys. |
K2 Aim of the study was to investigate if PFAS compete with T4 for binding to TTR. Number of experiments and replicates not given. Study funded by EU-supported program MODELKEY and the Marie Curie Research Training Network KEYBIOEFFECTS. |
Table 18 In vitro toxicity studies for PFCAs – PFTrDA
|
Substance / CAS no. / purity / reference |
Cell model / no. of cells / replicates / GL study / GLP status |
Conc. (nM) / duration |
Negative ctrl / positive ctrl Cytotoxicity |
Endpoints |
Results |
Study author conclusions |
Comments |
|
PFTrDA CAS No. not given. Purity not given. Ren et al. (2016). |
Human WT TTR. 50 nM. Human mutant TTRmutK15G. 500 nM. 3 expts. in triplicate. Non-GL study. GLP not stated. |
Human WT and TTRmutK15G. 1 – 1 x 10⁶ (estimated from figures). 5 minutes.
|
Competitive binding assay: NA. 50 nM F-T4. Cytotoxicity NA.
|
Binding potency to TTR. |
WT TTR. IC50 = 5.37 x 10³ nM. RP = 0.006 relative to T4. TTRmutK15G. IC50 = 5.52 x 10⁴ nM.
|
Compared to WT TTRT4 exhibited much weaker binding affinity to TTRmutK15G. Binding affinities of TTR to PFAS were much stronger than those of TBG to the same PFAS. PFAS might bind to TTR but not TBG when ingested and enter the blood stream. Displacement of T4 from TTR may be a concern for workers occupationally exposed to PFAS but not for the general population. |
K1 Aim of the study was to investigate the binding affinities of PFAS with human TH transport proteins TTR and TBG. Purity not given. Authors use the acronym PFTA for perfluorotridecanoic acid. Funded by the Chinese Academy of Sciences and the National Natural Science Foundation of China. Authors declared no conflicts of interest. |
|
PFTrDA CAS No. not given. Purity not given. Ren et al. (2016). |
Human WT TBG. 50 nM. Human mutant TBGmutR378G. 1000 nM. Human mutant. TBGmutR381G 1000 nM. 3 expts. in triplicate. Non-GL study. GLP not stated. |
Human WT TBG, TBGmutR378G and TBGmutR381G. 1 – 1 x 10⁶ (estimated from figures). 5 minutes.
|
NA. 50 nM F-T4. Cytotoxicity NA.
|
Binding potency to TBG. |
WT TBG. IC50 = 1.70 x 10⁵ nM. RP = 2 x 10⁻⁴ relative to T4. TBGmutR378G. IC50 = 2.70 x 10⁵ nM. TBGmutR381G. IC50 = > 4.00 x 10⁵ nM.
|
PFTrDA and PFTeDA and were the only PFAS that bound to TBG, which is different to the pattern of binding of PFAS to TTR. Binding affinities of TTR to PFAS were much stronger than those of TBG to the same PFAS. PFAS might bind to TTR but not TBG when ingested and enter the blood stream. |
K1 Aim of the study was to investigate the binding affinities of PFAS with human TH transport proteins TTR and TBG. Purity not given. Authors use the acronym PFTA for perfluorotridecanoic acid. Funded by the Chinese Academy of Sciences and the National Natural Science Foundation of China. Authors declared no conflicts of interest. |
Table 19 In vitro toxicity studies for PFCAs – PFTeDA
|
Substance / CAS no. / purity / reference |
Cell model / no. of cells / replicates / GL study / GLP status |
Conc. (nM) / duration |
Negative ctrl / positive ctrl Cytotoxicity |
Endpoints |
Results |
Study author conclusions |
Comments |
|
PFTeDA CAS No. not given. Purity not given.
Ren et al. (2016). |
Human WT TTR. 50 nM. Human mutant TTRmutK15G. 500 nM. 3 expts. in triplicate. Non-GL study. GLP not stated. |
Human WT and mutant TTRmutK15G. 1 – 1 x 10⁶ (estimated from figures). 5 minutes.
|
Competitive binding assay: NA. 50 nM F-T4. Cytotoxicity NA.
|
Binding potency to TTR. |
WT TTR. IC50 = 6.08 x 10³ nM. RP = 0.005 relative to T4. TTRmutK15G. IC50 = 1.83 x 10⁵ nM.
|
Binding affinities of TTR to PFAS were much stronger than those of TBG to the same PFAS. PFAS might bind to TTR but not TBG when ingested and enter the blood stream. Displacement of T4 from TTR may be a concern for workers occupationally exposed to PFAS but not for the general population. |
K1 Aim of the study was to investigate the binding affinities of PFAS with human TH transport proteins TTR and TBG. Purity not given. Authors use the acronym PFTdA for perfluorotetradecanoic acid. Funded by the Chinese Academy of Sciences and the National Natural Science Foundation of China. Authors declared no conflicts of interest. |
|
PFTeDA CAS No. not given. Purity not given. Ren et al. (2016). |
Human WT TBG 50 nM. Human mutant TBGmutR378G. 1000 nM. Human mutant TBGmutR381G 1000 nM. 3 expts in triplicate Non-GL study. GLP not stated. |
Human WT TBG, TBGmutR378G and TBGmutR381G. 1 – 1 x 10⁶ (estimated from figures). 5 minutes.
|
NA. 50 nM F-T4. Cytotoxicity NA.
|
Binding potency to TBG. |
WT TBG. IC50 = 1.90 x 10⁵ nM. RP = 2 x 10⁻⁴ relative to T4. TBGmutR378G IC50 = 2.70 x 10⁵ nM. TBGmutR381G IC50 = > 4.00 x 10⁵ nM.
|
PFTeDA and PFTrDA were the only PFAS that bound to TBG, which is different to the pattern of binding of PFAS to TTR. Binding affinities of TTR to PFAS were much stronger than those of TBG to the same PFAS. PFAS might bind to TTR but not TBG when ingested and enter the blood stream. |
K1 Aim of the study was to investigate the binding affinities of PFAS with human TH transport proteins TTR and TBG. Purity not given. Authors use the acronym PFTdA for perfluorotetradecanoic acid. Funded by the Chinese Academy of Sciences and the National Natural Science Foundation of China. Authors declared no conflicts of interest. |
|
PFTeDA CAS No. 376-06-7. 96%. Weiss et al. (2009). |
TTR. 30nM. No. of expts. and replicates not given. Non-GL study. GLP not stated. |
1 x 101 – 1 x 10⁴ Overnight. |
NA. T4. Cytotoxicity NA. |
T4-TTR-binding. |
IC50 = 2.90 x 10⁴ nM. RP = 0.002 relative to T4. |
Competitive binding of PFCs to TTR, as observed for human TTR in the present study with certain PFAS, may explain altered TH levels described for PFC-exposed rats and monkeys. |
K2 Aim of the study was to investigate if PFAS compete with T4 for binding to TTR. Number of experiments and replicates not given. Authors use the acronym PFTdA for perfluorotetradecanoic acid. Study funded by EU-supported program MODELKEY and the Marie Curie Research Training Network KEYBIOEFFECTS. |
Table 20 In vitro toxicity studies for PFPAs – C6 PFPA
|
Substance / CAS no. / purity / reference |
Test model / replicates / GL study / GLP status |
Conc. (nM) / duration |
Negative ctrl / positive ctrl Cytotoxicity |
Endpoints |
Results |
Study author conclusions |
Comments |
|
C6 PFPA CAS No. not given. Purity not given. Croce et al. (2019). |
WST-1 assay: FRTL-5 cells. 2 x 10⁴ cells/well (96 well plate). 3 expts. No. of replicates not given, cAMP assay: No. cells not given (80% confluence). 3 expts. No. of replicates not given, Non-GL study GLP not stated . |
0, 1 x 10⁻¹, 1 x 10, 1 x 10², 1 x 10³, 1 x 10⁴, 1 x 10⁵ 0 24 hr.
|
6H medium. 1 mU/L TSH (cAMP assay). WST-1 assay. No effect on cytotoxicity (data only reported in figures). |
Thyroid cell viability. TSH-stimulated cAMP production. |
No effect on inhibition of TSH-induced. cAMP production in FRTL-5 cells (data only reported in figures). |
cAMP production is not modulated by C6 PFPA . The study excludes an interference with the TSH-dependent control of thyroid function as a mechanism by which C6 PFPA would interfere with thyroid function. |
K1 Aim of the study was to investigate whether C6 PFPA could affect thyroid cell viability and/or interfere with the functional effect of TSH by investigating TSH-induced cAMP production in FRTL-5 cells. Number of replicates not given. Purity not given. No details of funding given. Authors declare no conflict of interest. |
Table 21 In vitro toxicity studies for FTOH – 6:2 FTOH, 8:2 FTOH and 10:2 FTOH
|
Substance / CAS no. / purity / reference |
Test model / replicates / GL study / GLP status |
Conc. (nM) / duration |
Negative ctrl / positive ctrl Cytotoxicity |
Endpoints |
Results |
Study author conclusions |
Comments |
|
6:2 FTOH CAS No. not given. Purity not given. Ren et al. (2016). |
Human WT TTR. 50 nM. Human mutant TTRmutK15G. 500 nM. 3 expts. in triplicate. Non-GL study. GLP not stated. |
Human WT and TTRmutK15G. 1 – 1 x 10⁶ (estimated from figures). 5 minutes.
|
Competitive binding assay: NA. 50 nM F-T4. Cytotoxicity NA.
|
Binding potency to TTR. |
WT TTR. No observed effect. TTRmutK15G. No observed effect.
|
WT TTR showed no binding towards the three fluorotelomer alcohols. No interaction between TTRmutK15G and the three fluorotelomer alcohols was observed.
|
K1 Aim of the study was to investigate the binding affinities of PFAS with human TH transport proteins TTR and TBG. Purity not given. Funded by the Chinese Academy of Sciences and the National Natural Science Foundation of China. Authors declared no conflicts of interest. |
|
6:2 FTOH CAS No. not given. Purity not given. Ren et al. (2016). |
Human WT TBG. 50 nM. Human mutant TBGmutR378G 1000 nM. Human mutant. TBGmutR381G 1000 nM. 3 expts. in triplicate. Non-GL study. GLP not stated. |
Human WT TBG and TBGmutR378G. 1 – 1 x 10⁶ (estimated from figures). 5 minutes. Human mutant. TBGmutR381G. 1 – 1 x 10⁵ (est. from figures) 5 minutes. |
NA. 50 nM F-T4. Cytotoxicity NA.
|
Binding potency to TBG. |
WT TBG. No observed effect. TBGmutR378G. No observed effect. TBGmutR381G. No observed effect.
|
No specific comments on TBG and the three fluorotelomer alcohols.
|
K1 Aim of the study was to investigate the binding affinities of PFAS with human TH transport protein TTR and TBG. Purity not given. Funded by the Chinese Academy of Sciences and the National Natural Science Foundation of China. Authors declared no conflicts of interest. |
|
6:2 FTOH CAS No. 647-42-7. 98%. Weiss et al. (2009). |
TTR. 30nM. No. of expts. and replicates not given. Non-GL study. GLP not stated. |
1 x 101 – 1 x 10⁴. Overnight. |
NA. T4. Cytotoxicity NA. |
T4-TTR-binding. |
IC50 = ND. RP = ND relative to T4. |
RP not calculated due to IC50 falling below the laboratory detection limit. Competitive binding of PFCs to TTR, as observed for human TTR in the present study with certain PFAS, may explain altered TH levels described for PFC-exposed rats and monkeys. |
K2 Aim of the study was to investigate if PFAS compete with T4 for binding to TTR. Number of experiments and replicates not given. Study funded by EU-supported program MODELKEY and the Marie Curie Research Training Network KEYBIOEFFECTS. |
|
8:2 FTOH CAS No. not given. Purity not given. Ren et al. (2016). |
Human WT TTR. 50 nM. Human mutant TTRmutK15G. 500 nM. 3 expts in triplicate. Non-GL study GLP not stated. |
Human WT. 1 – 1 x 10⁶ (estimated from figures). 5 minutes. Human mutant TTRmutK15G. 1 – 1 x 10⁶ (estimated from figures). 5 minutes.
|
Competitive binding assay: NA. 50 nM F-T4. Cytotoxicity NA.
|
Binding potency to TTR. |
WT TTR. No observed effect. TTRmutK15G No observed effect.
|
WT TTR showed no binding towards the three fluorotelomer alcohols. No interaction between TTRmutK15G and the three fluorotelomer alcohols was observed.
|
K1 Aim of the study was to investigate the binding affinities of PFAS with human TH transport proteins TTR and TBG. Purity not given. Funded by the Chinese Academy of Sciences and the National Natural Science Foundation of China. Authors declared no conflicts of interest. |
|
8:2 FTOH CAS No. not given. Purity not given. Ren et al. (2016). |
Human WT TBG. 50 nM. Human mutant TBGmutR378G. 1000 nM. Human mutant. TBGmutR381G. 1000 nM. 3 expts. in triplicate. Non-GL study GLP not stated. |
Human WT TBG. 1 – 1 x 10⁶ (estimated from figures). 5 minutes. Human mutant TBGmutR378G. 1 – 1 x 10⁶ (estimated from figures). 5 minutes. Human mutant. TBGmutR381G. 1 – 1 x 10⁶ (estimated from figures) 5 minutes. |
NA. 50 nM F-T4. Cytotoxicity NA.
|
Binding potency to TBG. |
WT TBG. No observed effect. TBGmutR378G. No observed effect. TBGmutR381G. No observed effect.
|
No specific comments on TBG and the three fluorotelomer alcohols.
|
K1 Aim of the study was to investigate the binding affinities of PFAS with human TH transport protein TTR and TBG. Purity not given. Funded by the Chinese Academy of Sciences and the National Natural Science Foundation of China. Authors declared no conflicts of interest. |
|
8:2 FTOH CAS No. 678-39-7. 98%. Weiss et al. (2009). |
TTR. 30nM. No. of expts. and replicates not given. Non-GL study. GLP not stated. |
1 x 101 – 1 x 10⁴. Overnight. |
NA. T4. Cytotoxicity NA. |
T4-TTR-binding. |
IC50 = ND. RP = ND. relative to T4. |
RP not calculated due to IC50 falling below the laboratory detection limit. Competitive binding of PFCs to TTR, as observed for human TTR in the present study with certain PFAS, may explain altered TH levels described for PFC-exposed rats and monkeys. |
K2 Aim of the study was to investigate if PFAS compete with T4 for binding to TTR. Number of experiments and replicates not given. Study funded by EU-supported program MODELKEY and the Marie Curie Research Training Network KEYBIOEFFECTS. |
|
10:2 FTOH CAS No. not given. Purity not given. Ren et al. (2016). |
Human WT TBG. 50 nM. Human mutant TBGmutR378G. 1000 nM. Human mutant. TBGmutR381G. 1000 nM. 3 expts. In triplicate. Non-GL study GLP not stated. |
Human WT TBG. 1 – 1 x 10⁶ (estimated from figures). 5 minutes. Human mutant TBGmutR378G. 1 – 1 x 10⁶ (estimated from figures). 5 minutes. Human mutant TBGmutR381G. 1 – 1 x 10⁶ (estimated from figures). 5 minutes. |
NA. 50 nM F-T4. Cytotoxicity NA.
|
Binding potency to TBG. |
WT TBG. No observed effect. TBGmutR378G. No observed effect. TBGmutR381G. No observed effect.
|
No specific comments on TBG and the three fluorotelomer alcohols.
|
K1 Aim of the study was to investigate the binding affinities of PFAS with human TH transport protein TTR and TBG. Purity not given. Funded by the Chinese Academy of Sciences and the National Natural Science Foundation of China. Authors declared no conflicts of interest. |
Table 22 In vitro toxicity studies for FOSE – N-MeFOSA, N-EtFOSA, N-MeFOSE and N-EtFOSE
|
Substance / CAS no. / purity / reference |
Test model / replicates / GL study / GLP status |
Conc. (nM) / duration |
Negative ctrl / positive ctrl Cytotoxicity |
Endpoints |
Results |
Study author conclusions |
Comments |
|
N-MeFOSA CAS No. 31506-32-8. ˃99%. Weiss et al. (2009). |
TTR. 30nM. No. of expts. and replicates not given. Non-GL study. GLP not stated. |
1 x 101 – 1 x 10⁴. Overnight. |
NA. T4. Cytotoxicity NA. |
T4-TTR-binding. |
IC50 = ND. RP = ND relative to T4. |
RP not calculated due to IC50 falling below the laboratory detection limit. Competitive binding of PFCs to TTR, as observed for human TTR in the present study with certain PFAS, may explain altered TH levels described for PFC-exposed rats and monkeys. |
K2 Aim of the study was to investigate if PFAS compete with T4 for binding to TTR. Number of experiments and replicates not given. Study funded by EU-supported program MODELKEY and the Marie Curie Research Training Network KEYBIOEFFECTS. |
|
N-EtFOSA CAS No. 4151-50-2 ˃99%. Weiss et al. (2009). |
TTR. 30nM. No. of expts. and replicates not given Non-GL study. GLP not stated. |
1 x 101 – 1 x 10⁴ . Overnight. |
NA. T4. Cytotoxicity NA. |
T4-TTR-binding. |
IC50 = ND. RP = ND relative to T4. |
RP not calculated due to IC50 falling below the laboratory detection limit. Competitive binding of PFCs to TTR, as observed for human TTR in the present study with certain PFAS, may explain altered TH levels described for PFC-exposed rats and monkeys. |
K2 Aim of the study was to investigate if PFAS compete with T4 for binding to TTR. Number of experiments and replicates not given. Study funded by EU-supported program MODELKEY and the Marie Curie Research Training Network KEYBIOEFFECTS. |
|
N-MeFOSE CAS No. 24448-09-7. ˃99%. Weiss et al. (2009). |
TTR. 30nM. No. of expts. and replicates not given. Non-GL study. GLP not stated. |
1 x 101 – 1 x 10⁴. Overnight. |
NA. T4. Cytotoxicity NA. |
T4-TTR-binding. |
IC50 = ND. RP = ND relative to T4. |
RP not calculated due to IC50 falling below the laboratory detection limit. Competitive binding of PFCs to TTR, as observed for human TTR in the present study with certain PFAS, may explain altered TH levels described for PFC-exposed rats and monkeys. |
K2 Aim of the study was to investigate if PFAS compete with T4 for binding to TTR. Number of experiments and replicates not given. Study funded by EU-supported program MODELKEY and the Marie Curie Research Training Network KEYBIOEFFECTS. |
|
N-EtFOSE CAS No. 1691-99-2. ˃99%. Weiss et al. (2009). |
TTR. 30nM. No. of expts. and replicates not given. Non-GL study. GLP not stated. |
1 x 101 – 1 x 10⁴. Overnight. |
NA. T4. Cytotoxicity NA. |
T4-TTR-binding. |
IC50 = ND RP = ND relative to T4. |
RP not calculated due to IC50 falling below the laboratory detection limit. Competitive binding of PFCs to TTR, as observed for human TTR in the present study with certain PFAS, may explain altered TH levels described for PFC-exposed rats and monkeys. |
K2 Aim of the study was to investigate if PFAS compete with T4 for binding to TTR. Number of experiments and replicates not given. Study funded by EU-supported program MODELKEY and the Marie Curie Research Training Network KEYBIOEFFECTS. |
Table 23 In vitro toxicity studies for FOSA – PFOSA, N,N-Me2FOSA
|
Substance / CAS no. / purity / reference |
Test model / replicates / GL study / GLP status |
Conc. (nM) / duration |
Negative ctrl / positive ctr Cytotoxicity |
Endpoints |
Results |
Study author conclusions |
Comments |
|
PFOSA CAS No. 754-91-6. ˃99%. Weiss et al. (2009). |
TTR. 30nM. No. of expts and replicates not given. Non-GL study. GLP not stated. |
1 x 101 – 1 x 10⁴. Overnight. |
NA. T4. Cytotoxicity NA. |
T4-TTR-binding. |
IC50 = 6124 nM. RP = ND relative to T4. |
RP not calculated due to IC50 falling below the laboratory detection limit. Competitive binding of PFCs to TTR, as observed for human TTR in the present study with certain PFAS, may explain altered TH levels described for PFC-exposed rats and monkeys. |
K2 Aim of the study was to investigate if PFAS compete with T4 for binding to TTR. Number of experiments and replicates not given. Authors use the acronym FOSA for perfluorooctane sulfonamide. Study funded by EU-supported program MODELKEY and the Marie Curie Research Training Network KEYBIOEFFECTS. |
|
N,N-Me2FOSA CAS No. Not given. ˃99%. Weiss et al. (2009). |
TTR. 30nM. No. of expts. and replicates not given. Non-GL study. GLP not stated. |
1 x 101 – 1 x 10⁴. Overnight. |
NA. T4. Cytotoxicity NA. |
T4-TTR-binding. |
IC50 = ND. RP = ND relative to T4. |
RP not calculated due to IC50 falling below the laboratory detection limit. Competitive binding of PFCs to TTR, as observed for human TTR in the present study with certain PFAS, may explain altered TH levels described for PFC-exposed rats and monkeys. |
K2 Aim of the study was to investigate if PFAS compete with T4 for binding to TTR. Number of experiments and replicates not given. Study funded by EU-supported program MODELKEY and the Marie Curie Research Training Network KEYBIOEFFECTS. |
Table 24 In vitro toxicity studies for new generation substitutes - C6O4 and F-53B
|
Substance / CAS no. / purity / reference |
Test model / replicates / GL study / GLP status |
Conc. (nM) / duration |
Negative ctrl / positive ctrl Cytotoxicity |
Endpoints |
Results |
Study author conclusions |
Comments |
|
C6O4 CAS No. not given. Purity not given. Coperchini et al. (2021).
|
FRTL-5 cells. NHT cells. WST-1 assay: 2 x 10⁴ cells/well. (96 well plate). No. of expts. and replicates not given. Annexin V‑FITC/PI assay: 1 x 10⁴ cells/well. (24 well plate). No. of expts. and replicates not given. Cell proliferation assay: 500 cells/well (12 well plate). No. of expts. and replicates not given.
ROS production (C6O4 and FTRL5 cells only): 5 x 10⁴ cells/well (24 well plate)
Non-GL study. GLP not stated. |
WST-1 assay: 0, 2.94 x 10⁻², 2.94 x 10⁻¹ 2.94, 2.94 x 101 or 2.94 x 10². (originally reported as 0, 0.01, 0.1, 1, 10 or 100 ng/mL) 24, 48, 72, or 144 hr. Annexin V‑FITC/PI assay: 0 or 2.94 x 10². (originally reported as 0 or 100 ng/mL). 144 hr. Cell proliferation assay: 0, 2.94 x 10⁻², 2.94 x 10⁻¹ 2.94, 2.94 x 101 or 2.94 x 10². (originally reported as 0, 0.01, 0.1, 1, 10 or 100 ng/mL)6 days. ROS production: 0, 2.94 x 10⁻², 2.94 x 10⁻¹ 2.94, 2.94 x 101 or 2.94 x 10² 0, 2.94 x 10⁻², 2.94 x 10⁻¹ 2.94, 2.94 x 101 or 2.94 x 10². (originally reported as 0, 0.01, 0.1, 1, 10 or 100 ng/mL). 10, 20 or 30 minutes. |
6H medium. NA. WST-1 assay No effect on cytotoxicity (data only reported in figures). |
Cell viability. Cell death (apoptosis), late apoptotic, or necrotic cells. Cell proliferation. ROS production. |
No effect on FRTL5 or NHT cell viability at any concentration and/or time points with no induction of necrosis/apoptosis (data only reported in figures). ROS production not induced in FTRL5 cells (data only reported in figures).
|
The present in vitro study constitutes the first evaluation of the potential adverse effects of the new emerging PFAS C6O4 in cultured rat and human thyroid cells, suggesting its safety for thyroid cells in vitro. |
K2 Aim of the study was to evaluate the in vitro effects of C6O4 compared with PFOA and PFOS on primary cultures of normal human thyroid cells (NHT) in terms of cell viability, proliferation rate, and ROS production, after both short and long time of exposure. Number of experiments and replicates not given. Conversion from ng/mL based on a molecular weight of 340.05 for CAS No. 1190931-41-9. Funded by Università degli Studi di Pavia. Authors declared no conflicts of interest.
|
|
C6O4 CAS No. not given. Purity not given. De Toni et al. (2022).
|
FRTL-5 cells. Cell growth: 3-8 x 10³ cells/well (96 well plate). 3 expts. in triplicate. cAMP assay: No. cells not given (80% confluence). 3 expts. in triplicate. Iodide uptake assay: No. cells not given (60% confluence) (96 well plate). 3 expts. in triplicate. Non-GL study. GLP not stated. |
0, 2.9 x 10⁻², 2.9 x 10-, 2.9, 2.9 x 101 or 2.9 x 10², (originally reported as 0, 0.1, 1, 10 or 100 ng/mL). Cell growth: 24 hr. cAMP assay: 72 hr. Iodide uptake assay: 24 hr. |
Coon′s modified Ham′s F12. Medium. 1 mU/LTSH (cAMP assay) 1 mU/LTSH and NaSCN (Iodide uptake assay). MTT assay. No effect on cytotoxicity up to 2.9 x 10² nM (100 ng/mL) (data only reported in figures). |
Cell growth and membrane fluidity. Total RNA. TSH-stimulated cAMP production Iodide uptake. |
No effect on basal iodide uptake in cells in the absence of TSH stimulation. ↑ increase in iodide uptake in cells following TSH stimulation from 2.9 x 10⁻² nM (0.1 ng/mL) (data only reported in figures). No effect on mean fluorescence intensity of MC540 staining (a proxy of membrane fluidity) (data only reported in figures). ↓ intracellular cAMP levels at 2.9 x 10² nM (100 ng/mL) (data only reported in figures). No effect on NIS and TPO gene expression following TSH stimulation (data only reported in figures). |
Legacy and new generation PFAS can differentially influence TSH dependent signalling pathways through the direct interaction with TSH-R. |
K2 Aim of the study was to assess the potential disrupting effect of PFAS, on FRTL-5 cells via cell function, cell toxicity, membrane biophysical properties and computational modelling of the possible interaction with TSH-Receptor. Number of replicates not given, Purity not given. Conversion from ng/mL based on a molecular weight of 340.05 for CAS No. 1190931-41-9. Study funded by Solvay Specialty Polymers Italy S.p.A. The funder had no role in the design and conduct of the study; collection, management, analysis, and interpretation of the data, or approval of the manuscript; and decision to submit the manuscript for publication. |
|
F-53B CAS No. 73606-19-6. >99%. Deng et al. (2018). |
GH3 cells. 5000 cells/well (96 well plate). No. of expts not given. Six replicates, Non-GL study. GLP not stated. |
0, 1.75 x 10⁴, 1.75 x 10⁵, 1.75 x 10⁶, 3.5 x 10⁶, 8.75 x 10⁶ or 1.75 x 10⁷. (originally reported as 0, 0.01, 0.1, 1, 2, 5 or 10 mg/L) 24 hr. |
Dulbecco's Modified Eagle's Medium/Ham's F-12 medium. 1.5 µg/L T3. Cytotoxicity not assessed.
|
Thyroid hormone-dependent cell growth (T-screen assay). |
↑ relative cell proliferation from 1.75 x 10⁴ nM (0.01 mg/L) (data only reported in figures). |
F-53B is a strong TH agonist. |
K2 Aim of the study was to investigate the thyroid disrupting potential of F-53B at environmentally relevant concentrations in rat pituitary GH3 cells (and zebrafish larvae). Cytotoxicity of F-53B to GH3 cells not assessed. Number of experiments not given. Conversion from ng/mL based on a molecular weight of 570.67 for CAS No. 73606-19-6. Study funded by National Natural Science Foundation of China, Jiangxi Province Natural Science Foundation of China, Key Program for Science and Technology Cooperation Projects of Jiangxi, China, Jiangxi Science and Technology Project, Key Program of Jiangxi Academy of Sciences and Program of State Administration of Foreign Experts Affairs. |
Annex B
In this guide
In this guide
This is a paper for discussion. This does not represent the views of the Committee and should not be cited.
Literature search
Search terms
1. Search terms presented in the EFSA opinion were replicated for the searches.
Scopus (search terms in all fields)
( TITLE-ABS-KEY ( perfluoro* OR pfos OR pfoa OR pfas OR "fluorotelomer alcohol" OR polyfluoro* ) AND TITLE-ABS-KEY ( toxicity OR *toxi* OR acute OR subacute OR subchronic OR chronic OR mutagen* OR carcino* OR cardiotox* OR genotox* OR reprotox* OR nephrotox* OR neurotox* OR hepatotox* OR immune OR immuno* OR hematotox* OR haematotox* OR cytotox* OR "developmental tox*" OR thyroid OR endocri* OR endocrine OR estrogen OR oestrogen OR fertility OR tumour OR tumor OR gestat* OR lactat* OR "DNA damage" OR mortality OR adverse OR "adverse effect" OR "blood lipid*" OR "serum lipid*" OR ppar OR "ex vivo" OR "in vitro" OR "in vivo" OR cell* OR tissue* ) AND TITLE-ABS-KEY ( rodent* OR mouse OR animal* OR rat* OR mice OR rabbit* OR dog* OR monkey* ) ) AND ( EXCLUDE ( SUBJAREA , "CHEM" ) OR EXCLUDE ( SUBJAREA , "MATE" ) OR EXCLUDE ( SUBJAREA , "CENG" ) OR EXCLUDE ( SUBJAREA , "ENGI" ) OR EXCLUDE ( SUBJAREA , "PHYS" ) OR EXCLUDE ( SUBJAREA , "COMP" ) OR EXCLUDE ( SUBJAREA , "EART" ) OR EXCLUDE ( SUBJAREA , "ENER" ) OR EXCLUDE ( SUBJAREA , "SOCI" ) OR EXCLUDE ( SUBJAREA , "ECON" ) OR EXCLUDE ( SUBJAREA , "BUSI" ) OR EXCLUDE ( SUBJAREA , "ARTS" ) ) AND ( LIMIT-TO ( DOCTYPE , "ar" ) OR LIMIT-TO ( DOCTYPE , "re" ) ) AND ( LIMIT-TO ( LANGUAGE , "English" ) OR EXCLUDE ( LANGUAGE , "Russian" ) OR EXCLUDE ( LANGUAGE , "Spanish" ) ) AND ( EXCLUDE ( LANGUAGE , "Italian" ) ) AND ( EXCLUDE ( SUBJAREA , "MATH" ) ): 5449
PubMed (search terms in title and abstract)
(("perfluoro*"[Title/Abstract] OR "pfos"[Title/Abstract] OR "pfoa"[Title/Abstract] OR "pfas"[Title/Abstract] OR "fluorotelomer alcohol"[Title/Abstract] OR polyfluoro*) AND ("toxicity"[Title/Abstract] OR "toxi*"[Title/Abstract] OR "acute"[Title/Abstract] OR "subacute"[Title/Abstract] OR "subchronic"[Title/Abstract] OR "chronic"[Title/Abstract] OR "mutagen*"[Title/Abstract] OR "carcino*"[Title/Abstract] OR "cardiotox*"[Title/Abstract] OR "genotox*"[Title/Abstract] OR "reprotox*"[Title/Abstract] OR "nephrotox*"[Title/Abstract] OR "neurotox*"[Title/Abstract] OR "hepatotox*"[Title/Abstract] OR "immune"[Title/Abstract] OR "immuno*"[Title/Abstract] OR "hematotox*"[Title/Abstract] OR "haematotox*"[Title/Abstract] OR "cytotox*"[Title/Abstract] OR "developmental tox*"[Title/Abstract] OR "thyroid"[Title/Abstract] OR "endocri*"[Title/Abstract] OR "endocrine"[Title/Abstract] OR "estrogen"[Title/Abstract] OR "oestrogen"[Title/Abstract] OR "fertility"[Title/Abstract] OR "tumour"[Title/Abstract] OR "tumor"[Title/Abstract] OR "gestat*"[Title/Abstract] OR "lactat*"[Title/Abstract] OR "DNA damage"[Title/Abstract] OR "mortality"[Title/Abstract] OR "adverse"[Title/Abstract] OR "adverse effect"[Title/Abstract] OR "blood lipid*"[Title/Abstract] OR "serum lipid*"[Title/Abstract] OR "ppar"[Title/Abstract] OR "ex vivo"[Title/Abstract] OR "in vitro"[Title/Abstract] OR "in vivo"[Title/Abstract] OR "cell*"[Title/Abstract] OR "tissue*"[Title/Abstract]) AND ("rodent*"[Title/Abstract] OR "mouse"[Title/Abstract] OR "animal*"[Title/Abstract] OR "rat"[Title/Abstract] OR "mice"[Title/Abstract] OR "rabbit*"[Title/Abstract] OR "dog"[Title/Abstract] OR "monkey*"[Title/Abstract])) AND (english[Filter])): 2569.
2. Data from both searches were combined and duplicates removed giving a total of 3397 papers.
3. To identify papers on specific endpoints key words were used to search in all fields in Endnote. Key words included, but were not limited to,
- Thyro,
- TSH,
- T3,
- T4,
- Thyroxine,
- Triiodothyronine,
- Hypertrophy,
- Thyroid stimulating hormone.
Inclusion and exclusion criteria
4. Generic inclusion criteria and exclusion criteria were applied to the data retrieved (Table 25).
Table 25. Generic inclusion and exclusion criteria used during primary screening of titles
|
Inclusion Criteria |
Exclusion criteria |
|
Articles in English language.
|
Articles in other languages. |
|
Peer reviewed publications. |
Expert opinions by authoritative bodies commentaries, editorials and letters to the editor. PhD Theses. Extended abstracts, conference proceeding. |
|
Relevant reviews. |
Studies not reporting original results, including comments, letters or editorials. Papers without an abstract. |
|
Papers concerning toxicological effects. |
Papers concerned only with methodology, mechanism or mode of action. |
|
In vitro studies, In silico studies.
|
In vivo studies, Ex vivo studies, Human (epidemiology) studies. |
|
None. |
Any experimental animal study, all ages, male and females. |
|
Any PFAS. |
Mixtures of PFAS. |
Annex C
In this guide
In this guideThis is a paper for discussion. This does not represent the views of the Committee and should not be cited.
Table 26 PFSA chemical structures and molecular weight
CAS Number is either that given in the study, or identified based on the chemical name given in the study.
|
PFAS |
CAS no. |
Structure (source: ChemSpider) |
Molecular weight (g/mol) |
|
PFBS |
375-73-5 [sulphonate 45187-15-3] [potassium salt 29420-49-3] |
The picture is the chemical structure of PFBS, shown as a vertical image in black line and green, brown and red text. |
300.10 [299.09] [338.19] |
|
PFHxS |
355-46-4 [sulphonate 108427-53-8] [potassium salt 3871-99-6] |
The picture is the chemical structure of PFHxS, shown as a horizontal image in black line and green, brown and red text.
|
400.12 [399.11] [438.21] |
|
PFOS |
1763-23-1 [sulphonate 45298-90-6] [potassium salt 2795-39-3] |
The picture is the chemical structure of PFOS, shown as a vertical image in black line and green, brown and red text.
|
500.13 [499.12] [538.22] |
|
L-PFDS
|
No CAS No. found |
No structure available |
622.1 Weiss et al. (2009). |
Table 27 PFSIA chemical structure and molecular weight
CAS Number is either that given in the study, or identified based on the chemical name given in the study.
|
PFAS |
CAS no. |
Structure (source: ChemSpider) |
Molecular weight (g/mol) |
|
L-PFOSi
|
No CAS No. located |
No structure available |
506.1 Weiss et al. (2009). |
Table 28 PFCA chemical structure and molecular weight
CAS Number is either that given in the study, or identified based on the chemical name given in the study.
|
PFAS |
CAS no. |
Structure (source: ChemSpider) |
Molecular weight (g/mol) |
|
PFBA |
375-22-4 |
The picture is the chemical structure of PFBA, shown as an angled vertical image in black line with green and red text. |
214.04 |
|
PFPeA |
2706-90-3 |
The picture is the chemical structure of PFPeA, shown as an angled vertical image in black line with green and red text.
|
264.05 |
|
PFHxA |
307-24-4 |
The picture is the chemical structure of PFHxA, shown as an angled vertical image in black line with green and red text. |
314.05
|
|
7H-PFHpA |
1546-95-8 |
The picture is the chemical structure of 7H-PFHpA, shown as an angled vertical image in black line with green and red text.
|
346.07 |
|
6:2 FTUA |
70887-88-6 |
The picture is the chemical structure of 6:2 FTUA, shown as an horizontal image in black line with green and red text.
|
358.08 |
|
PFHpA |
375-85-9 |
The picture is the chemical structure of PFHpA, shown as an horizontal image in black line with green and red text.
|
364.06 |
|
PFOA |
335-67-1 |
The picture is the chemical structure of PFOA, shown as an angled vertical image in black line with green and red text. |
414.07 |
|
PFNA |
375-95-1 |
The picture is the chemical structure of PFNA, shown as an angled vertical image in black line with green and red text. |
464.08 |
|
PFDA |
335-76-2 |
The picture is the chemical structure of PFDA, shown as a horizontal image in black line with green and red text. |
514.08 |
|
PFUnA |
2058-94-8 |

The picture is the chemical structure of PFUnA shown as an angled horizontal image in black line with green and red text. |
564.09 |
|
PFDoA |
307-55-1
|
The picture is the chemical structure of PFDoA shown as an angled horizontal image in black line with green and red text. |
614.1 |
|
PFTrDA |
72629-94-8 |
The picture is the chemical structure PFTrDA shown as an angled horizontal image in black line with green and red text.
|
664.1 |
|
PFTeDA |
376-06-7 |
The picture is the chemical structure PFTeDA shown as an angled horizontal image in black line with green and red text. |
714.11 |
Table 29 PFPA chemical structure and molecular weight
CAS Number is either that given in the study, or identified based on the chemical name given in the study.
|
PFAS |
CAS no. |
Structure (source: ChemSpider) |
Molecular weight (g/mol) |
|
C6 PFPA
|
356-42-3 |
The picture is the chemical structure C6 PFPA shown as 1 horizontal line structure and another horizontal right angled line structure in black line with green and red text. |
310.05 |
Table 30 FTOH chemical structure and molecular weight
CAS Number is either that given in the study, or identified based on the chemical name given in the study.
|
PFAS |
CAS no. |
Structure (source: ChemSpider) |
Molecular weight (g/mol) |
|
6:2 FTOH |
647-42-7 |
The picture is the chemical structure 6:2 FTOH shown as a horizontal image in black line with green and red text. |
364.1 |
|
8:2 FTOH |
678-39-7 |
The picture is the chemical structure 8:2 FTOH shown as a horizontal image in black line with green and red text. |
464.12 |
|
10:2 FTOH |
865-86-1 |
The picture is the chemical structure 10:2 FTOH shown as an angled vertical image in black line with green and red text. |
564.13 |
Table 31 FOSE chemical structure and molecular weight
CAS Number is either that given in the study, or identified based on the chemical name given in the study.
|
PFAS |
CAS no. |
Structure (source: ChemSpider) |
Molecular weight (g/mol) |
|
N-MeFOSA |
31506-32-8 |
The picture is the chemical structure N-MeFOSA shown as an angled vertical image in black line with green, red and blue text. |
513.17 |
|
N-EtFOSA |
4151-50-2 |
The picture is the chemical structure N-EtFOSA shown as a horizontal image in black line with green, red, blue and brown text. |
527.2 |
|
N-MeFOSE |
24448-09-7 |
The picture is the chemical structure N-MeFOSE shown as an angled horizontal image in black line with green, red, blue and brown text. |
557.23 |
|
N-EtFOSE |
1691-99-2 |
The picture is the chemical structure of N-EtFOSE shown as an angled horizontal image in black line with green, red, blue and brown text. |
571.25 |
Table 32 FOSA chemical structure and molecular weight
CAS Number is either that given in the study, or identified based on the chemical name given in the study.
|
PFAS |
CAS no. |
Structure (source: ChemSpider) |
Molecular weight (g/mol) |
|
PFOSA |
754-91-6 |
The picture is the chemical structure of PFOSA shown as a horizontal image in black line with green, red, blue and brown text. |
499.15 |
|
N,N-Me2FOSA |
213181-78-3
|
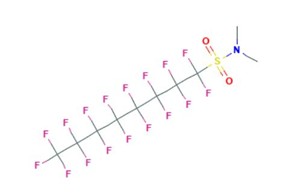
The picture is the chemical structure of N,N-Me2FOSA shown as an angled horizontal image in grey line with pink, red, blue and yellow text.
|
527.2 |
Table 33 New generation substitutes chemical structure and molecular weight
CAS Number is either that given in the study, or identified based on the chemical name given in the study.
|
PFAS |
CAS no. |
Structure (source: ChemSpider) |
Molecular weight (g/mol) |
|
C6O4 |
1190931-41-9 |
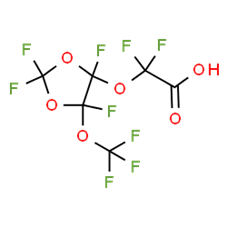
The picture is the chemical structure of C6O4 shown as an horizontal image in black line with red and green text. |
340.05 |
|
F-53B |
73606-19-6 |
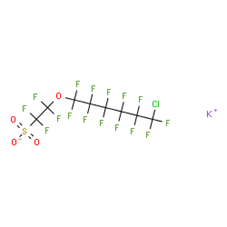
The picture is the chemical structure of F-53B shown in 2 parts approximately 110 degrees angled towards each other. These structures are shown in black line with red, green, brow and purple text. |
570.67 |