Exposure assessment - Risk Assessment of T-2 and HT-2 mycotoxins in Food
In this guide
In this guide37. Occurrence data of T2/HT2 were acquired through a nationwide call for evidence. This call for evidence was issued by the FSA in July 2023, and closed in October 2023. However, the FSA continued to receive data up until February 2024. The FSA received occurrence data on T2/HT2 from several submitters with varying levels of information, detail and in differing formats.
38. The initial assessment of the data received was undertaken internally by the FSA and it was considered appropriate to not exclude older data to take into account year on year variability and seasonal trends, as mycotoxin presence is impacted by climatic events at key stages of crop growth. This older data dates back to 2008, and is predominantly field trial data, though there are additional data from 2014 up to the 2023 harvest.
39. The UK occurrence data generated is often on unprocessed/raw materials, which are yet to undergo any cleaning. The processes of, e.g. dehulling, scouring, have been shown to decrease contamination levels substantially. Therefore, the reported/submitted occurrence may overestimate the actual occurrence in final products and potential exposure of consumers.
40. Part of the data verification exercise involved reformatting data with some assumptions being made, examples are missing LOQ/LOD values and sample type categorisation. For these data sets, assumptions were made based on the descriptors and values included within the provided data by the submitters. This data was collated, cleaned and median concentrations were calculated for the sum of T2/HT2 toxins (µg/kg). FoodEx 2 codes were mapped onto National Diet and Nutrition Survey (NDNS) food codes and used to build food groups for NDNS years 1-11 (Bates et al., 2014, 2016, 2020; Roberts et al., 2018). The food groups include foods that would be consumed in recipes.
41. Due to the wide range of occurrence data points, and to avoid these skewing the averages, median concentration values were used to calculate exposure. Exemplar ranges were: 1 - 2,936 µg/kg for processed oat groats, 10 - 18 µg/kg for processed popped rice, 0.5 - 2,936 µg/kg for all processed food groups, and 10 - 18,206 µg/kg for all unprocessed food groups. Values that were at or below the LOQ were assumed to be zero to estimate the lower bound (LB) sum of T2/HT2, any values that were at or below the LOQ were assumed to be at the LOQ to calculate the upper bound (UB) concentration values. The LOQ ranged from 2-20 µg/kg depending on the food types.
42. Chronic and acute exposure for the sum of T2/HT2 (mean and 97.5th percentile) were calculated using T2/HT2 concentrations collected as part of a FSA led data call to industry and consumption data (Bates et al., 2014, 2016, 2020; Roberts et al., 2018).
Table 1a. Estimates of acute exposure to T2/HT2 in various processed and unprocessed food products based on NDNS years 1-11 consumption data and occurrence data collected from the FSA call.
Sum of T2/HT2 (µg/kg bw/day) LB-UB
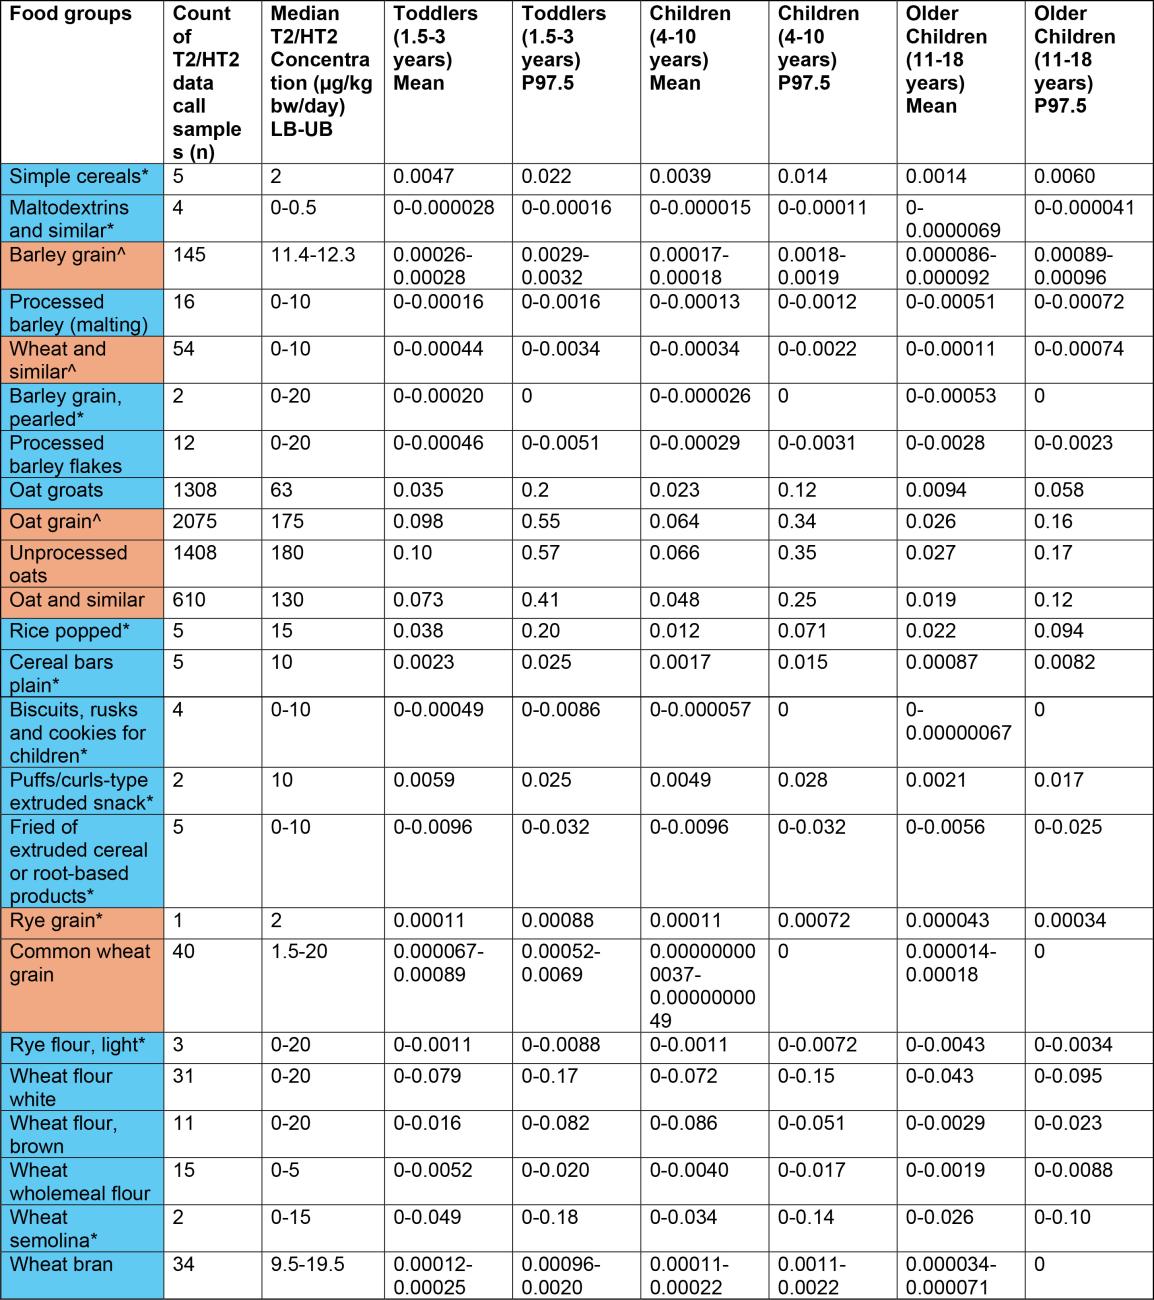
Table 1a. Estimates of acute exposure to T2/HT2 in various processed and unprocessed food products based on NDNS years 1-11 consumption data and occurrence data collected from the FSA call. This table is has 11 columns and 25 rows. The table has a colour key: blue Processed, orange Unprocessed.
Estimates have been rounded to 2 significant figures.
*Low occurrence sample numbers (concentration values are based on <10 samples).
LB - Lower bound: values below the limit of quantification (LOQ) are treated as zero; UB - Upper bound: values below the LOQ are treated as at the LOQ.
^Uncertainty on extent of processing of food groups which may affect robustness of occurrence data used in exposure calculations.
Table 1b. Estimates of acute exposure to T2/HT2 in various processed and unprocessed food products based on NDNS years 1-11 consumption data and occurrence data collected from the FSA call.
Sum of T2/HT2 (µg/kg bw/day) LB-UB
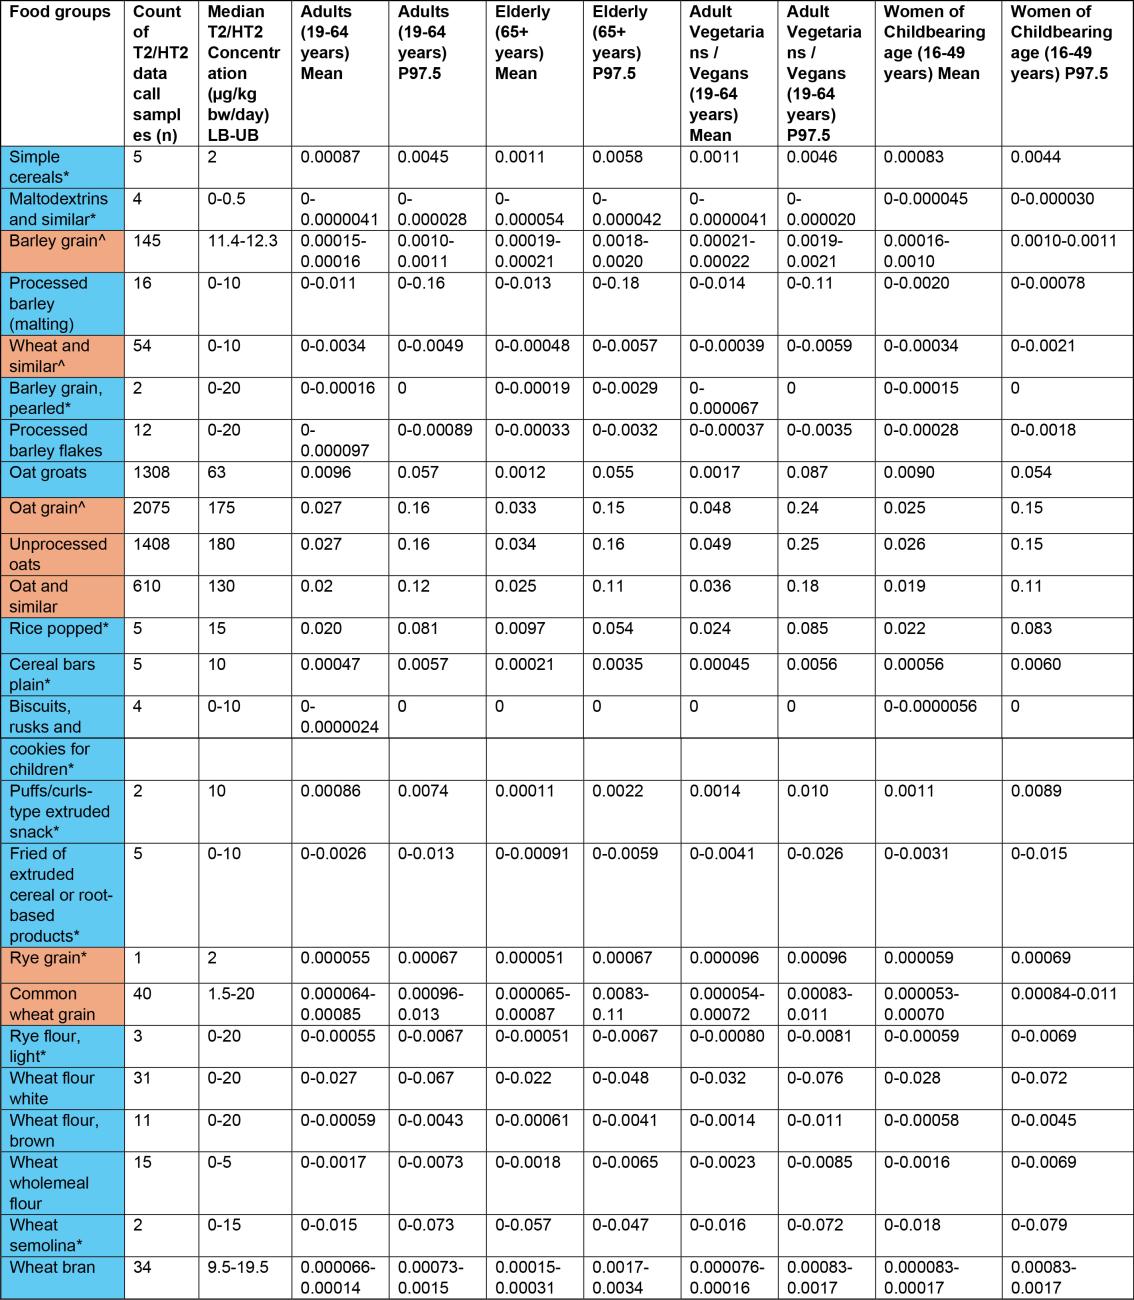
Table 1b. Estimates of acute exposure to T2/HT2 in various processed and unprocessed food products based on NDNS years 1-11 consumption data and occurrence data collected from the FSA call. The table has 11 column's and 24 rows. The table colour key: Blue = processed, Orange = unprocessed.
Estimates have been rounded to 2 significant figures.
*Low occurrence sample numbers (concentration values are based on <10 samples).
LB - Lower bound: values below the limit of quantification (LOQ) are treated as zero; UB - Upper bound: values below the LOQ are treated as at the LOQ.
^Uncertainty on extent of processing of food groups which may affect robustness of occurrence data used in exposure calculations.
Table 1c. Estimates of acute exposure to T2/HT2 in various processed and unprocessed food products based on NDNS years 1-11 consumption data and occurrence data collected from the FSA call.
Sum of T2/HT2 (µg/kg bw/day) LB-UB
Estimates have been rounded to 2 significant figures.
*Low occurrence sample numbers (concentration values are based on <10 samples).
LB - Lower bound: values below the limit of quantification (LOQ) are treated as zero; UB - Upper bound: values below the LOQ are treated as at the LOQ.
^Uncertainty on extent of processing of food groups which may affect robustness of occurrence data used in exposure calculations.
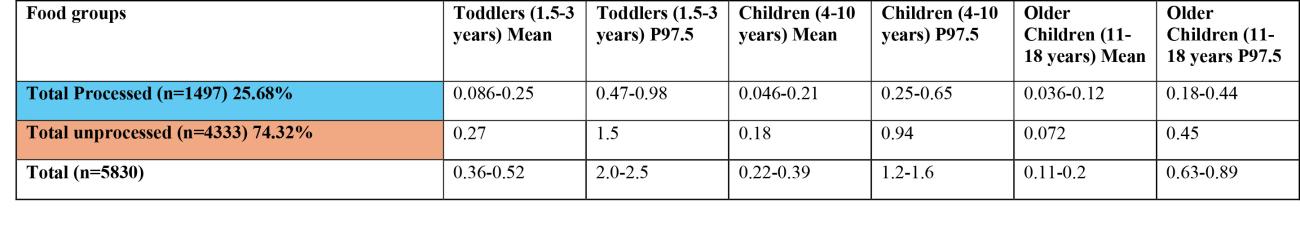
Table 1d. Estimates of acute exposure to T2/HT2 in various processed and unprocessed food products based on NDNS years 1-11 consumption data and occurrence data collected from the FSA call.
Sum of T2/HT2 (µg/kg bw/day) LB-UB
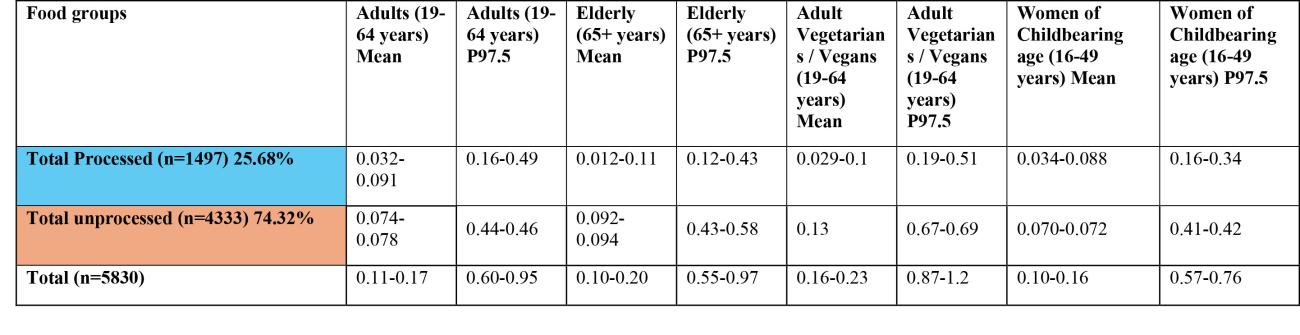
Table 1d. Estimates of acute exposure to T2/HT2 in various processed and unprocessed food products based on NDNS years 1-11 consumption data and occurrence data collected from the FSA call. The table has 9 columns and 3 rows. The table colour key: Blue = processed, Orange = unprocessed.
Estimates have been rounded to 2 significant figures.
*Low occurrence sample numbers (concentration values are based on <10 samples).
LB - Lower bound: values below the limit of quantification (LOQ) are treated as zero; UB - Upper bound: values below the LOQ are treated as at the LOQ.
^Uncertainty on extent of processing of food groups which may affect robustness of occurrence data used in exposure calculations.
Table 2a: Estimates of chronic exposure to sum of T2/HT2 from various processed and unprocessed food products based on NDNS years 1-11 consumption data and occurrence data collected from the FSA call.
Exposure-Sum of T2/HT2 (µg/kg bw/day) LB-UB
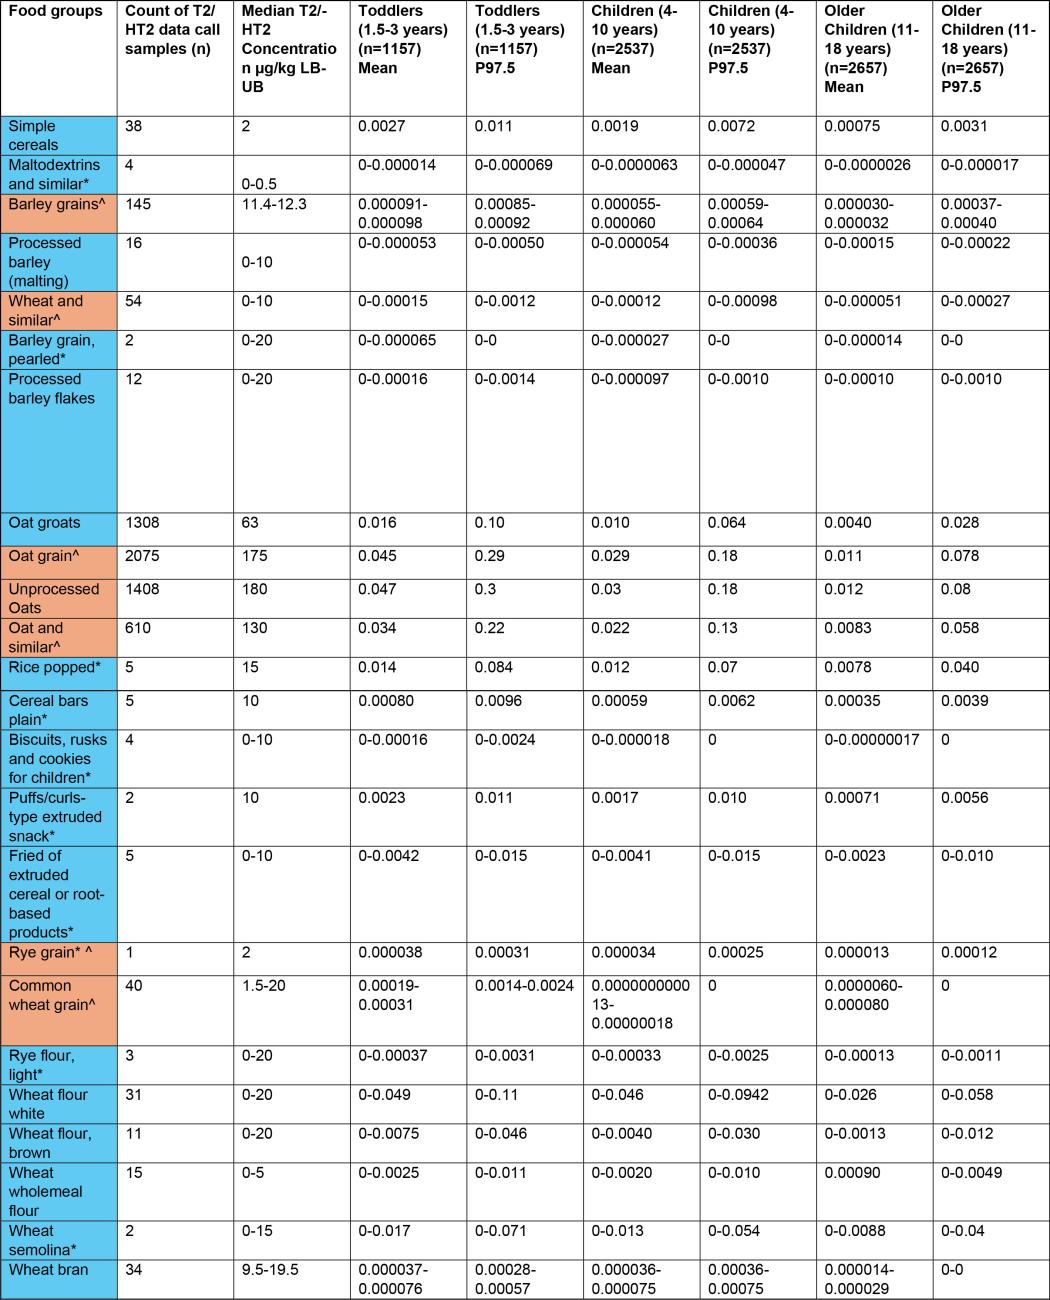
Table 2a: Estimates of chronic exposure to sum of T2/HT2 from various processed and unprocessed food products based on NDNS years 1-11 consumption data and occurrence data collected from the FSA call. The table has 9 columns and 24 rows. The table colour key: Blue = processed, Orange = unprocessed.
Estimates have been rounded to 2 significant figures.
*Low occurrence sample numbers (concentration values are based on <10 samples).
LB - Lower bound: values below the limit of quantification (LOQ) are treated as zero; UB - Upper bound: values below the LOQ are treated as at the LOQ.
^Uncertainty on extent of processing of food groups which may affect robustness of occurrence data used in exposure calculations.
Table 2b: Estimates of chronic exposure to sum of T2/HT2 from various processed and unprocessed food products based on NDNS years 1-11 consumption data and occurrence data collected from the FSA call.
Exposure-Sum of T2/HT2 (µg/kg bw/day) LB-UB
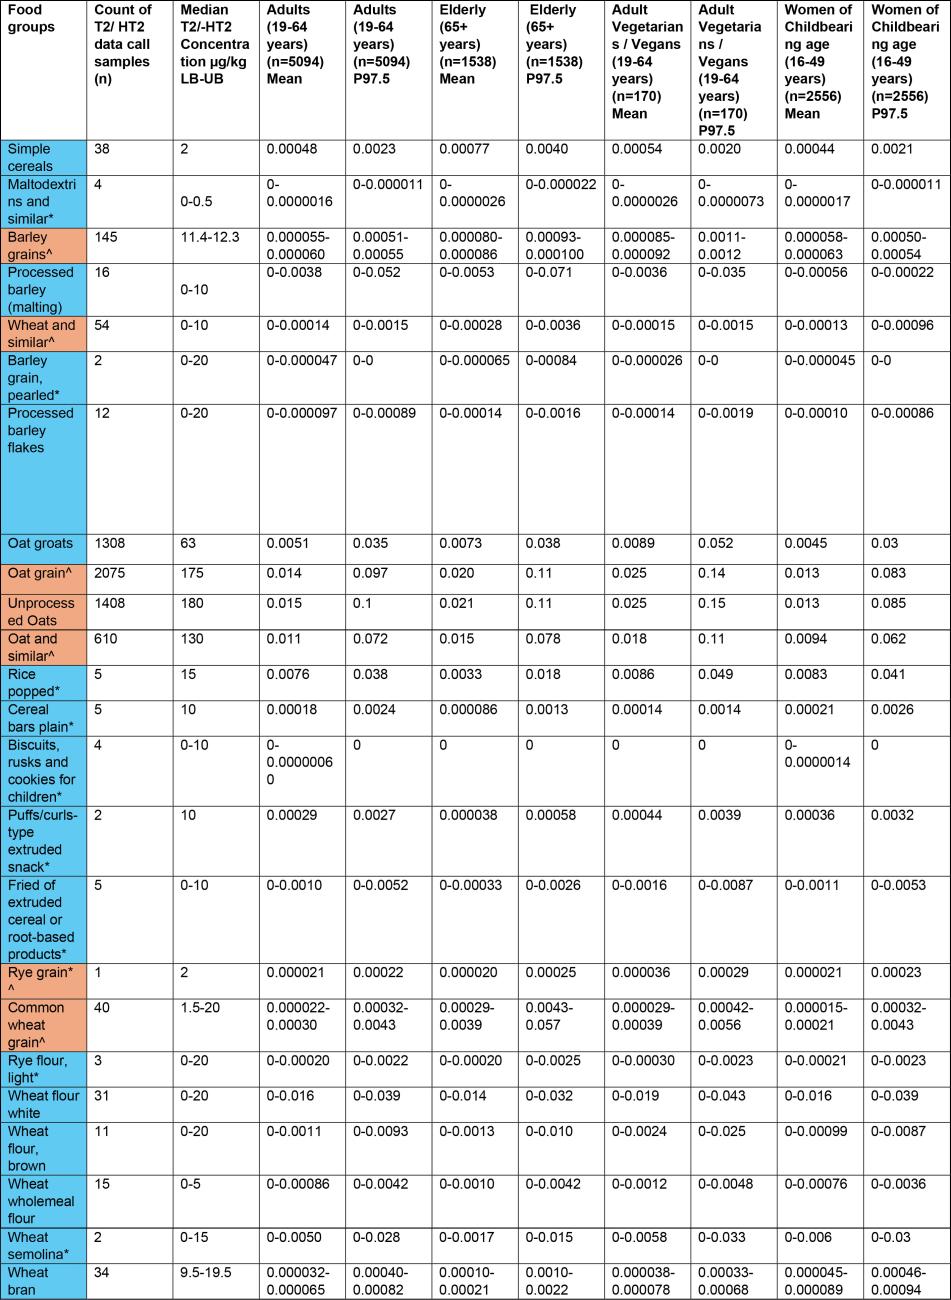
Table 2c: Estimates of chronic exposure to sum of T2/HT2 from various processed and unprocessed food products based on NDNS years 1-11 consumption data and occurrence data collected from the FSA call. The table has 11 columns and 24 rows. The table colour key: Blue = processed, Orange = unprocessed.
Estimates have been rounded to 2 significant figures.
*Low occurrence sample numbers (concentration values are based on <10 samples).
LB - Lower bound: values below the limit of quantification (LOQ) are treated as zero; UB - Upper bound: values below the LOQ are treated as at the LOQ.
^Uncertainty on extent of processing of food groups which may affect robustness of occurrence data used in exposure calculations.
Table 2c: Estimates of chronic exposure to sum of T2/HT2 from various processed and unprocessed food products based on NDNS years 1-11 consumption data and occurrence data collected from the FSA call.
Exposure-Sum of T2/HT2 (µg/kg bw/day) LB-UB
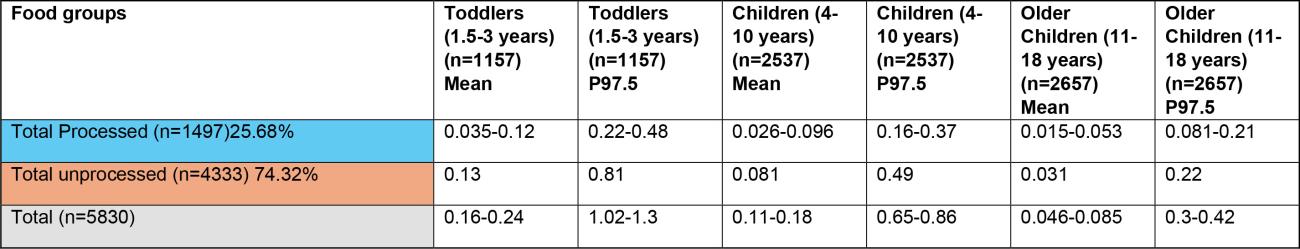
Table 2c: Estimates of chronic exposure to sum of T2/HT2 from various processed and unprocessed food products based on NDNS years 1-11 consumption data and occurrence data collected from the FSA call. The table has 7 columns and 3 rows. The table colour key: Blue = processed, Orange = unprocessed.
Estimates have been rounded to 2 significant figures.
*Low occurrence sample numbers (concentration values are based on <10 samples).
LB - Lower bound: values below the limit of quantification (LOQ) are treated as zero; UB - Upper bound: values below the LOQ are treated as at the LOQ.
^Uncertainty on extent of processing of food groups which may affect robustness of occurrence data used in exposure calculations.
Table 2d: Estimates of chronic exposure to sum of T2/HT2 from various processed and unprocessed food products based on NDNS years 1-11 consumption data and occurrence data collected from the FSA call.
Exposure-Sum of T2/HT2 (µg/kg bw/day) LB-UB
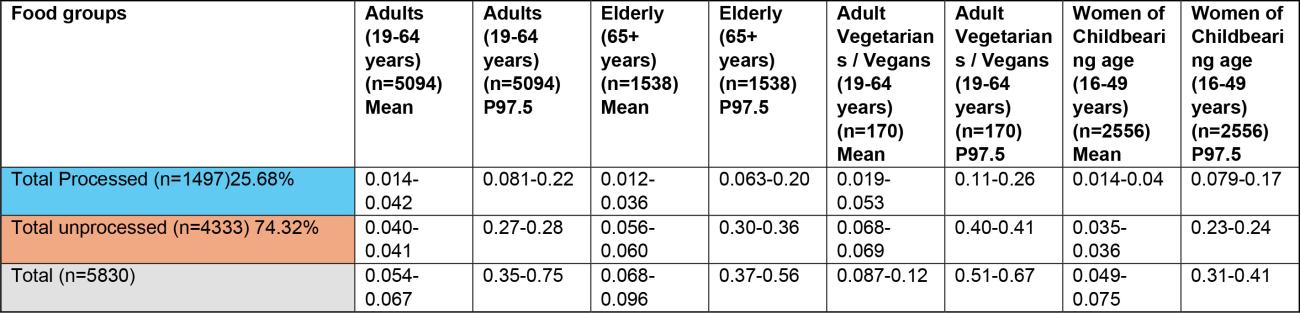
Table 2d: Estimates of chronic exposure to sum of T2/HT2 from various processed and unprocessed food products based on NDNS years 1-11 consumption data and occurrence data collected from the FSA call. The table has 9 columns and 3 rows. The table colour key: Blue = processed, Orange = unprocessed.
Estimates have been rounded to 2 significant figures.
*Low occurrence sample numbers (concentration values are based on <10 samples).
LB - Lower bound: values below the limit of quantification (LOQ) are treated as zero; UB - Upper bound: values below the LOQ are treated as at the LOQ.
^Uncertainty on extent of processing of food groups which may affect robustness of occurrence data used in exposure calculations.
43. The highest chronic exposures from the processed food group were from oat groats (mean and 97.5th percentile of 0.016 and 0.1 µg/kg bw, respectively) and popped rice (mean and 97.5th percentile of 0.014 and 0.0184 µg/kg bw, respectively) in toddlers (1.5-3 years).
44. The highest chronic exposure for unprocessed food groups were from unprocessed oats (mean and P97.5 of 0.047 and 0.3 µg/kg bw), oat grain (mean and P97.5 of 0.045 and 0.29 µg/kg bw) and oat and similar (mean and P97.5 of 0.034 and 0.22 µg/kg) in toddlers (1.5-3 years).
45. The highest acute exposure from a processed food group were from oat groats (mean and P97.5 of 0.035 and 0.2 µg/kg bw) and popped rice (mean and P97.5 of 0.038 and 0.2 µg/kg bw) in toddlers (1.5-3 years).
46. The highest acute exposure for unprocessed food groups were from unprocessed oats (mean and P97.5 of 0.1 and 0.57 µg/kg bw), oat grain (mean and P97.5 of 0.098 and 0.55 µg/kg bw) and oat and similar (mean and P97.5 of 0.073 and 0.41 µg/kg) in toddlers (1.5-3 years).