Risk Assessment of T-2 and HT-2 mycotoxins in Food
Background - Risk Assessment of T-2 and HT-2 mycotoxins in Food
In this guide
In this guideThis is a paper for discussion.
This does not represent the views of the Committee and should not be cited.
1. The mycotoxins T-2 (T2)/HT-2 (HT2) were previously assessed by the COT in 2018 (COT, 2018) and 2021 (COT, 2021), reviewing their presence in the diet of infants and young children and the potential implications of combined mycotoxin exposure, respectively.
2. In 2020, the European Commission proposed establishing maximum levels for T2/HT2 which are lower than the current indicative levels set out in the European Commission Recommendation 2013/165/EU. The COT was asked by the FSA to assess the risk to UK consumers from T2/HT2 in foods. This will aid the FSA in their review of the T2/HT2 and development of risk management options, taking into consideration the following:
- the occurrence of T2/HT2 in commodities produced and imported into the UK and its annual variability and the effects of processing;
- exposures of UK consumers to these mycotoxins in the diet; and,
- the existence of mitigation measures.
3. As part of this work, the COT considered “the existing health-based guidance values (HBGVs) for T2/HT2 mycotoxins set by the European Food Safety Authority (EFSA) and the Joint FAO/WHO Expert Committee on Food Additives (JECFA)” in February 2023, and agreed a HBGV for FSA risk assessments going forward (TOX/2023/04).
4. The previous discussion paper (TOX/2023/04) also provided an overview of JECFA’s recent 2022 evaluation of T2, HT2 and 4,15-diacetoxyscirpenol (DAS) in food. At that time, only the summary and conclusions were publicly available. JECFA established a new group ARfD for T2, HT2 and DAS of 0.32 µg/kg bw, and also a group TDI of 0.025 µg/kg bw for T2, HT2 and DAS, alone or in combination. The COT noted that these HBGVs are broadly in line with EFSA’s HBGVs which were established in 2017 (a group ARfD of 0.3 μg/kg bw for T2, HT2 and NEO and a group TDI of 0.02 μg/kg bw for T2 (x 1), HT2 (x 1) and NEO (x 0.3)). Overall, the COT was content to continue using EFSA’s HBGVs for future risk assessments.
5. JECFA’s evaluation of T2, HT2, and DAS from their 93rd meeting was published in March 2023 (JECFA, 2023). However, this ‘yellow paper’ summary report does not include the complete toxicological dataset used for their risk assessment. It is not known when the full toxicological monograph will be published by JECFA.
6. This discussion paper provides an assessment of T2/HT2 based on UK occurrence data for T2/HT2 mycotoxins across a range of food groups. Neosolaniol (NEO) and 4,15-diacetoxyscirpenol (DAS) have not been included, as the FSA did not think there was sufficient data available for these compounds to be included at present.
Introduction - Risk Assessment of T-2 and HT-2 mycotoxins in Food
In this guide
In this guide7. T2/HT2 are type A trichothecenes and are produced by a variety of Fusarium and other fungal species. Fusarium species grow and invade crops and produce T2/HT2 under cool, moist conditions prior to harvest. T2/HT2 are found predominantly in cereal grains (between 11 – 14% of the samples tested were contaminated) and in particular oats, barley and wheat products (JECFA, 2016). The presence of T2/HT2 is dependent on weather at key growth stages e.g. flowering, and can demonstrate large annual variability.
8. The chemical structures of T2/HT2 are shown below in Figure 1.
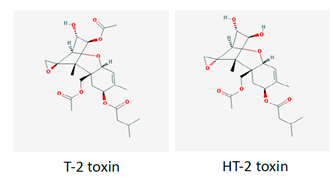
Figure 1 gives the chemical structures of the mycotoxins T-2 and HT-2.
Figure 1. Chemical structures of T2/HT2.
Occurrence
9. While there are good agricultural practices deployed to manage the presence of mycotoxins in general, they have not proven effective for T2/HT2, given the large dependence on climate/weather. Similarly, reliable rapid testing is not currently available; recent assessments by industry see large variability between LC-MS/MS methods and Calibre/Charm Elisa semi-rapid methods. . Moreover, rapid analytical methods for T2/HT2 are not yet validated, making it difficult to reliably detect and mitigate these toxins at the field level. A science and evidence-based review of the UK oat supply in the context of the FSA/FSS call for data on T2/HT2 has been provided to COT Members (Croucher, 2023). This unpublished review was provided to the FSA by the British Oat & Barley Millers’ Association (BOBMA) and has been provided to Members on a confidential basis.
10. On 2th March 2013, Commission Recommendation 2013/165/EU set out indicative levels for a number of commodities, which are not legally binding but have been used by industry in the EU and UK to gather monitoring data to further understand the risk. The EU have been considering the issue of T2/HT2 for a number of years and proposed maximum levels in 2023, that are due to come into force in July 2024.
11. There are currently no maximum levels agreed at CODEX for T2/HT2 and it is unlikely that any work will be undertaken at CODEX until further geographically representative data allow for a refined exposure assessment by JECFA.
Toxicokinetics
12. The toxicokinetics of T2/HT2 have been reviewed previously by JECFA (2001) and EFSA (2017a).
13. In summary, there is very little information on the in vivo absorption of T2/HT2 in animals after oral administration. In studies in which tritiated T2 was administered directly into the small intestine of male rats, 40 to 57% of radioactivity was found in bile and blood. Only low amounts of T2 were observed in these studies, suggesting extensive hydrolysis to HT2 and other metabolites during the rapid intestinal absorption of T2 (EFSA, 2017a).
14. The presumed rapid absorption is consistent with the fact that the excretion of total radioactivity in the urine and faeces of rats was completed 48 hours after a single oral dose of tritium-labelled T2 administered by gavage (Pfeiffer et al., 1988). T2 radioactivity was rapidly distributed to the liver, kidney and other organs without accumulation in any organ in orally dosed rats and mice (EFSA, 2017a). The metabolism of T2/HT2 in humans and other species is complex and was reviewed previously by EFSA in 2011. Phase I metabolites arise from either hydrolysis of ester group, hydroxylation, or de-epoxidation. These reactions may also occur in combination. Glucuronides are the most prevalent mammalian phase II metabolites of T2/HT2 (EFSA, 2017a).
15. The major metabolic pathway of T2, regardless of the animal species, is rapid deacetylation at the fourth carbon position of T2 resulting in the formation of HT2 (Nathanail et al. 2015).
Toxicity
16. The toxicity of T2/HT2 has been reviewed previously by EFSA (2011, 2017), JECFA (2002, 2016, 2022) and the SCF (2002). All Committees agreed that these trichothecenes were haematotoxic, immunotoxic and caused reduced body weight, and emesis. These effects occurred at lower doses than other toxic effects such as dermal toxicity, developmental and reproductive toxicity, and neurotoxicity. Haematotoxicity was the critical chronic effect of T2; the underlying mode of action (MOA) being the inhibition of protein synthesis, the induction of ribotoxic stress (a response that stimulates MAP kinase signalling) and apoptosis. Mink and pigs have been identified as the most sensitive species to the toxic effects of trichothecenes.
HBGV’s established by EFSA - Risk Assessment of T-2 and HT-2 mycotoxins in Food
In this guide
In this guideEFSA’s group ARfD
17. The lowest dose at which acute effects were seen was in mink in a study by Wu et al. (2016) with an ED50 of 1030 μg/kg bw after oral exposure. Mink were used, in lieu of ferrets (which are more expensive and difficult to raise), and have been suggested as the model species for emesis in drug testing (Gordon, 1985; Zhang et al., 2006; Percie du Sert et al., 2012) and EFSA therefore concluded that the mink was an appropriate animal model for vomiting in humans (EFSA, 2017a).
18. In the study conducted by Wu et al. (2016), groups of fasted female mink (n = 4) were given 50 g of feed 30 minutes prior to either a) i.p. administration of 0, 0.001, 0.01, 0.05 or 0.25 mg/kg bw of T2 or HT2 or 0, 0.5, 1, 2.5 or 5 mg/kg bw emetine (positive control), or b) administration by oral gavage of 0, 0.005, 0.05, 0.25 or 0.5 mg/kg bw T2 or HT2 or 0, 0.5, 1, 2.5 or 5 mg/kg bw emetine. The animals were then monitored for emetic events for six hours (an emetic event was classed as either vomiting or retching; according to Wu et al. (2016) vomiting is rhythmic abdominal contraction with oral expulsion of either solid or liquid material; retching is a response which mimics vomiting but without the expulsion of any material).
19. In a second study by Wu et al. (2016), 3 groups of fasted female mink (n = 4) were given 50 g of feed 30 minutes prior to the administration of 0.5 mg/kg bw T2 or HT2 or 5 mg/kg bw emetine by oral gavage. Emetic events were recorded for up to 2 hours and the levels of the plasma satiety hormone peptide YY3-36 (PYY3-36) and 5-hydroxytryptamine (5-HT) (hormones known to be implicated in emesis) were measured. The lowest dose at which emetic events were observed after i.p. administration was 0.05 mg/kg bw for T2/HT2 and 25% of animals were affected for each. After oral exposure, the lowest dose at which emetic events occurred was 0.05 mg/kg bw and 75% of animals were affected for both T2/HT2. At 0.25 mg/kg bw 4 animals (100%) were affected for both T2/HT2 via i.p. and oral administration. The lowest doses at which emetic events occurred in animals treated with emetine was 2.5 (50%) and 1 mg/kg bw (50%) for i.p. and oral administration routes, respectively. The latency of emetic events decreased while duration and frequency of emetic events increased with dose. Oral administration of T2/HT2 caused increases in plasma concentrations of PYY3-36 and 5-HT. The study authors concluded that via the oral route the NOAELs were 5 μg/kg bw, LOAELs were 50 μg/kg bw and ED50s were 20 μg/kg bw for both T2/HT2.
20. EFSA used the Wu et al. (2016) study for their benchmark dose (BMD) analysis (using PROAST software version 38.9) as the basis for an ARfD and selected a benchmark response of 10%. EFSA combined the results from 2 independent experiments on T2/HT2 and the experiments were considered as a covariate.
21. Until recently, performing model averaging using the PROAST software was not possible. The overall BMDL - BMDU range therefore was 2.97 – 49.8 μg/kg bw (when considering all models with AIC ≤ AICmin +2) and, following their own guidance (EFSA, 2017b), EFSA selected a BMDL10 of 2.97 μg/kg bw for further consideration, as this was the lowest valid BMDL10. EFSA noted that there is considerable uncertainty associated with the BMDL calculation due to the large dose spacing at the lower doses and the small number of animals used.
22. An uncertainty factor of 10 for intraspecies variability was applied to the BMDL10 of 2.97 μg/kg bw derived for emetic response in mink, resulting in a group ARfD of 0.3 μg/kg bw for T2/HT2. No interspecies uncertainty factor was applied because humans were not considered more sensitive than mink to acute emetic effects. This was based on observations with emetine (an ipecacuanha alkaloid), which induces vomiting in humans and minks at the same effective dose. Hence, it was assumed that this would also be the case for T2/HT2. Dose additivity of T2/HT2 and their modified forms was assumed, although EFSA noted that, antagonistic or less likely, synergistic, effects of their co-exposure cannot be excluded in principle.
23. In 2018, the COT accepted the group ARfD for T2/HT2 established by EFSA, with the following caveats:
i.The AIC values for all the models, except the Two-stage model, fell within the EFSA acceptance criterion (AIC ≤ AICmin +2), however, the BMDU/BMDL ratio is quite large, generally >10-fold.
ii.The COT considered that the lack of an interspecies uncertainty factor might be justifiable for the toxicodynamic component (similar sensitivity to emetine) but there was some concern as to whether the toxicokinetic differences would be accounted for (potential differences in the toxicokinetics of the toxins as compared with emetine).
iii.The Wu et al. (2016) study used only female minks and there did not appear to be any consideration by EFSA as to how suitable this was as a model.
24. Using a very recent update to the PROAST software, it was possible to perform model averaging on the Wu et al. (2016) data. This resulted in a model averaged BMDL10 of 12.2 μg/kg bw, approximately 4-fold greater than the BMDL10 used by EFSA to establish the ARfD. The COT was uncertain as to the current validation status of the model averaging function of the PROAST software. Hence, the Committee continued to apply the ARfD established by EFSA, acknowledging that given the uncertainties of model averaging the EFSA ARfD was more conservative.
EFSA’s group TDI
25. In 2011, EFSA performed a BMD analysis on the specific antibody response (anti-horse globulin) detected in studies conducted by Rafai et al. (1995a), and Rafai et al. (1995b), using the PROAST software (version 26.0 under R 2.10.2) (EFSA, 2011b). Due to the rapid metabolism of T2 to HT2 (and the fact that T2 toxicity may in part be due to HT2), EFSA decided to establish a group TDI for the sum of T2/HT2. Details on these studies can be found in TOX/2023/04.
26. EFSA used the BMDL05 of 10 μg/kg bw/day for T2 toxin as a point of departure and applied the default uncertainty factor of 100 to establish a TDI of 100 ng/kg bw for the sum of T2/HT2. (NB. the default value for continuous data recommended by EFSA is a benchmark response of 5%; the BMDL05 is the 95% lower confidence limit for the benchmark dose response of 5%).
27. Since 2011 however, several subacute and subchronic toxicity studies on T2 have been published, including a 90-day rat study conducted by Rahman et al. (2014).
28. In the study by Rahman et al. (2014), 192 male Wistar rats were assigned to 4 groups (n = 48) and dosed with 0, 0.5, 0.75 or 1.0 mg T2/kg (ppm) (equivalent to 0, 45, 68 and 90 µg T2/kg bw/day, respectively) daily via the diet for 12 weeks. Eight animals each were sacrificed at 2, 4, 6, 8, 10 and 12 weeks. Rats dosed with T2 toxin showed varying degrees of adverse clinical signs, including dullness, weakness, lethargy, growth retardation, reduced feed intake, reluctance to move and rough hair coat, which worsened over time in groups 68 or 90 µg/kg bw/day. Rats treated with 90 µg/kg bw/day showed gangrenous dermatitis of tail (15/24) at 8th week, and facial and podal dermatitis after the 10th week. A statistically significant dose dependent decrease in bodyweights was seen after 90 days of dosing. Mean body weights were 264, 219, 184 and 160 g for rats dosed with 0, 45, 68 and 90 µg/kg bw/day, respectively. Significant decreases in haemoglobin (Hb), packed cell volume (PCV), total erythrocyte count (TEC), total thrombocytes count (TTC), total leucocyte count (TLC), mean corpuscular volume (MCV), mean corpuscular Hb (MCHb), and percentages of lymphocytes were observed but the percentage of neutrophils increased. Generally, all of these observations became more pronounced with study length, with no sign of reaching a plateau at the end. After 90 days of feeding mean TECs were 8.97, 5.85, 5.77 and 4.65 x10⁶ /µl in rats fed 0, 45, 68 and 90 µg/kg bw/day, respectively; mean TLCs were 14.83, 8.95, 6.92 and 5.20 x10³ /µl in animals dosed with 0, 45, 68 and 90 µg/kg bw/day, respectively; mean TTCs were 122.5, 77.7, 56.5 and 38.0 x10³ /µl in animals fed 0, 45, 68 and 90 µg/kg bw/day. The study authors concluded that T2 induces microcytic hypochromic anaemia, leukocytopaenia (due to lymphocytopaenia) and thrombocytopaenia in rats which increased with dose and duration of exposure.
29. EFSA (2017a) noted that the effects observed (i.e. anorectic effects and effects on immune system and blood parameters) in the Rahman et al. (2014) rat study were similar to those seen in the pig study, confirming the immune system and blood cell production as targets of T2 across species. EFSA also noted that the exposure duration to T2 in the study of Rahman et al. (90 days) was longer than in the Rafai et al. (1995a, b) studies in pigs - not only in absolute terms, but also as a proportion of species lifetime.
30. Therefore, EFSA decided, considering the longer exposure duration in the study by Rahman et al. (2014) and its biological relevance, to apply the changes in total leucocyte counts reported by Rahman et al. (2014) for the derivation of a new BMD for T2. EFSA did not identify a NOAEL, but considered the lowest dose tested (45 μg T2/kg bw/day) to be a LOAEL (EFSA, 2017a). EFSA used a benchmark response (BMR) of 10%, considering such a response in leucocyte counts to be within the individual physiological variation and negligible, and further noted that the selected BMR is slightly below the control standard deviation of the controls in the Rahman et al. study (14%).
31. The overall BMDL - BMDU range was 3.30 - 27.60 μg/kg bw (when considering all models with AIC ≤ AICmin +2). A 95% lower confidence limit for the benchmark dose response (BMDL10) of 3.3 μg T2/kg bw was used as a reference point for establishing a chronic TDI for T2/HT2 as it was the lowest valid BMDL10.
32. To this value, an uncertainty factor of 200 was applied: a factor of 10 for interspecies variability, 10 for intraspecies variability and 2 for extrapolation from subchronic to chronic exposure duration and for the progression of the toxic effect through the duration of the study with no signs of reaching a plateau by the end. EFSA thus established a TDI of 0.02 μg T2/kg bw.
33. Based on HT2’s similar acute toxicity profile and potency, structural similarity to T2 (and the fact that HT2 is an immediate metabolite of T2), and in agreement with their previous assessment in 2011, EFSA concluded that T2/HT2 should be included in a group TDI with the same potency.
34. EFSA noted that no in vivo studies on the haematotoxicity of modified forms of T2/HT2 could be identified. However, as some phase I metabolites have shown to cause protein synthesis inhibition, they may work via a similar mode of action and as such induce haematotoxicity. EFSA therefore considered it appropriate to include such metabolites in a group TDI, assuming dose addition as a model of joint action. Because potencies of phase I metabolites differ with respect to inhibition of protein synthesis and other toxic effects, EFSA decided to assign relative potency factors (RPFs), on a molar basis.
35. When assigning potency factors to the phase I metabolites EFSA used in vivo and in vitro studies on comparative toxicity. EFSA noted that none of the phase I metabolites were more potent than T2 or HT2. Since in vitro test systems may have a limited capacity for detoxification, results would in general overestimate the toxicity of T2 compared to that in vivo. Therefore in vivo data were used preferentially. When there were different values for relative potencies for the same metabolite, EFSA used the highest potency so that relative toxicity was not underestimated. EFSA rounded the RPFs to half orders of magnitude to avoid spurious accuracy whilst retaining a conservative approach. The relative potency factors (RPFs) calculated for T2, HT2 and NEO were 1, 1 and 0.3, respectively (EFSA, 2017a).
36. EFSA noted that the test compound in the study used to determine the group TDI for T2, HT2, and NEO was purified from fungal culture material and its purity was not specified; therefore, EFSA could not exclude the possibility that minor amounts of other mycotoxins (including modified forms) were present. Furthermore, EFSA noted there was uncertainty associated with using a subchronic study to establish a chronic HBGV. Additionally, there were no repeated dose studies available for HT2 which has been included in the group TDI with T2, based on similar acute toxicity profile and potency, structural similarity and because HT2 is an immediate metabolite of T2.
Exposure assessment - Risk Assessment of T-2 and HT-2 mycotoxins in Food
In this guide
In this guide37. Occurrence data of T2/HT2 were acquired through a nationwide call for evidence. This call for evidence was issued by the FSA in July 2023, and closed in October 2023. However, the FSA continued to receive data up until February 2024. The FSA received occurrence data on T2/HT2 from several submitters with varying levels of information, detail and in differing formats.
38. The initial assessment of the data received was undertaken internally by the FSA and it was considered appropriate to not exclude older data to take into account year on year variability and seasonal trends, as mycotoxin presence is impacted by climatic events at key stages of crop growth. This older data dates back to 2008, and is predominantly field trial data, though there are additional data from 2014 up to the 2023 harvest.
39. The UK occurrence data generated is often on unprocessed/raw materials, which are yet to undergo any cleaning. The processes of, e.g. dehulling, scouring, have been shown to decrease contamination levels substantially. Therefore, the reported/submitted occurrence may overestimate the actual occurrence in final products and potential exposure of consumers.
40. Part of the data verification exercise involved reformatting data with some assumptions being made, examples are missing LOQ/LOD values and sample type categorisation. For these data sets, assumptions were made based on the descriptors and values included within the provided data by the submitters. This data was collated, cleaned and median concentrations were calculated for the sum of T2/HT2 toxins (µg/kg). FoodEx 2 codes were mapped onto National Diet and Nutrition Survey (NDNS) food codes and used to build food groups for NDNS years 1-11 (Bates et al., 2014, 2016, 2020; Roberts et al., 2018). The food groups include foods that would be consumed in recipes.
41. Due to the wide range of occurrence data points, and to avoid these skewing the averages, median concentration values were used to calculate exposure. Exemplar ranges were: 1 - 2,936 µg/kg for processed oat groats, 10 - 18 µg/kg for processed popped rice, 0.5 - 2,936 µg/kg for all processed food groups, and 10 - 18,206 µg/kg for all unprocessed food groups. Values that were at or below the LOQ were assumed to be zero to estimate the lower bound (LB) sum of T2/HT2, any values that were at or below the LOQ were assumed to be at the LOQ to calculate the upper bound (UB) concentration values. The LOQ ranged from 2-20 µg/kg depending on the food types.
42. Chronic and acute exposure for the sum of T2/HT2 (mean and 97.5th percentile) were calculated using T2/HT2 concentrations collected as part of a FSA led data call to industry and consumption data (Bates et al., 2014, 2016, 2020; Roberts et al., 2018).
Table 1a. Estimates of acute exposure to T2/HT2 in various processed and unprocessed food products based on NDNS years 1-11 consumption data and occurrence data collected from the FSA call.
Sum of T2/HT2 (µg/kg bw/day) LB-UB
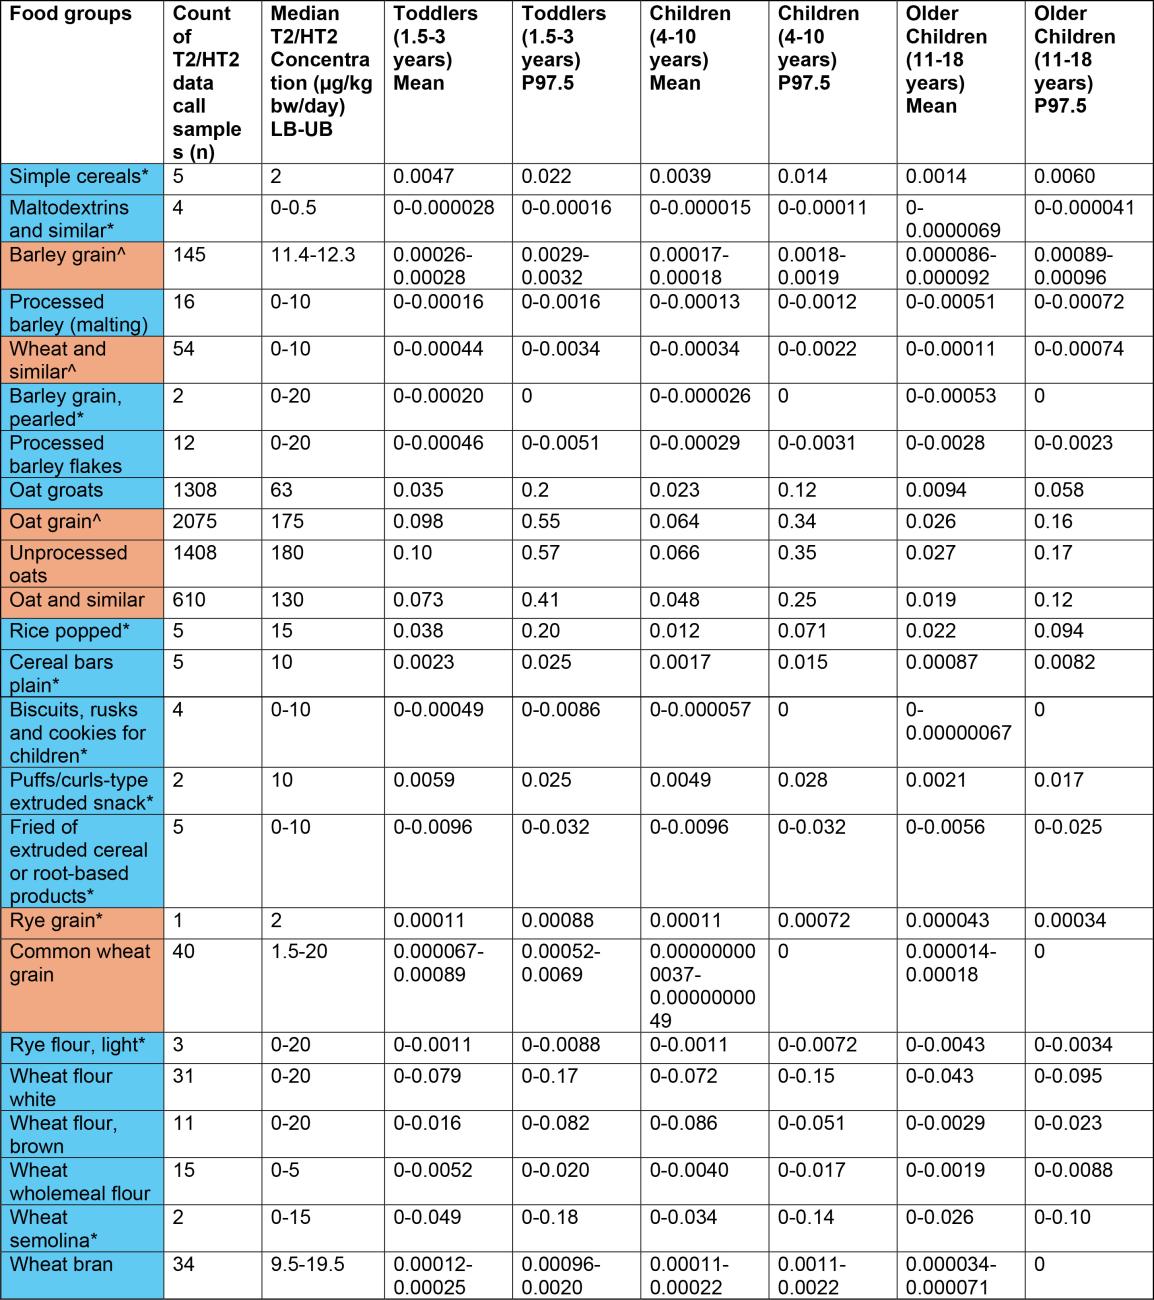
Table 1a. Estimates of acute exposure to T2/HT2 in various processed and unprocessed food products based on NDNS years 1-11 consumption data and occurrence data collected from the FSA call. This table is has 11 columns and 25 rows. The table has a colour key: blue Processed, orange Unprocessed.
Estimates have been rounded to 2 significant figures.
*Low occurrence sample numbers (concentration values are based on <10 samples).
LB - Lower bound: values below the limit of quantification (LOQ) are treated as zero; UB - Upper bound: values below the LOQ are treated as at the LOQ.
^Uncertainty on extent of processing of food groups which may affect robustness of occurrence data used in exposure calculations.
Table 1b. Estimates of acute exposure to T2/HT2 in various processed and unprocessed food products based on NDNS years 1-11 consumption data and occurrence data collected from the FSA call.
Sum of T2/HT2 (µg/kg bw/day) LB-UB
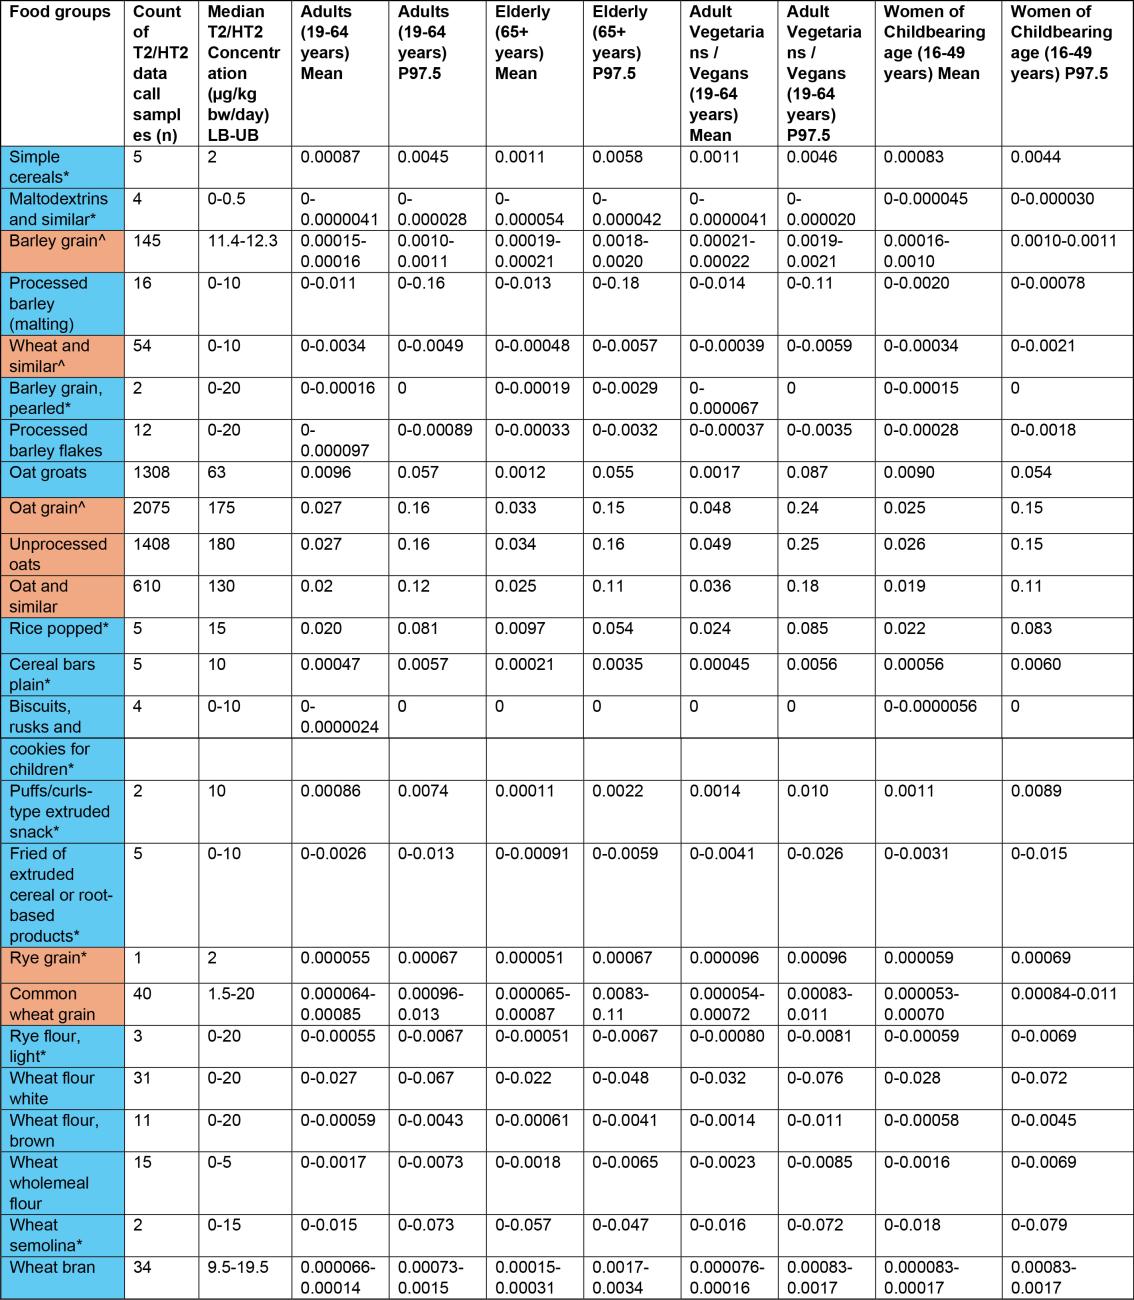
Table 1b. Estimates of acute exposure to T2/HT2 in various processed and unprocessed food products based on NDNS years 1-11 consumption data and occurrence data collected from the FSA call. The table has 11 column's and 24 rows. The table colour key: Blue = processed, Orange = unprocessed.
Estimates have been rounded to 2 significant figures.
*Low occurrence sample numbers (concentration values are based on <10 samples).
LB - Lower bound: values below the limit of quantification (LOQ) are treated as zero; UB - Upper bound: values below the LOQ are treated as at the LOQ.
^Uncertainty on extent of processing of food groups which may affect robustness of occurrence data used in exposure calculations.
Table 1c. Estimates of acute exposure to T2/HT2 in various processed and unprocessed food products based on NDNS years 1-11 consumption data and occurrence data collected from the FSA call.
Sum of T2/HT2 (µg/kg bw/day) LB-UB
Estimates have been rounded to 2 significant figures.
*Low occurrence sample numbers (concentration values are based on <10 samples).
LB - Lower bound: values below the limit of quantification (LOQ) are treated as zero; UB - Upper bound: values below the LOQ are treated as at the LOQ.
^Uncertainty on extent of processing of food groups which may affect robustness of occurrence data used in exposure calculations.
Table 1d. Estimates of acute exposure to T2/HT2 in various processed and unprocessed food products based on NDNS years 1-11 consumption data and occurrence data collected from the FSA call.
Sum of T2/HT2 (µg/kg bw/day) LB-UB
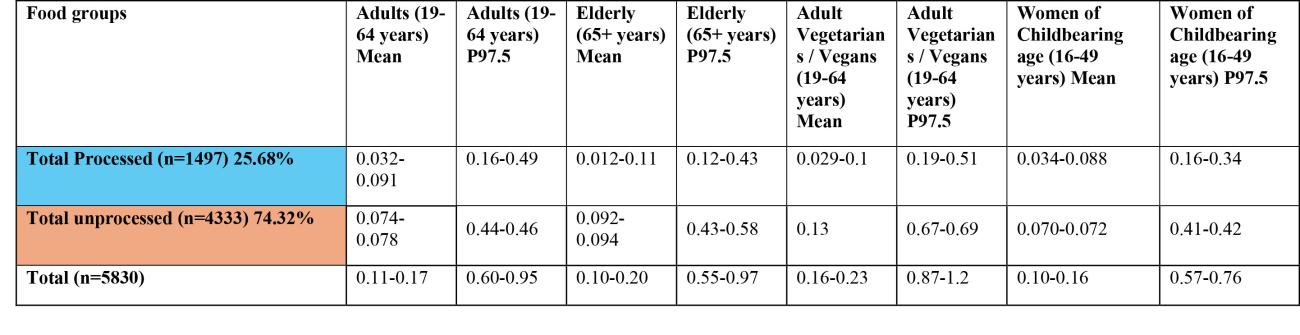
Table 1d. Estimates of acute exposure to T2/HT2 in various processed and unprocessed food products based on NDNS years 1-11 consumption data and occurrence data collected from the FSA call. The table has 9 columns and 3 rows. The table colour key: Blue = processed, Orange = unprocessed.
Estimates have been rounded to 2 significant figures.
*Low occurrence sample numbers (concentration values are based on <10 samples).
LB - Lower bound: values below the limit of quantification (LOQ) are treated as zero; UB - Upper bound: values below the LOQ are treated as at the LOQ.
^Uncertainty on extent of processing of food groups which may affect robustness of occurrence data used in exposure calculations.
Table 2a: Estimates of chronic exposure to sum of T2/HT2 from various processed and unprocessed food products based on NDNS years 1-11 consumption data and occurrence data collected from the FSA call.
Exposure-Sum of T2/HT2 (µg/kg bw/day) LB-UB
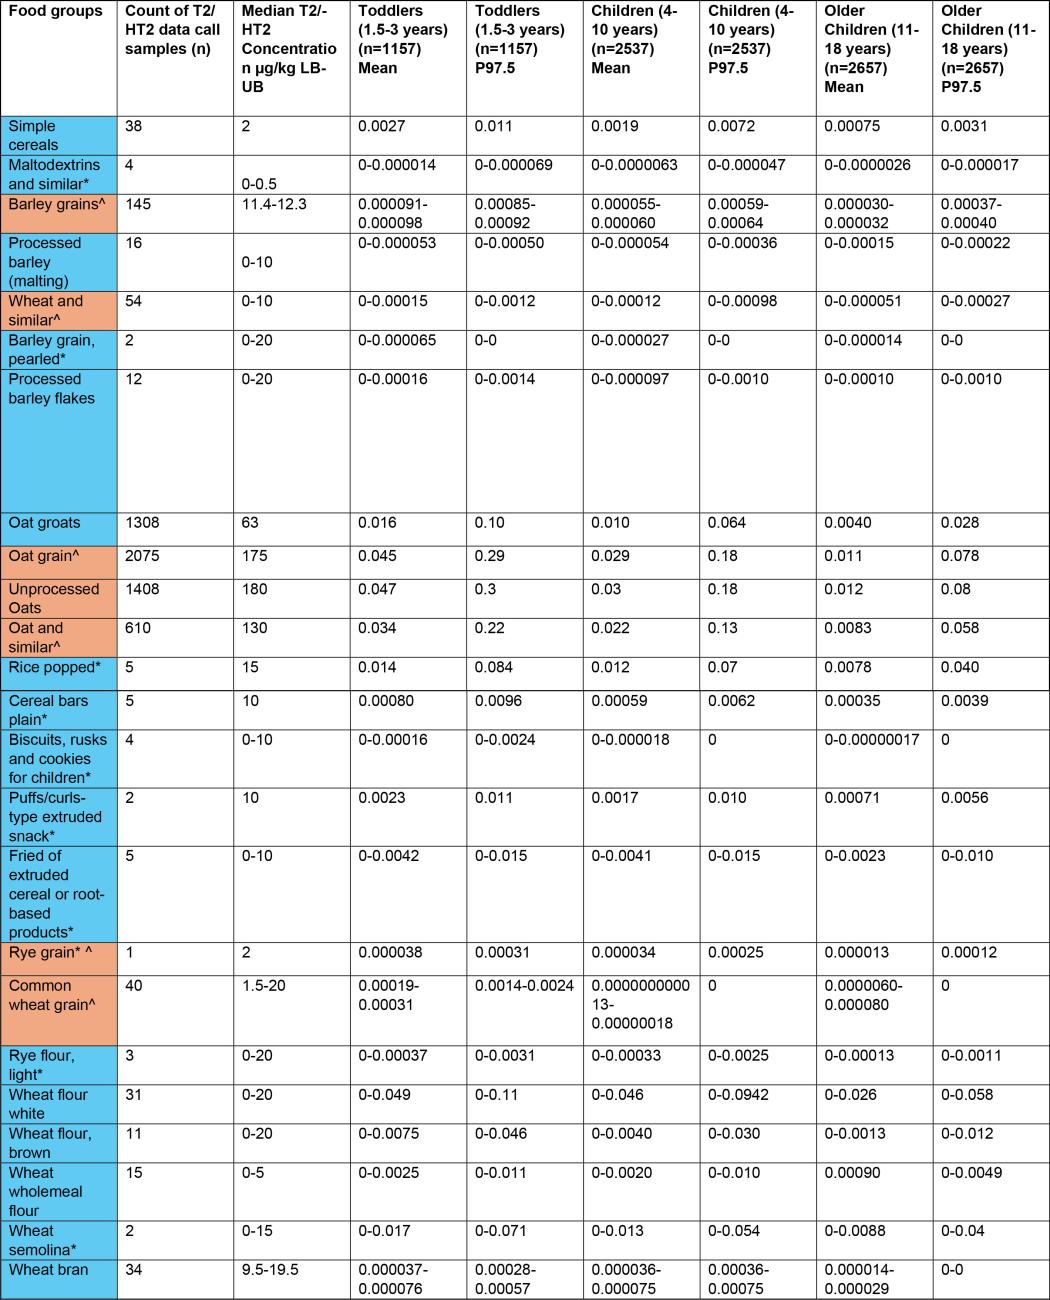
Table 2a: Estimates of chronic exposure to sum of T2/HT2 from various processed and unprocessed food products based on NDNS years 1-11 consumption data and occurrence data collected from the FSA call. The table has 9 columns and 24 rows. The table colour key: Blue = processed, Orange = unprocessed.
Estimates have been rounded to 2 significant figures.
*Low occurrence sample numbers (concentration values are based on <10 samples).
LB - Lower bound: values below the limit of quantification (LOQ) are treated as zero; UB - Upper bound: values below the LOQ are treated as at the LOQ.
^Uncertainty on extent of processing of food groups which may affect robustness of occurrence data used in exposure calculations.
Table 2b: Estimates of chronic exposure to sum of T2/HT2 from various processed and unprocessed food products based on NDNS years 1-11 consumption data and occurrence data collected from the FSA call.
Exposure-Sum of T2/HT2 (µg/kg bw/day) LB-UB
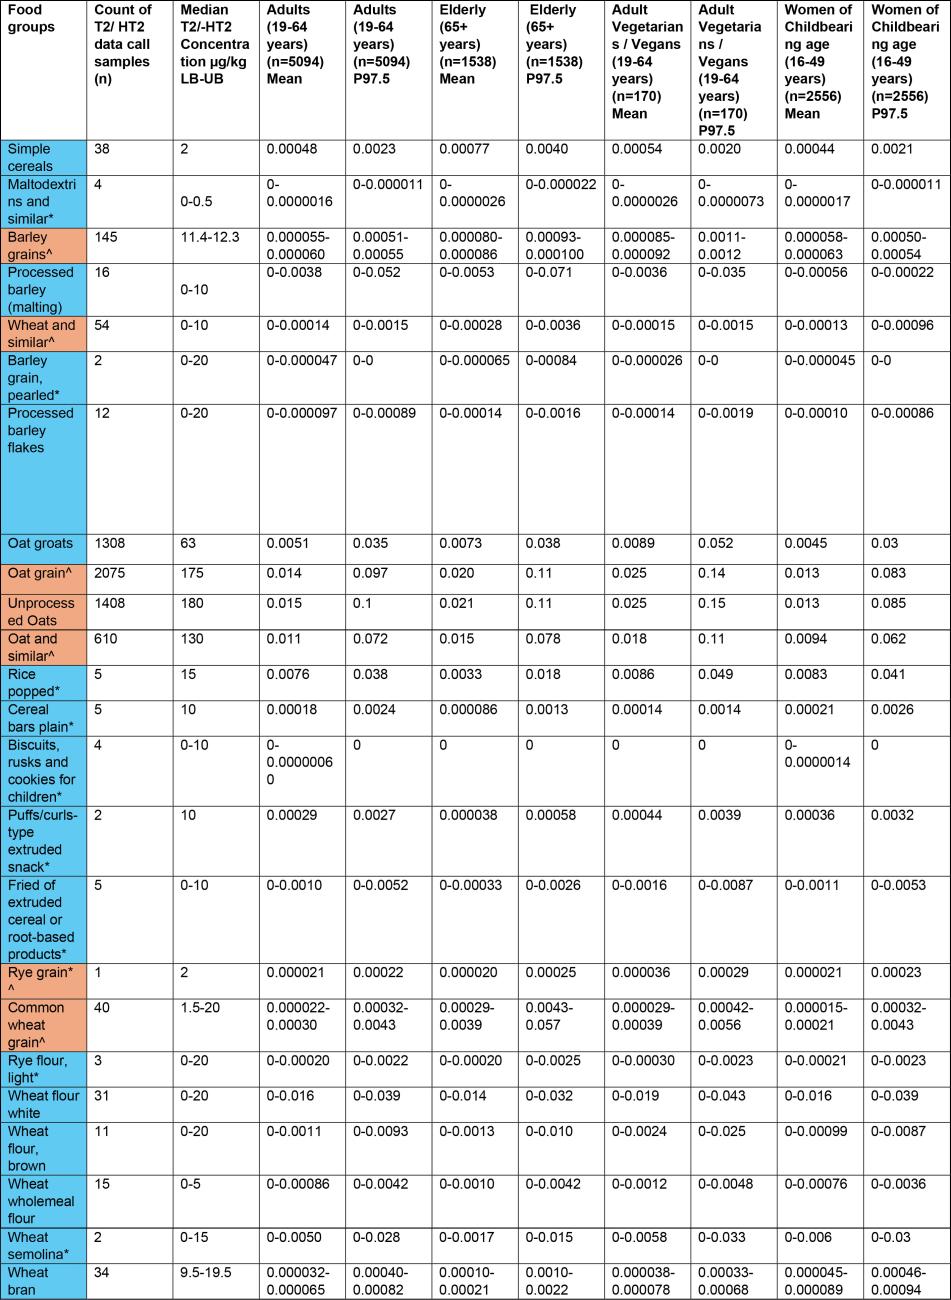
Table 2c: Estimates of chronic exposure to sum of T2/HT2 from various processed and unprocessed food products based on NDNS years 1-11 consumption data and occurrence data collected from the FSA call. The table has 11 columns and 24 rows. The table colour key: Blue = processed, Orange = unprocessed.
Estimates have been rounded to 2 significant figures.
*Low occurrence sample numbers (concentration values are based on <10 samples).
LB - Lower bound: values below the limit of quantification (LOQ) are treated as zero; UB - Upper bound: values below the LOQ are treated as at the LOQ.
^Uncertainty on extent of processing of food groups which may affect robustness of occurrence data used in exposure calculations.
Table 2c: Estimates of chronic exposure to sum of T2/HT2 from various processed and unprocessed food products based on NDNS years 1-11 consumption data and occurrence data collected from the FSA call.
Exposure-Sum of T2/HT2 (µg/kg bw/day) LB-UB
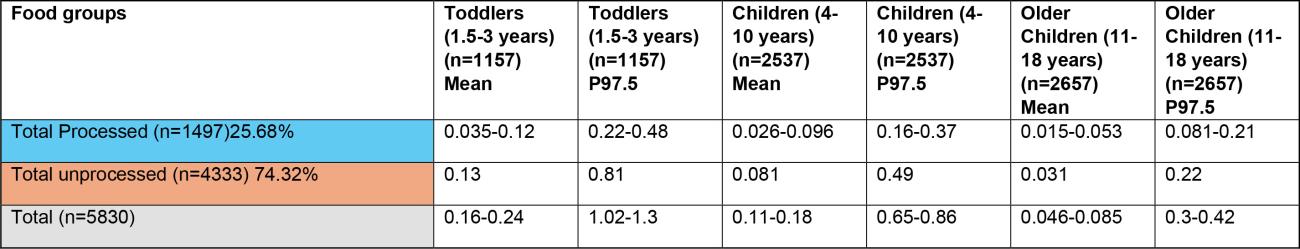
Table 2c: Estimates of chronic exposure to sum of T2/HT2 from various processed and unprocessed food products based on NDNS years 1-11 consumption data and occurrence data collected from the FSA call. The table has 7 columns and 3 rows. The table colour key: Blue = processed, Orange = unprocessed.
Estimates have been rounded to 2 significant figures.
*Low occurrence sample numbers (concentration values are based on <10 samples).
LB - Lower bound: values below the limit of quantification (LOQ) are treated as zero; UB - Upper bound: values below the LOQ are treated as at the LOQ.
^Uncertainty on extent of processing of food groups which may affect robustness of occurrence data used in exposure calculations.
Table 2d: Estimates of chronic exposure to sum of T2/HT2 from various processed and unprocessed food products based on NDNS years 1-11 consumption data and occurrence data collected from the FSA call.
Exposure-Sum of T2/HT2 (µg/kg bw/day) LB-UB
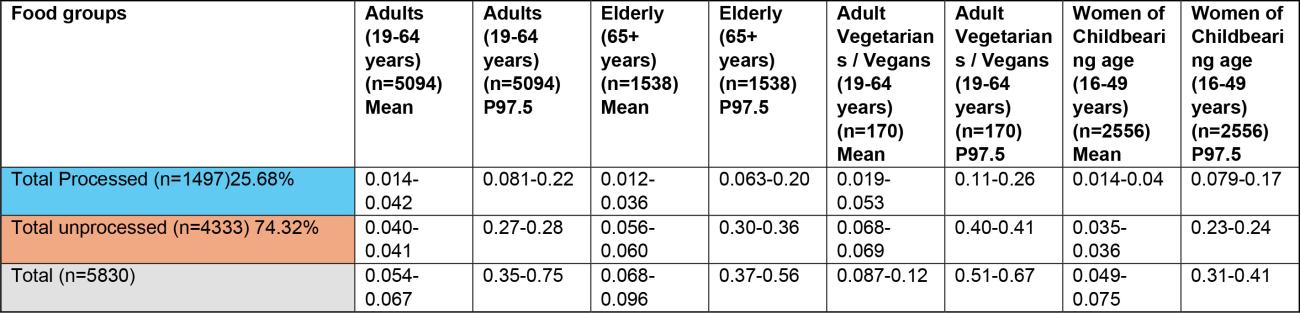
Table 2d: Estimates of chronic exposure to sum of T2/HT2 from various processed and unprocessed food products based on NDNS years 1-11 consumption data and occurrence data collected from the FSA call. The table has 9 columns and 3 rows. The table colour key: Blue = processed, Orange = unprocessed.
Estimates have been rounded to 2 significant figures.
*Low occurrence sample numbers (concentration values are based on <10 samples).
LB - Lower bound: values below the limit of quantification (LOQ) are treated as zero; UB - Upper bound: values below the LOQ are treated as at the LOQ.
^Uncertainty on extent of processing of food groups which may affect robustness of occurrence data used in exposure calculations.
43. The highest chronic exposures from the processed food group were from oat groats (mean and 97.5th percentile of 0.016 and 0.1 µg/kg bw, respectively) and popped rice (mean and 97.5th percentile of 0.014 and 0.0184 µg/kg bw, respectively) in toddlers (1.5-3 years).
44. The highest chronic exposure for unprocessed food groups were from unprocessed oats (mean and P97.5 of 0.047 and 0.3 µg/kg bw), oat grain (mean and P97.5 of 0.045 and 0.29 µg/kg bw) and oat and similar (mean and P97.5 of 0.034 and 0.22 µg/kg) in toddlers (1.5-3 years).
45. The highest acute exposure from a processed food group were from oat groats (mean and P97.5 of 0.035 and 0.2 µg/kg bw) and popped rice (mean and P97.5 of 0.038 and 0.2 µg/kg bw) in toddlers (1.5-3 years).
46. The highest acute exposure for unprocessed food groups were from unprocessed oats (mean and P97.5 of 0.1 and 0.57 µg/kg bw), oat grain (mean and P97.5 of 0.098 and 0.55 µg/kg bw) and oat and similar (mean and P97.5 of 0.073 and 0.41 µg/kg) in toddlers (1.5-3 years).
Risk characterisation - Risk Assessment of T-2 and HT-2 mycotoxins in Food
In this guide
In this guide47. The estimated acute and chronic exposures are expressed as percentages of EFSA’s ARfD and TDI in order to assess acute and chronic health risks (as shown below in Tables 3 and 4 below), respectively.
Table 3: Estimates of total acute exposure to sum of T2/HT2 as a % of EFSA’s ARfD of 0.3 μg/kg bw.
|
Type |
Toddlers (1.5-3 yrs); mean |
Toddlers (1.5-3 yrs); P97.5 |
Children (4-10 yrs); mean |
Children (4-10 yrs); P97.5 |
Older children (11-18 yrs); mean |
Older children (11-18 yrs); P97.5 |
Adults (19-64 yrs); mean |
Adults (19-64 yrs); P97.5 |
Elderly (65+ yrs); mean |
Elderly (65+ yrs); P97.5 |
Adult vegetarians/vegans (19-64 yrs); mean |
Adult vegetarians/vegans (19-64 yrs); P97.5 |
Women of childbearing age (16-49 yrs); mean |
Women of childbearing age (16-49 yrs); P97.5 |
|
Total unprocessed (LB-UB) |
90 |
500 |
60 |
313 |
24 |
150 |
25 |
147 |
31 |
143-193 |
43 |
223 |
23 |
137 |
|
Total processed (LB-UB) |
29-83 |
157-327 |
15-70 |
83-217 |
12-40 |
60-147 |
11-30 |
53-163 |
4-37 |
40-143 |
10-33 |
63-170 |
11-29 |
53-113 |
Table 4: Estimates of total chronic exposure to sum of T2/HT2 as a % of EFSA’s TDI of 0.02 μg/kg bw.
|
Type |
Toddlers (1.5-3 yrs); mean |
Toddlers (1.5-3 yrs); P97.5 |
Children (4-10 yrs); mean |
Children (4-10 yrs); P97.5 |
Older children (11-18 yrs); mean |
Older children (11-18 yrs); P97.5 |
Adults (19-64 yrs); mean |
Adults (19-64 yrs); P97.5 |
Elderly (65+ yrs); mean |
Elderly (65+ yrs); P97.5 |
Adult vegetarians/vegans (19-64 yrs); mean |
Adult vegetarians/vegans (19-64 yrs); P97.5 |
Women of childbearing age (16-49 yrs); mean |
Women of childbearing age (16-49 yrs); P97.5 |
|
Total unprocessed (LB-UB) |
650 |
4050 |
405 |
2450 |
155 |
1100 |
200 |
1350 |
280-300 |
1500-1800 |
340-345 |
2000-2050 |
175 |
1150 |
|
Total processed (LB-UB) |
175-600 |
1100-2400 |
130-480 |
800-1850 |
75-265 |
405-1050 |
70-210 |
405-1100 |
60-180 |
315-1000 |
95-265 |
550-1300 |
70-200 |
395-850 |
48. All of the estimated mean acute exposures for the sum of T2/HT2 in all processed foods are below the ARfD and are therefore not of toxicological concern.
49. However, 97.5th percentile acute exposures for the sum of T2/HT2 in all processed food exceeded the ARfD in all age groups, with the highest exceedance being up to 3.3-fold in toddlers (aged 1.5-3 years). There are also exceedances of up to 2.2-fold for children (aged 4-10 years), up to 1.5-fold for older children (aged 11-18 years), up to 1.6-fold for adults (aged 19-64 years), and up to 1.4-fold for the elderly (aged 65+ years),
50. Furthermore, using 97.5th percentile acute exposures, there are exceedances of the ARfD of up to 1.7-fold for adult vegetarians/vegans (aged 19-64 years), and up to 1.1-fold for women of childbearing age (16-49 years).
51. As shown in Table 4, there are substantial exceedances of the TDI at both the mean and 97.5th percentile levels of chronic consumption of processed food.
Acute exposure
52. As shown in Table 3, estimated mean exposures of the sum of T2/HT2, do not exceed the ARfD for either processed or unprocessed food, indicating no health concern.
53. However, there are some exceedances of the ARfD at the 97.5th percentile estimated exposures. The highest exceedance is up to 3-fold in toddlers (aged 1.5-3 years), while children (aged 4-18 years) and adults (aged 19-64 years) exceed the ARfD 2-fold and the elderly (aged 65+ years) are at/slightly above the ARfD.
54. Adult vegetarians/vegans (aged 19-64 years) exceed the ARfD 2-fold, while women of childbearing age (16-49 years) are at the ARfD, for high consumption (97.5th percentile).
55. Given the uncertainties in the exposure assessment (listed below), it is unlikely that these exceedances pose a significant health concern. Furthermore, it is unlikely that the consumption rate for the average consumer would be at the 97.5th percentile for each food category used for the total exposure assessment across the general diet.
Chronic exposure
56. As shown in Table 4, estimated mean and 97.5th percentile chronic exposures to T2/HT2 for both processed and unprocessed food exceed the TDI, for all consumer groups. These exceedances indicate a health concern.
57. The estimated mean chronic exposure for the sum of T2/HT2 in all processed food exceed the TDI in all age groups, with the highest exceedance being up to 6-fold in toddlers (aged 1.5-3 years). There are also exceedances of up to 5-fold for young children (aged 4-10 years), up to 3-fold for older children (aged 11-18 years) and up to 2-fold for adults (aged 19-64 years) and the elderly (aged 65+ years). Adult vegetarians/vegans (aged 19-64 years) and women of childbearing age (16-49 years) exceed the TDI 3- and 2-fold, respectively.
58. Estimated 97.5th percentile chronic exposure estimates for the sum of T2/HT2 in all processed food exceed the TDI in all age groups, with the highest exceedance being up to 24-fold in toddlers (aged 1.5-3 years). There are also exceedances of up to 19-fold for children (aged 4-10 years), up to 11-fold for older children (aged 11-18 years) and for adults (aged 19-64 years), and up to 10-fold for the elderly (aged 65+ years). Adult vegetarians/vegans (aged 19-64 years) exceed the TDI 13-fold, while women of childbearing age (16-49 years) exceed the TDI 9-fold. However, the uncertainties of the exposure assessment (listed below), might affect the interpretation of these findings, and whether or not they represent a health concern.
Uncertainties
59. There are several uncertainties regarding the occurrence data in this assessment that may lead to an overestimation of the actual exposure in the UK population.
- In the UK and Ireland, it is common for grain to be delivered to the mill ‘as harvested’ i.e. uncleaned and unprocessed with the husk still intact. Where mycotoxin contamination may be more associated with the outer layers of the grain this may exhibit higher levels of contamination. A large proportion of data submitted as part of the data call were from such unprocessed grains which show higher levels of contamination compared to cleaned, processed grains. The range of the sum of T2/HT2 toxin reduction rates by dehulling has been estimated as 60 to 97% (D Croucher, 2023).
- The NDNS consumption data is based on food as consumed whereas the occurrence data received were largely for unprocessed forms (the food consumption data are as consumed; no processing factors have been applied). Exposure assessments for unprocessed foods have been included in this assessment, in the absence of sufficient data on processed data, however this may result in an overestimation of actual exposure.
- The NDNS does not include pregnant or lactating women, therefore data for women of childbearing age (16-49 years) were used as a proxy and therefore may not be representative of the maternal diet.
- The total estimates are likely to overestimate exposure, particularly at the 97.5th percentile, given that an individual is unlikely to be a high-level consumer of all the foods listed in Tables 1-2.
- The occurrence data of T2/HT2 in processed foods makes up a very small fraction of data samples received by industry. While the respective exposures give an indication of the risk from final products, this may not be representative.
Conclusions - Risk Assessment of T-2 and HT-2 mycotoxins in Food
In this guide
In this guide60. Based on the acute risk assessment, it is unlikely that there is an acute health concern to UK consumers. Mean estimates of total acute exposure to T2/HT2 across the diet are below the ARfD and given the uncertainties in the data it is unlikely that the exceedances for 97.5th percentile estimated exposures pose a significant risk to consumers.
61. While the same uncertainties apply to chronic exposure estimates, the estimated chronic exposures to T2/HT2 significantly exceed the TDI, at mean but especially high consumption. A health concern to the UK population can therefore not entirely be excluded.
62. However, it should be noted that the sample size making up the sum of processed foods is very small and may therefore not be representative.
Questions on which the views of the Committee are sought:
63. Members are invited to consider the following questions:
i) Given the uncertainties of the exposure assessment, do Members consider there to be a health risk associated with:
- any of the exceedances of the ARfD shown in Table 3?
- any of the exceedances of the TDI shown in Table 4?
ii) Would the Committee like to see any further information or data analysis to support this risk assessment, such as annual trend analysis?
Secretariat
June 2024
Abbreviations - Risk Assessment of T-2 and HT-2 mycotoxins in Food
In this guide
In this guide|
5-HT |
5-hydroxytryptamine |
|
ARfD |
acute reference dose |
|
BMD |
benchmark dose |
|
BMDL |
95 % lower confidence limit for benchmark dose |
|
BMR |
benchmark response |
|
bw |
bodyweight |
|
DH |
Department of Health |
|
DNA |
deoxyribonucleic acid |
|
DNSIYC |
Diet and Nutrition Survey in Infants and Young Children |
|
ED50 |
dose causing emesis in 50 % of animals tested |
|
EFSA |
European Food Safety Authority |
|
FAO |
Food and Agriculture Organization of the United Nations |
|
Hb |
Haemoglobin |
|
HBGV |
health based guidance value |
|
HT2 |
HT2 toxin |
|
i.p. |
intraperitoneal |
|
JECFA |
Joint FAO/WHO Expert Committee on Food Additives |
|
kg |
kilogram |
|
LB |
lower bound |
|
LOAEL |
lowest observed adverse effect level |
|
LOEL |
lowest observed effect level |
|
LOD |
limit of detection |
|
LOQ |
limit of quantification |
|
μg |
microgram |
|
MCHb |
mean corpuscular haemoglobin |
|
MCV |
mean corpuscular volume |
|
mg |
milligram |
|
NDNS |
National Diet and Nutrition Survey |
|
NEO |
neosolaniol |
|
NOAEL |
no-observed adverse effect level |
|
PCV |
packed cell volume |
|
PMTDI |
provisional maximum tolerable daily intake |
|
ppm |
parts per million |
|
PYY3-36 |
anorectic peptide pancreatic peptide YY3-36 |
|
RNA |
ribonucleic acid |
|
RPF |
relative potency factor |
|
SCF |
Scientific Committee on Food |
|
T2 |
T2 toxin |
|
TDS |
total diet study |
|
TEC |
total erythrocyte counts |
|
TLC |
total leucocyte counts |
|
TTC |
total thrombocyte counts |
|
tTDI |
temporary tolerable daily intake |
|
UB |
upper bound |
|
UBMD |
95 % upper confidence limit for benchmark dose |
|
WHO |
World Health Organization |
References - Risk Assessment of T-2 and HT-2 mycotoxins in Food
In this guide
In this guideBates, B.; Lennox, A.; Prentice, A.; Bates, C.; Page, P.; Nicholson, S.; Swan, G. (2014) National Diet and Nutrition Survey Results from Years 1, 2, 3 and 4 (combined) of the Rolling Programme (2008/2009 – 2011/2012) Main heading (publishing.service.gov.uk).
Bates, B.; Cox, L.; Nicholson, S.; Page, P.; Prentice, A.; Steer, T.; Swan, G. (2016) National Diet and Nutrition Survey Results from Years 5 and 6 (combined) of the Rolling Programme (2012/2013 – 2013/2014) Main heading (publishing.service.gov.uk).
Bates, B.; Collins, D.; Jones, K.; Page, P.; Roberts, C.; Steer, T.; Swan, G.(2020) National Diet and Nutrition Survey Results from years 9, 10 and 11 (combined) of the Rolling Programme (2016/2017 to 2018/2019). National Diet and Nutrition Survey (publishing.service.gov.uk).
COT (2018) Statement of T-2 toxin (T2), HT-2 toxin (HT2) and neosolaniol (NEO) in the diet of infants aged 0 to 12 months and children aged 1 to 5 years. cotstatement-t2ht2andneosolaniol.pdf (food.gov.uk).
COT (2021) Statement on the potential risk(s) of combined exposure to mycotoxins. Combined exposure to mycotoxins report (food.gov.uk).
Croucher D. (2023) United Kingdom Oat Supply in the context of the Food Standards Agency / Food Standards Scotland Call for Data on T-2 and HT-2 Toxins. A Science & Evidence Based Review including additional data on UK Milling Barely. Confidential.
EFSA (2011a) Scientific Opinion on the risks for animal and public health related to the presence of T2 and HT2 toxin in food and feed. EFSA Journal 9(12): 2481. T-2 and HT-2 toxins in food and feed | EFSA (europa.eu).
EFSA (2011b) Use of BMDS and PROAST software packages by EFSA Scientific Panels and Units for applying the Benchmark Dose (BMD) approach in risk assessment. EN-113. pp190. Use of BMDS and PROAST software packages by EFSA Scientific Panels and Units for applying the Benchmark Dose (BMD) approach in risk assessment | EFSA (europa.eu).
EFSA (2017a) Appropriateness to set a group health based guidance value
for T2 and HT2 toxin and its modified forms. EFSA Journal 51(1): 4655. Appropriateness to set a group health based guidance value for T2 and HT2 toxin and its modified forms | EFSA (europa.eu).
EFSA (2017b) Update: use of the benchmark dose approach in risk assessment. EFSA Journal 15(1): 4658. Update: use of the benchmark dose approach in risk assessment - - 2017 - EFSA Journal - Wiley Online Library.
FAO/WHO (2001) WHO Food Additive Series: 47. Safety evaluation of certain mycotoxins in food. T-2 AND HT-2 TOXINS (JECFA 47, 2001) (inchem.org).
Gordon G. (1985) Ipecacuanha induced emesis in the treatment of self-poisoned adults. Archives of Emergency Medicine 2: 203-208.
JECFA (2022) Summary of Conclusions of 93rd meeting of JECFA 93rd Joint FAO/WHO Expert Committee on Food Additives (JECFA) - Food additives. Summary and conclusions. 2022.
JECFA (2023) Evaluation of certain contaminants in food: ninety-third report of the Joint FAO/WHO Expert Committee on Food Additives. Evaluation of certain contaminants in food: ninety-third report of the Joint FAO/WHO Expert Committee on Food Additives.
Nathanail A.V., Varga E., Meng-Reiterer J., et al. (2015) Metabolism of the Fusarium Mycotoxins T-2 Toxin and HT-2 Toxin in Wheat. J. Agric. Food Chem. 63: 7862–7872.
Percie du Sert N., Holmes A.M., Wallis R., et al. (2012) Predicting the emetic liability of novel chemical entities: a comparative study. British Journal of Pharmacology 165: 1848-1867.
Pfeiffer R.L., Swanson S.P. & Buck W.B, (1988) Metabolism of T-2 toxin in rats – effects of dose, route, and time. Journal of Agricultural and Food Chemistry, 36: 1227-1232.
Rafai P., Tuboly S., Bata A., et al. (1995a) Effect of various levels of T2 toxin in the immune system of growing pigs. Vet. Rec. 136: 511-514 Effect of various levels of T-2 toxin in the immune system of growing pigs - PubMed (nih.gov).
Rafai P., Bata A., Vanyi A., et al. (1995b) Effect of various levels of T2 toxin on the clinical status, performance and metabolism of growing pigs. Vet. Rec. 136: 485-489.
Rahman S., Sharma A.K., Singh N.D., et al. (2014) Clinico-haematological changes in T2 toxicosis in Wistar rats. Indian Journal of Veterinary Pathology. 38: 22-28. http://dx.doi.org/10.5958/0973-970X.2014.01129.8
Roberts, C.; Steer, T.; Maplethorpe, N.; Cox, L.; Meadows, S.; Page, P.; Nicholson, S.; Swan, G. (2018) National Diet and Nutrition Survey Results from Years 7 and 8 (combined) of the Rolling Programme (2014/2015 – 2015/2016) National Diet and Nutrition Survey (publishing.service.gov.uk).
SCF (2002) Opinion of the Scientific Committee on Food on Fusarium toxins.
Part 6: Group evaluation of T2 toxin, HT2 toxin, nivalenol and deoxynivalenol. Opinion of the Scientific Committee on Food on Fusarium toxins. Part 6: Group evaluation of T-2 toxin, HT-2 toxin, Nivaleno... (europa.eu).
Wu W., Zhou H., Bursian S.J., et al. (2016) Emetic responses to T2 toxin, HT2 toxin and emetine correspond to plasma elevations of peptide YY3-36 and 5-hydroxytryptamine. Archives of Toxicology. 90: 997-1007. Emetic responses to T-2 toxin, HT-2 toxin and emetine correspond to plasma elevations of peptide YY3-36 and 5-hydroxytryptamine - PubMed (nih.gov).
Zhang F., Wang L., Yang Z-H., et al. (2006) Value of mink vomit model in study of anti-emetic drugs. World J. Gastroenterol. 12(8): 1300-1302.