Introduction
In this guide
In this guideOn this page
Skip the menu of subheadings on this page.Type A trichothecenes
6. T-2 and HT-2 are type A trichothecenes which are produced by a variety of Fusarium and other fungal species. Fusarium species grow and invade crops and produce T-2 and HT-2 under cool, moist conditions prior to harvest. They are found predominantly in cereal grains, in particular oat grain, barley grain and wheat grain and products thereof, i.e. foods prepared from recipes containing cereal grains. (JECFA, 2016).
7. The chemical structures of T-2 and HT-2 are shown below in Figure 1.
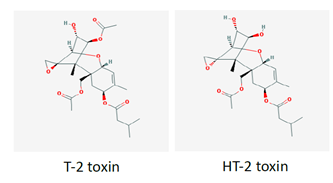
Figure 1 gives the chemical structures of the mycotoxins T-2 and HT-2. Figure 1 is shown in grey, black and red line with red and grey text on a grey background.
Figure 1. Chemical structures of T-2 and HT-2 (PubChem, 2026).
Occurrence data
8. As part of this assessment, occurrence data on T-2 and HT-2 (only) in food were acquired through a nationwide call for evidence (FSA, 2023). This call was issued by the FSA and FSS in July 2023 and officially closed in October 2023. However, the FSA and FSS continued to receive data up until February 2024. The data call included cereal grains, both pre- and post- cleaning/dehulling, and finished products. Where possible, data spanning multiple years were included to reflect any annual variability of T-2 and HT-2 levels. The data received (n >8000) covered the UK harvest seasons from 2004 to 2023. Sampling data for RTE food products were also submitted for 2013 (n=60), 2014 (n=60) and 2024 (n=90).
9. The FSA and FSS received occurrence data on T-2 and HT-2 (only) either as the sum of T-2 and HT-2 or as the individual mycotoxins. The format and level of detail provided by the respondents varied, but the data included occurrence levels in processed and unprocessed cereal grains, cereal products and a small number of RTE foods. The occurrence data submitted to the FSA and FSS were predominantly on unprocessed/raw materials which were yet to undergo any cleaning. Occurrence data on grains submitted by industry as ‘already processed’ refers to grains that have been dehulled and cleaned but remain as a commodity; that is, they have not been incorporated in any RTE foods. Submitted data on RTE foods included biscuits, rusks and cookies, extruded cereal seed or root-based products, cereal bars, infant formula milk-based powder, oat porridge, muesli, mixed breakfast cereals, bread and rolls.
10. The data were collated, cleaned and assured by the FSA. The quality assurance (QA) methodology aligned with the main principles outlined in Treasury Guidance (Aqua Book; UK HM Treasury, 2015) and the guidelines in the Government Data Quality Framework (UK Government Data Quality Hub, 2020) on data quality rules.
11. Prior to the data cleaning, a verification exercise was undertaken by the FSA to account for missing limit of quantification (LOQ) and/or limit of detection (LOD) values and sample type categorisation. For these amendments, assumptions were made based on the descriptors and values included by the submitters, such as the descriptors provided for commodity types based on the sample identification codes. To include data without compromising scientific integrity, data were included when all of the following criteria were satisfied:
- Datapoints with reported LOQ > 0.
- Datapoints where the FoodEx (EFSA, 2025) code could be defined.
- Sample codes referred to products destined for human consumption (not feed).
12. To estimate the median lower bound (LB) sum of T-2 and HT-2, values at or below the LOQ were assumed to be zero. To estimate the median upper bound (UB) occurrence levels, values at or below the LOQ were assumed to be at the LOQ; values above the LOQ were used as reported.
13. For grains, to allow for a direct comparison with the group HBGV (which is for the sum of both mycotoxins), only analytically determined data on the sum of T-2 and HT-2 were considered in the exposure assessment. For RTE foods, due to the limited data available, all reported values were considered, including individual T-2 or HT-2 occurrence data.
Seasonal variability
14. The presence of T-2 and HT-2 in crops is dependent on the weather at key growth stages, such as flowering, and can demonstrate large annual variability. While good agricultural practices are available to manage the occurrence of mycotoxins in general, they have not proven to be effective for T-2 and HT-2, whose occurrence in crops is markedly affected by climate/weather.
15. Currently, liquid chromatography mass spectrometry (LC-MS) and gas chromatography-mass spectrometry (GC-MS) are the primary techniques employed for testing T-2 and HT-2 contamination levels in the laboratory. Commercially available rapid diagnostics kits delivering the simultaneous measurement of T-2 and HT-2 toxins include enzyme-linked immunosorbent assays (ELISAs), lateral flow devices (LFDs)/dipstick assays and fluorescence polarisation immunoassays (FPIAs) (Safefood, 2024). However, recent assessments by industry report large variability between the available methods, and performance characteristics such as LODs and LOQs are often unsatisfactory (Safefood, 2024). This makes it difficult to reliably detect these toxins in samples. In addition, currently available test kits would not automatically be ‘fit for purpose’ (Safefood, 2024) because rapid tests must be accurate, reproducible and provide the required sensitivity for regulatory compliance.
16. The data received from the call for evidence covers the years 2004-2024. This spans a period either side of Commission Recommendation 2013/165/EU on the presence of T-2 and HT-2 toxin in cereals and cereal products. Generally, the highest mean levels of the sum of T-2 and HT-2 received via the data call (i.e. the mean level based on all data points for each respective year) were reported in the years 2008 to 2014, with lower levels being detected thereafter. The year 2014 is still recognised as being associated with a particularly high prevalence of T-2 and HT-2. A study by Xu et al. (2014) showed that accumulation of T-2 and HT-2 mycotoxins in field oat grains in the UK that year was positively correlated with warm and wet conditions during early May and dry conditions thereafter, when toxin levels likely remained high because dry weather reduced their leaching or loss from the plant. This illustrates the importance of reviewing levels across extended periods of time to allow for seasonal variation in the occurrence of T-2 and HT-2.
17. Figures 2a-c show annual occurrence data for the sum of T-2 and HT-2 in three categories of unprocessed cereal grains (oats, barley, and wheat). The values shown are the mean values per year, calculated based on all data points received for the respective year. To provide a representative analysis of current exposure patterns, only the last 10 years of occurrence data were included (2014- 2024); occurrence data from before 2013, the year the initial food safety Recommendation came into force, were excluded.
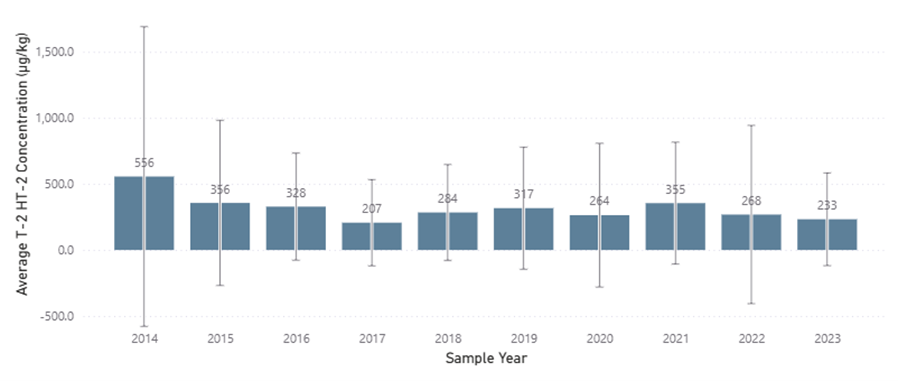
Figure 2a. is a bar chart with error bars showing yearly average concentrations. The bars represent the average T-2/HT-2 concentration for each sample year. The vertical lines extending above and below each bar are the error bars show the standard deviation. The x‑axis lists the years, and the y‑axis shows the concentration values. The bars are shown in a dark blue colour, the axis labelling in gey and black text.
Figure 2a. Mean value of the sum of T-2 and HT-2 per year for unprocessed oat grains. The mean value is based on all data points for the respective year(s), as submitted by industry in response to the call for evidence. The error bars shown in the figure represent the standard deviation. The number of samples per year are as follows: 2014 (n = 440), 2015 (n = 617), 2016 (n = 244), 2017 (n = 397), 2018 (n = 367), 2019 (n = 604), 2020 (n = 727), 2021 (n = 480), 2022 (n = 634), 2023 (n = 195).
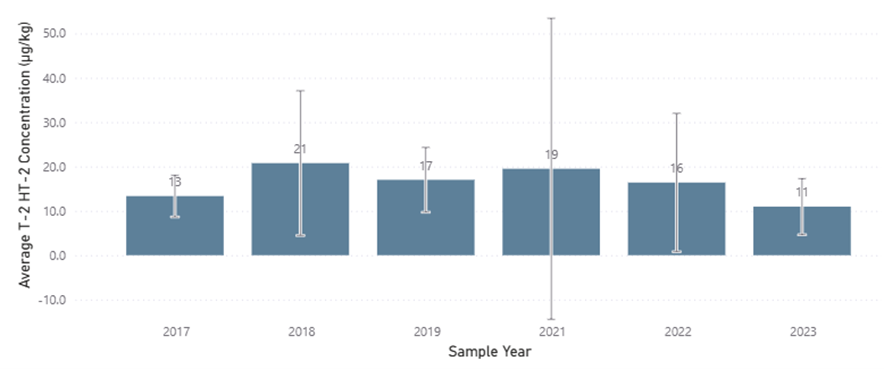
Figure 2b. Mean value of the sum of T-2 and HT-2 per year for unprocessed barley grains. The mean value is based on all data points for the respective year(s), as submitted by industry in response to the call for evidence. The error bars represent the standard deviation. The number of samples per year are as follows: 2017 (n = 6), 2018 (n = 21), 2019 (n = 6), 2021 (n = 123), 2022 (n = 123), 2023 (n = 65). The bars are shown in a dark blue colour, the axis labelling in gey and black text.
Figure 2b. Mean value of the sum of T-2 and HT-2 per year for unprocessed barley grains. The mean value is based on all data points for the respective year(s), as submitted by industry in response to the call for evidence. The error bars represent the standard deviation. The number of samples per year are as follows: 2017 (n = 6), 2018 (n = 21), 2019 (n = 6), 2021 (n = 123), 2022 (n = 123), 2023 (n = 65).
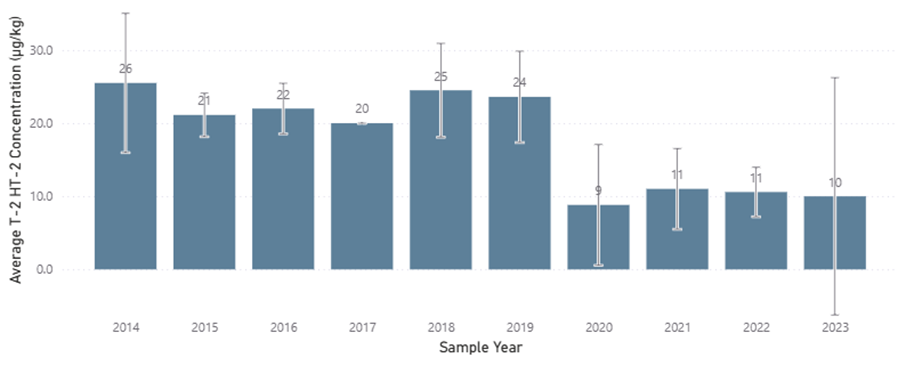
Mean value of the sum of T-2 and HT-2 per year for unprocessed wheat grains. The mean value is based on all data points for the respective year(s), as submitted by industry in response to the call for evidence. The error bars represent the standard deviation. Please note, due to the sample number for 2017 being 1, the standard deviation could not be calculated. The number of samples per year are as follows: 2014 (n = 4), 2015 (n = 8), 2016 (n = 8), 2017 (n = 1), 2018 (n = 6), 2019 (n = 5), 2020 (n = 11), 2021 (n = 168), 2022 (n = 163), 2023 (n = 28). The bars are shown in a dark blue colour, the axis labelling in gey and black text.
Figure 2c. Mean value of the sum of T-2 and HT-2 per year for unprocessed wheat grains. The mean value is based on all data points for the respective year(s), as submitted by industry in response to the call for evidence. The error bars represent the standard deviation. Please note, due to the sample number for 2017 being 1, the standard deviation could not be calculated. The number of samples per year are as follows: 2014 (n = 4), 2015 (n = 8), 2016 (n = 8), 2017 (n = 1), 2018 (n = 6), 2019 (n = 5), 2020 (n = 11), 2021 (n = 168), 2022 (n = 163), 2023 (n = 28).
18. It is important to note that Figures 2a-c are purely a visualisation of how the measured levels of mycotoxins have changed over time. No one factor which was driving the changes observed in the mycotoxin levels across the different years could be identified because of variability in the amount and quality of information provided by industry in response to the call for evidence. The annual variation depicted in Figures 2a-c could be a consequence of factors such as i) climate, i.e. changes in the weather from one year to the next; ii) time from harvest to sampling, and from sampling to measurement of mycotoxin levels; iii) conditions and duration of storage, and iv) changes in sampling practices.
Reduction factors for unprocessed cereal grains
19. Unprocessed oat grains intended for human consumption include an outer hull. This is the part of the grain that is often most contaminated. The outer hull is removed during processing. This so-called ‘de-hulling’ process significantly reduces the level of contamination.
20. A literature search was conducted to identify information on the reduction of T-2 and HT-2 mycotoxin levels in cereal grains during processing. A ‘reduction factor’, when used in exposure calculations, takes into account the expected decrease in T-2 and HT-2 levels in unprocessed cereal grains once they are processed, i.e. cleaned and de-hulled. Applying reduction factors therefore allows more accurate representation of consumer exposure to T-2 and HT-2 and results in a more realistic exposure assessment. Several reduction factors for the sum of T-2 and HT-2 for oat grains were identified in the scientific literature; these ranged from 66 to 100 % (Meyer et al., 2022; Schwake-Anduschus et al., 2010; EFSA, 2011; Pettersson 2008). For this assessment, a reduction factor of 85 % from Meyer et al. (2022) was applied; this means that all T-2 and HT-2 occurrence values for unprocessed oats were reduced by 85 %.
21. The factor of 85 % was chosen because it was the most scientifically robust as well as from the most recently conducted study. Although the reduction factor of 85 % was specifically for large oat kernels, Meyer et al. (2022) noted that “milling oats are traded to contain less than 10 % of thin oats below 2 mm slotted hole sieve” (up to 90 % of the oats may be composed of larger kernels). Therefore, this reduction factor was considered to be relevant to this exposure assessment.
22. Some cultivars of oat and barley are hulless. Polišenská et al. (2020) note that “special attention should be paid to the risk of their contamination by Fusarium mycotoxins, as the rate of mycotoxin reduction during processing could be much lower than that for hulled cereals”. In the UK, however, hulless cultivars of oats are typically used for animal feed and not for human consumption so this risk is not expected to affect consumers directly.
23. No reduction factors were identified for maize or barley. The limited information available suggested that the starting levels and incidence of T-2 and HT-2 in wheat and maize were very low and limited data were available on their fate or how their levels change during manufacturing of RTE food products (Scudamore, 2009). Pascale et al. (2011) calculated an overall reduction of T-2 and HT-2 toxins by 54 % following the processing of durum wheat. However, the samples used in this study were artificially inoculated with Fusarium and the high concentrations of T-2 and HT-2 detected were unlikely to reflect concentrations under natural conditions. Furthermore, the percentage reduction might not be linear and might be less at lower levels of contamination. Given the limited information available it was unclear whether, or to what extent, processing reduces T-2 and HT-2 contamination in wheat, maize or barley under natural conditions; no reduction factor was therefore applied in this assessment.