Statement on the risk for T-2 and HT-2 mycotoxins in food
Background
In this guide
In this guide1. The mycotoxins T-2 and HT-2 were previously assessed by the Committee on Toxicity of Chemicals in Food, Consumer Products and the Environment (COT) in 2018 (COT, 2018) and 2021 (COT, 2021), reviewing their presence in the diet of infants and young children and the potential implications of combined mycotoxin exposure, respectively. The assessment in 2018 was based on a 2015 survey of mycotoxins in oat-based products (FSA, 2015). Estimated overall chronic dietary exposure to T-2 and HT-2 from consumption of oats and oat-based products was below the tolerable daily intake (TDI) for all age groups ranging from 4 months to adults aged 19 years and above, including high level consumers. The results of this survey, therefore, did not indicate a risk to consumer health from T-2 and HT-2 exposures. The COT was, however, unable to complete a risk assessment on the potential risk(s) from combined exposure to mycotoxins, mainly due to the lack of information on co-occurrence in food (COT, 2021).
2. In 2020, the European Commission (EC) proposed establishing maximum levels (MLs) for the mycotoxins T-2 and HT-2 in foods. These were lower than levels previously set out in the European Commission Recommendation 2013/165/EU. Following the proposal, MLs came into force in the European Union (EU) on the 1st of July 2024. These MLs were established for the sum of T-2 and HT-2 toxins only. MLs were not established for modified forms of T-2 and HT-2 (such as neosolaniol (NEO) or 4,15-diacetoxyscirpenol (DAS)) due to limited occurrence data and the absence of a suitable routine method available for their analysis. In light of the new EU MLs, the COT was asked by the Food Standards Agency (FSA) to assess the level of risk to UK consumers from dietary exposure to T-2 and HT-2 mycotoxins only.
3. As part of this work, in February 2023, the COT considered “the existing health-based guidance values (HBGVs) for T-2 and HT-2 mycotoxins set by the European Food Safety Authority (EFSA) and the Joint FAO/WHO Expert Committee on Food Additives (JECFA)” (TOX/2023/04). Following consideration of the evidence base for both evaluations the COT remained content, based on the scientific evidence, to align with the HBGVs derived by EFSA in 2017.
4. To assist the COT with the new assessment of the risk to UK consumers of T-2 and HT-2 from food, the FSA and Food Standards Scotland (FSS) undertook a call for evidence from July 2023 to October 2023. While T-2 and HT-2 have been detected in products of animal origin (POAO), probably due to contamination of feed (EFSA, 2017b), the EU has not introduced MLs for POAO and the FSA/FSS did not include occurrence data for meat and dairy products in its call for evidence. In line with the new European MLs for T-2 and HT-2, the data call focussed on the collection of occurrence data for T-2 and HT-2 from the cereals supply chain, from field level to ready to eat (RTE) food products. The EU did not establish MLs for these due to limited occurrence data and the absence of a suitable routine method available for their analysis. Modified forms of T-2 and HT-2 (such as NEO or DAS) were not included in the call for evidence and are not considered here. A discussion paper focussing on exposure to T-2 and HT-2 was presented to the COT in July 2024 (TOX/2024/24) and in March 2025 (TOX/2025/14) following feedback from the Committee.
5. This statement discusses the risk associated with exposure to T-2 and HT-2 mycotoxins in food, focussing on exposure from consumption of cereal grains and, where data were available, products thereof, i.e. foods prepared from recipes containing cereal grains.
Introduction
In this guide
In this guideType A trichothecenes
6. T-2 and HT-2 are type A trichothecenes which are produced by a variety of Fusarium and other fungal species. Fusarium species grow and invade crops and produce T-2 and HT-2 under cool, moist conditions prior to harvest. They are found predominantly in cereal grains, in particular oat grain, barley grain and wheat grain and products thereof, i.e. foods prepared from recipes containing cereal grains. (JECFA, 2016).
7. The chemical structures of T-2 and HT-2 are shown below in Figure 1.
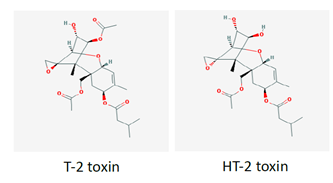
Figure 1 gives the chemical structures of the mycotoxins T-2 and HT-2. Figure 1 is shown in grey, black and red line with red and grey text on a grey background.
Figure 1. Chemical structures of T-2 and HT-2 (PubChem, 2026).
Occurrence data
8. As part of this assessment, occurrence data on T-2 and HT-2 (only) in food were acquired through a nationwide call for evidence (FSA, 2023). This call was issued by the FSA and FSS in July 2023 and officially closed in October 2023. However, the FSA and FSS continued to receive data up until February 2024. The data call included cereal grains, both pre- and post- cleaning/dehulling, and finished products. Where possible, data spanning multiple years were included to reflect any annual variability of T-2 and HT-2 levels. The data received (n >8000) covered the UK harvest seasons from 2004 to 2023. Sampling data for RTE food products were also submitted for 2013 (n=60), 2014 (n=60) and 2024 (n=90).
9. The FSA and FSS received occurrence data on T-2 and HT-2 (only) either as the sum of T-2 and HT-2 or as the individual mycotoxins. The format and level of detail provided by the respondents varied, but the data included occurrence levels in processed and unprocessed cereal grains, cereal products and a small number of RTE foods. The occurrence data submitted to the FSA and FSS were predominantly on unprocessed/raw materials which were yet to undergo any cleaning. Occurrence data on grains submitted by industry as ‘already processed’ refers to grains that have been dehulled and cleaned but remain as a commodity; that is, they have not been incorporated in any RTE foods. Submitted data on RTE foods included biscuits, rusks and cookies, extruded cereal seed or root-based products, cereal bars, infant formula milk-based powder, oat porridge, muesli, mixed breakfast cereals, bread and rolls.
10. The data were collated, cleaned and assured by the FSA. The quality assurance (QA) methodology aligned with the main principles outlined in Treasury Guidance (Aqua Book; UK HM Treasury, 2015) and the guidelines in the Government Data Quality Framework (UK Government Data Quality Hub, 2020) on data quality rules.
11. Prior to the data cleaning, a verification exercise was undertaken by the FSA to account for missing limit of quantification (LOQ) and/or limit of detection (LOD) values and sample type categorisation. For these amendments, assumptions were made based on the descriptors and values included by the submitters, such as the descriptors provided for commodity types based on the sample identification codes. To include data without compromising scientific integrity, data were included when all of the following criteria were satisfied:
- Datapoints with reported LOQ > 0.
- Datapoints where the FoodEx (EFSA, 2025) code could be defined.
- Sample codes referred to products destined for human consumption (not feed).
12. To estimate the median lower bound (LB) sum of T-2 and HT-2, values at or below the LOQ were assumed to be zero. To estimate the median upper bound (UB) occurrence levels, values at or below the LOQ were assumed to be at the LOQ; values above the LOQ were used as reported.
13. For grains, to allow for a direct comparison with the group HBGV (which is for the sum of both mycotoxins), only analytically determined data on the sum of T-2 and HT-2 were considered in the exposure assessment. For RTE foods, due to the limited data available, all reported values were considered, including individual T-2 or HT-2 occurrence data.
Seasonal variability
14. The presence of T-2 and HT-2 in crops is dependent on the weather at key growth stages, such as flowering, and can demonstrate large annual variability. While good agricultural practices are available to manage the occurrence of mycotoxins in general, they have not proven to be effective for T-2 and HT-2, whose occurrence in crops is markedly affected by climate/weather.
15. Currently, liquid chromatography mass spectrometry (LC-MS) and gas chromatography-mass spectrometry (GC-MS) are the primary techniques employed for testing T-2 and HT-2 contamination levels in the laboratory. Commercially available rapid diagnostics kits delivering the simultaneous measurement of T-2 and HT-2 toxins include enzyme-linked immunosorbent assays (ELISAs), lateral flow devices (LFDs)/dipstick assays and fluorescence polarisation immunoassays (FPIAs) (Safefood, 2024). However, recent assessments by industry report large variability between the available methods, and performance characteristics such as LODs and LOQs are often unsatisfactory (Safefood, 2024). This makes it difficult to reliably detect these toxins in samples. In addition, currently available test kits would not automatically be ‘fit for purpose’ (Safefood, 2024) because rapid tests must be accurate, reproducible and provide the required sensitivity for regulatory compliance.
16. The data received from the call for evidence covers the years 2004-2024. This spans a period either side of Commission Recommendation 2013/165/EU on the presence of T-2 and HT-2 toxin in cereals and cereal products. Generally, the highest mean levels of the sum of T-2 and HT-2 received via the data call (i.e. the mean level based on all data points for each respective year) were reported in the years 2008 to 2014, with lower levels being detected thereafter. The year 2014 is still recognised as being associated with a particularly high prevalence of T-2 and HT-2. A study by Xu et al. (2014) showed that accumulation of T-2 and HT-2 mycotoxins in field oat grains in the UK that year was positively correlated with warm and wet conditions during early May and dry conditions thereafter, when toxin levels likely remained high because dry weather reduced their leaching or loss from the plant. This illustrates the importance of reviewing levels across extended periods of time to allow for seasonal variation in the occurrence of T-2 and HT-2.
17. Figures 2a-c show annual occurrence data for the sum of T-2 and HT-2 in three categories of unprocessed cereal grains (oats, barley, and wheat). The values shown are the mean values per year, calculated based on all data points received for the respective year. To provide a representative analysis of current exposure patterns, only the last 10 years of occurrence data were included (2014- 2024); occurrence data from before 2013, the year the initial food safety Recommendation came into force, were excluded.
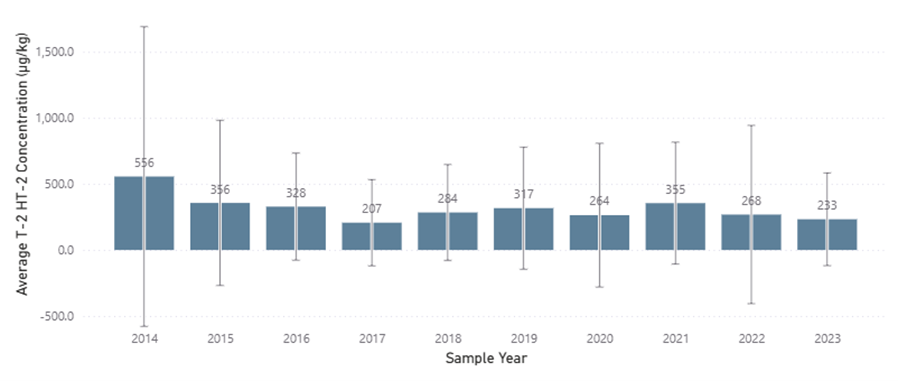
Figure 2a. is a bar chart with error bars showing yearly average concentrations. The bars represent the average T-2/HT-2 concentration for each sample year. The vertical lines extending above and below each bar are the error bars show the standard deviation. The x‑axis lists the years, and the y‑axis shows the concentration values. The bars are shown in a dark blue colour, the axis labelling in gey and black text.
Figure 2a. Mean value of the sum of T-2 and HT-2 per year for unprocessed oat grains. The mean value is based on all data points for the respective year(s), as submitted by industry in response to the call for evidence. The error bars shown in the figure represent the standard deviation. The number of samples per year are as follows: 2014 (n = 440), 2015 (n = 617), 2016 (n = 244), 2017 (n = 397), 2018 (n = 367), 2019 (n = 604), 2020 (n = 727), 2021 (n = 480), 2022 (n = 634), 2023 (n = 195).
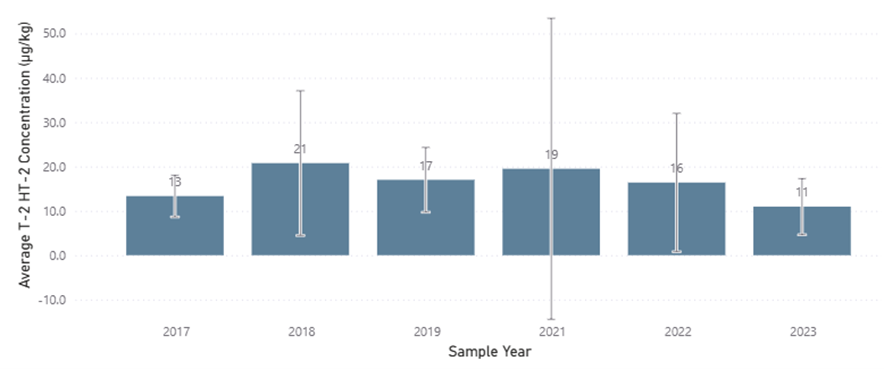
Figure 2b. Mean value of the sum of T-2 and HT-2 per year for unprocessed barley grains. The mean value is based on all data points for the respective year(s), as submitted by industry in response to the call for evidence. The error bars represent the standard deviation. The number of samples per year are as follows: 2017 (n = 6), 2018 (n = 21), 2019 (n = 6), 2021 (n = 123), 2022 (n = 123), 2023 (n = 65). The bars are shown in a dark blue colour, the axis labelling in gey and black text.
Figure 2b. Mean value of the sum of T-2 and HT-2 per year for unprocessed barley grains. The mean value is based on all data points for the respective year(s), as submitted by industry in response to the call for evidence. The error bars represent the standard deviation. The number of samples per year are as follows: 2017 (n = 6), 2018 (n = 21), 2019 (n = 6), 2021 (n = 123), 2022 (n = 123), 2023 (n = 65).
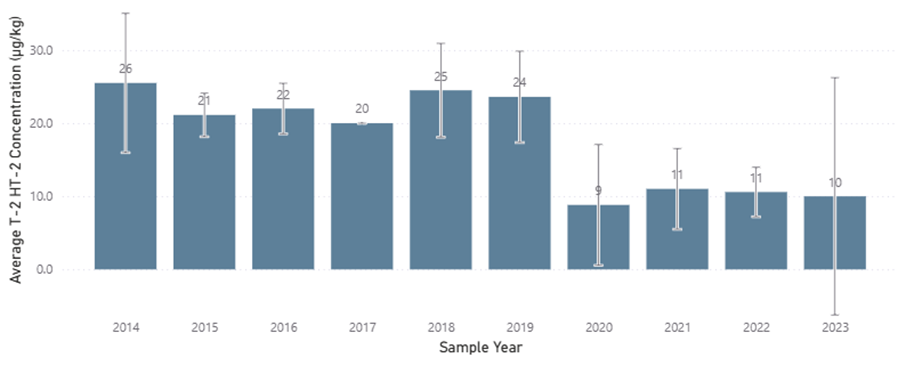
Mean value of the sum of T-2 and HT-2 per year for unprocessed wheat grains. The mean value is based on all data points for the respective year(s), as submitted by industry in response to the call for evidence. The error bars represent the standard deviation. Please note, due to the sample number for 2017 being 1, the standard deviation could not be calculated. The number of samples per year are as follows: 2014 (n = 4), 2015 (n = 8), 2016 (n = 8), 2017 (n = 1), 2018 (n = 6), 2019 (n = 5), 2020 (n = 11), 2021 (n = 168), 2022 (n = 163), 2023 (n = 28). The bars are shown in a dark blue colour, the axis labelling in gey and black text.
Figure 2c. Mean value of the sum of T-2 and HT-2 per year for unprocessed wheat grains. The mean value is based on all data points for the respective year(s), as submitted by industry in response to the call for evidence. The error bars represent the standard deviation. Please note, due to the sample number for 2017 being 1, the standard deviation could not be calculated. The number of samples per year are as follows: 2014 (n = 4), 2015 (n = 8), 2016 (n = 8), 2017 (n = 1), 2018 (n = 6), 2019 (n = 5), 2020 (n = 11), 2021 (n = 168), 2022 (n = 163), 2023 (n = 28).
18. It is important to note that Figures 2a-c are purely a visualisation of how the measured levels of mycotoxins have changed over time. No one factor which was driving the changes observed in the mycotoxin levels across the different years could be identified because of variability in the amount and quality of information provided by industry in response to the call for evidence. The annual variation depicted in Figures 2a-c could be a consequence of factors such as i) climate, i.e. changes in the weather from one year to the next; ii) time from harvest to sampling, and from sampling to measurement of mycotoxin levels; iii) conditions and duration of storage, and iv) changes in sampling practices.
Reduction factors for unprocessed cereal grains
19. Unprocessed oat grains intended for human consumption include an outer hull. This is the part of the grain that is often most contaminated. The outer hull is removed during processing. This so-called ‘de-hulling’ process significantly reduces the level of contamination.
20. A literature search was conducted to identify information on the reduction of T-2 and HT-2 mycotoxin levels in cereal grains during processing. A ‘reduction factor’, when used in exposure calculations, takes into account the expected decrease in T-2 and HT-2 levels in unprocessed cereal grains once they are processed, i.e. cleaned and de-hulled. Applying reduction factors therefore allows more accurate representation of consumer exposure to T-2 and HT-2 and results in a more realistic exposure assessment. Several reduction factors for the sum of T-2 and HT-2 for oat grains were identified in the scientific literature; these ranged from 66 to 100 % (Meyer et al., 2022; Schwake-Anduschus et al., 2010; EFSA, 2011; Pettersson 2008). For this assessment, a reduction factor of 85 % from Meyer et al. (2022) was applied; this means that all T-2 and HT-2 occurrence values for unprocessed oats were reduced by 85 %.
21. The factor of 85 % was chosen because it was the most scientifically robust as well as from the most recently conducted study. Although the reduction factor of 85 % was specifically for large oat kernels, Meyer et al. (2022) noted that “milling oats are traded to contain less than 10 % of thin oats below 2 mm slotted hole sieve” (up to 90 % of the oats may be composed of larger kernels). Therefore, this reduction factor was considered to be relevant to this exposure assessment.
22. Some cultivars of oat and barley are hulless. Polišenská et al. (2020) note that “special attention should be paid to the risk of their contamination by Fusarium mycotoxins, as the rate of mycotoxin reduction during processing could be much lower than that for hulled cereals”. In the UK, however, hulless cultivars of oats are typically used for animal feed and not for human consumption so this risk is not expected to affect consumers directly.
23. No reduction factors were identified for maize or barley. The limited information available suggested that the starting levels and incidence of T-2 and HT-2 in wheat and maize were very low and limited data were available on their fate or how their levels change during manufacturing of RTE food products (Scudamore, 2009). Pascale et al. (2011) calculated an overall reduction of T-2 and HT-2 toxins by 54 % following the processing of durum wheat. However, the samples used in this study were artificially inoculated with Fusarium and the high concentrations of T-2 and HT-2 detected were unlikely to reflect concentrations under natural conditions. Furthermore, the percentage reduction might not be linear and might be less at lower levels of contamination. Given the limited information available it was unclear whether, or to what extent, processing reduces T-2 and HT-2 contamination in wheat, maize or barley under natural conditions; no reduction factor was therefore applied in this assessment.
Toxicity
In this guide
In this guide24. The toxicity of T-2 and HT-2 has been reviewed by EFSA (2011, 2017b), JECFA (2002, 2016, 2022) and the Scientific Committee on Food (SCF) (2002). All Committees agreed that T-2 and HT-2 had both acute and chronic effects.
25. The primary acute effect of T-2 and HT-2 toxicity is emesis. This effect is dependent on the maximum concentration in plasma (Cmax) and has been observed upon single oral and intraperitoneal exposures to T-2 and HT-2 in mink (Wu et al., 2016). The primary chronic effects of T-2 and HT-2 toxicity are haematotoxicity, immunotoxicity and reduced body weight gain. Exposure to T-2 for up to 12 weeks via the diet resulted in reduced total leucocyte counts in male Wistar rats (Rahman et al., 2014), while exposure for three weeks, also via the diet, resulted in reduced body weight gain in juvenile pigs (Rafai et al., 1995a,b). Both acute and chronic effects were dose-dependent and occurred over a similar dose range (1.8 – 3.3 µg/kg bodyweight (bw)). The apparent difference in sensitivity to acute or chronic effects arises from different uncertainty factors (UF) which have been applied when deriving the corresponding HBGVs.
26. T-2 and HT-2 also demonstrated dermal toxicity, developmental and reproductive toxicity, and neurotoxicity; however, these effects occurred at higher doses.
Toxicokinetics
27. The toxicokinetics of T-2 and HT-2 have been reviewed previously by JECFA (2001) and EFSA (2017a). Very little information is available concerning the in vivo absorption of T-2 and HT-2 in animals after oral administration.
28. Pfeiffer et al. (1988) administered single doses of radiolabelled T-2 at two doses (0.15 and 0.60 mg/kg) to male Sprague-Dawley rats via three routes (oral, intravenous, dermal). Urine and faeces were collected over six days. The results demonstrated that excretion was rapid and largely complete within 72 hours for oral and intravenous routes but slower following dermal exposure. Overall, T-2 was predominantly excreted in faeces, the faeces-to-urine ratio for the toxin and its metabolites being approximately 5:1.
29. In mice and rats (strain not specified), orally administered tritium-labelled T-2 was rapidly eliminated via faeces and urine. In mice, the toxin was rapidly distributed to the liver, kidney and other organs, without accumulating in any organ. In rats, T-2 was excreted via faeces partly as HT-2 toxin, NEO and three unidentified metabolites (Matsumoto et al., 1978). When tritiated T-2 was administered directly into the small intestine of male rats, 40 to 57 % of radioactivity was found in bile and blood, suggesting an extensive hydrolysis to HT-2 and other metabolites during the rapid intestinal absorption of T-2 (Coddington et al., 1989).
30. The metabolism of T-2 and HT-2 in humans and other species is complex and was previously reviewed by EFSA (2011). In brief, phase 1 metabolites arise from either hydrolysis of ester groups, hydroxylation, or de-epoxidation. These reactions may also occur in combination. In 2017, EFSA decided to review relevant new data on T-2 and HT-2 and noted that glucuronides are the most prevalent mammalian phase 2 metabolites of T-2 and HT-2 (EFSA, 2017a). In 2022, EFSA reviewed the toxicokinetics and fate of T-2 and HT-2 in ruminants. The Panel noted that “results of in vivo studies with cows point to a rapid absorption, an extensive biotransformation to several less toxic metabolites and a rapid excretion of the parent compound and its metabolites, with negligible tissue accumulation and transfer to milk” (EFSA, 2022). Therefore, accumulation of T-2 and HT-2 in animal tissues and milk is not expected to occur at a significant level.
Health Based Guidance Values (HBGVs)
In this guide
In this guide31. An acute refence dose (ARfD) is the estimated amount of a substance in food or drink that can be ingested in a single meal or day without appreciable health risk to the consumer. The tolerable daily intake (TDI) is the estimated amount of a substance that can be ingested daily over a lifetime without posing a significant health risk.
EFSA’s group acute reference dose (ARfD)
32. In 2017, EFSA established a group ARfD of 0.3 μg/kg bw for T-2, HT-2, and NEO, based on a study examining emesis in mink (Wu et al., 2016). Minks were selected as a suitable model for human vomiting due to their similar response to emetics such as emetine. Wu et al. (2016) monitored emetic responses in fasted female mink following the administration of varying oral and intraperitoneal doses of T-2 and HT-2. The lowest oral dose causing vomiting was 0.05 mg/kg bw (75 % affected), with a no observed adverse effect level (NOAEL) of 5 μg/kg bw, a lowest observed adverse effect level (LOAEL) of 50 μg/kg bw, and an estimated dose causing an effect in 50 % of the population (ED50) of 20 μg/kg bw.
33. EFSA performed benchmark dose (BMD) analysis using PROAST software and selected a lower 95 % confidence limit on the benchmark dose for a 10 % response (BMDL10) of 2.97 μg/kg bw as their point of departure (POD) for setting an ARfD. Applying an uncertainty factor (UF) of 10 for intraspecies variability (but none for interspecies differences due to similar emetic sensitivity between mink and humans), EFSA derived a group ARfD of 0.3 μg/kg bw. NEO was included based on equipotency data in ducklings. EFSA assumed dose additivity between T-2, HT-2, and their modified forms but noted the possibility of antagonistic or, less likely, synergistic effects of their co-occurrence.
34. The COT agreed with EFSA’s ARfD in 2018 but raised concerns about the wide BMD confidence interval, the lack of an interspecies UF for toxicokinetics and the exclusive use of female mink. A later update to the PROAST software generated a higher model-averaged BMDL10 of 12.2 μg/kg bw, but the more conservative EFSA value was retained because of uncertainties around model averaging.
EFSA’s group TDI
35. In 2017, EFSA established a group TDI of 0.02 μg/kg bw for the sum of T-2, HT-2, and NEO toxins. This decision was based on structural similarities between these three mycotoxins, their similar toxicological profiles, and the fact that HT-2 is a direct metabolite of T-2. EFSA applied relative potency factors of 1 for T-2 and HT-2, and 0.3 for NEO, using mainly in vivo data and a conservative rounding approach.
36. The TDI was derived using data from a 90-day rat study in which male Wistar rats received feed containing 0, 0.5, 0.75 and 1 mg T-2 per kg of diet for up to 12 weeks (Rahman et al., 2014). EFSA calculated that this was equivalent to doses of 0, 45, 68 and 90 μg T-2/kg bw/day, respectively. The study reported dose-dependent reductions in white and red blood cells and platelets, along with clinical signs of toxicity. EFSA selected total leucocyte count as the critical endpoint and derived a BMDL10 of 3.3 μg/kg bw/day, applying a total UF of 200 (10 for interspecies and 10 for intraspecies variability, and 2 for subchronic to chronic extrapolation).
37. EFSA had previously proposed a TDI of 100 ng/kg bw/day in 2011 based on a study in which pigs received a diet containing 0.5 - 15.0 mg/kg of purified T-2 toxin for three weeks (Rafai et al., 1995a,b); however, the 12 week rat study of Rahman et al. (2014) was considered more relevant in 2017 due to its longer duration and clearer haematological effects. EFSA also included phase I metabolites in the group TDI, assuming dose addition, and applied relative potency factors accordingly.
38. EFSA noted a number of uncertainties in their assessment, including the use of a subchronic study to set a chronic TDI, the lack of repeated-dose studies on HT-2 and the unspecified purity of the test material.
39. The COT endorsed EFSA’s group TDI in 2018 during its review of infant and young child exposure.
JECFA’s group ARfD
40. In April 2022, JECFA agreed that emesis was a common effect of acute exposure to T-2 and HT-2 in both humans and experimental animals and established a group ARfD for T-2, HT-2 and DAS. The POD selected was the BMDL10 of 2.6 μg/kg bw for emesis in mink following acute gavage exposure to T-2 or HT-2. A UF of 8 (2.5 for interspecies variability in toxicodynamics and 3.16 for intra-human variability in toxicodynamics) was considered sufficiently protective.
41. Based on the above, a group ARfD for T-2, HT-2 and DAS of 320 ng/kg bw (rounded down) was established and, considering the highly comparable nature of the methods used in studies concerning the emetic effects of T-2, HT-2 and DAS in mink, a relative potency factor of 0.2 for acute exposure to DAS was recommended.
JECFA’s group TDI
42. In April 2022, JECFA established a group TDI of 25 ng/kg bw for T-2, HT-2 and DAS, alone or in combination. JECFA concluded that the most sensitive, reliable and reproducible effects observed following repeated dietary exposure were those reported in by Rafai et al. (1995a,b). This study adequately characterised the test material and background exposure to common mycotoxins detected in feed and examined critical toxicological effects at relatively low doses (<25 µg/kg bw/ day). JECFA also noted that juvenile pigs are sensitive to the emetic and haematotoxic effects of trichothecenes. Dose-response analysis of body weights, daily body weight gain and daily feed intake were conducted, and a BMDL10 of 1.8 µg/kg bw/ day based on reduced daily body weight gain was selected as the most appropriate POD for establishing a group TDI. An overall UF of 72 was applied (8 for the group HBGV, 3 for the extrapolation from subacute to chronic exposure, and 3 for other uncertainties in the database) in recognition that the critical effect (i.e. nausea-induced reductions in feed intake resulting in decreased body weight gain) was likely to be dependent on Cmax and acknowledgement of JECFA’s low confidence in the overall toxicological database.
43. Although comparative longer-term data on T-2, HT-2 and DAS were not available, JECFA noted the similar critical effects observed following acute and repeated oral exposures and concluded that the relative potency factor of 0.2 for DAS was applicable for exposure durations longer than acute and should be applied when comparing dietary exposure to DAS with the group TDI.
COT HBGVs
44. In February 2023, the COT reviewed the EFSA and JECFA HBGVs for T-2 and HT-2 mycotoxins, together with the underlying weight of evidence, and was content to continue applying EFSA’s HBGVs for future risk assessments. The values of the group HBGVs are almost identical between JECFA and EFSA, and the COT had previously been applying the HBGVs established by EFSA for risk assessments.
45. An overview of the key information underpinning the EFSA and JECFA HBGVs for T-2 and HT-2, on which the COT based its assessment, is provided in Table 1.
Table 1: Summary of the group HBGVs for T-2 and HT-2 established by EFSA (2017) and JECFA (2022).
|
HBGV |
Value of HBGV |
Value of critical endpoint |
Adverse effect at critical endpoint |
Uncertainty factor |
Key study |
|
EFSA ARfD (T-2, HT-2, NEO) |
0.3 μg/kg bw |
BMDL10 of 2.97 μg/kg bw |
Emesis in mink. |
10 (for intraspecies variability only)a |
Wu et al. (2016)b |
|
EFSA TDI (T-2, HT-2, NEO) |
0.02 μg/kg bw |
BMDL10 of 3.3 μg/kg bw |
Reduced leucocyte count in rats. |
200 (10 for interspecies variability, 10 for intraspecies variability, 2 for extrapolation from subchronic to chronic exposure). |
Rahman et al. (2014)c |
|
JECFA ARfD |
320 ng/kg bw (T-2, HT-2 & DAS) (equivalent to 0.32 μg/kg bw) |
BMDL10 of 2.6 μg/kg bw |
Emesis in mink. |
8 (2.5 for interspecies variability in toxicodynamics and 3.16 for intra-human variability in toxicodynamics). |
Wu et al. (2016)b |
|
JECFA TDI |
25 ng/kg bw (T-2, HT-2 & DAS) |
BMDL10 of 1.8 µg/kg bw |
Reduced body weight gain in pigs. |
72 (8 for the group HBGV, 3 for extrapolation from subacute to chronic exposure, 3 for other uncertainties in databased). |
Rafai et al. (1995a,b)e |
a) No interspecies uncertainty factor was applied because humans were not considered to be more sensitive than mink to acute emetic effects.
b) In the Wu et al. (2016) study, emetic responses were monitored for six hours post-dosing.
c) The duration of the Rahman et al. (2014) study was 12 weeks; 8 rats were sacrificed at each two-week interval.
d) JECFA noted that these uncertainties include i) many of the studies investigated adverse effects at high doses, ii) the actual intake of the test material and the presence of other related mycotoxins in the basal feed was inadequately described, iii) none of the identified studies that reported the effects of low doses (for example, ≤25 µg/kg bw/ day) followed standard testing guidelines according to GLP standards, and iv) JECFA noted some discordance concerning some of the effects at low doses.
e) The duration of the study conducted by Rafai et al. (1995a,b) was three weeks.
Exposure assessment
In this guide
In this guide46. Dietary exposures to T-2 and HT-2 in the population were estimated from consumption of cereal grains in the diet. The occurrence data were predominantly from unprocessed grains; the approach to assessing exposure in foods as actually consumed is described below.
Methodology
47. Exposure assessments were conducted on a survey population basis using food consumption data (mean and 97.5th percentile) and the corresponding LB and UB median occurrence values calculated from data submitted in response to the FSA call for evidence. The concentration range of the reported occurrence levels was very wide, so median occurrence levels were calculated for the sum of T-2 and HT-2 toxins (µg/kg) to avoid skewing the overall exposure. This was applied to “all grains” and exposure scenarios for i) oat grains only, and ii) “all grains” (oats, wheat, and barley).
48. A single food group was created in the National Diet and Nutrition Survey (NDNS) for estimating exposure to the sum of T-2 and HT-2 from consumption of oat grains only. Exposure to the sum of T-2 and HT-2 from this food group was estimated from NDNS consumption data, using occurrence estimates under the following scenarios:
- Unprocessed oat grains,
- Unprocessed oat grains after application of a reduction factor of 85 %,
- Processed oat grains (submitted by industry as ‘already processed'); and,
- “Oats combined” (the amalgamation of the occurrence data described in the second and third bullet points above).
49. Additional food groups were created for estimating exposure to the sum of T-2 and HT-2 from consumption of cereal grains other than oat grains: however, no scientifically robust reduction factors were identified for these cereal grains. Median occurrence values in these food categories were below the LOQ so the application of a reduction factor would not be expected to affect exposure estimates. The following scenarios were applied:
- Unprocessed wheat grains,
- Processed wheat grains,
- Unprocessed barley grains; and,
- Processed barley grains.
50. Acute and chronic exposures for “all grains” were estimated for the sum of T-2 and HT-2 (mean and 97.5th percentile).
51. None of the datasets for RTE foods were sufficient to calculate median exposure, so the exposure assessments were conducted on a consumer basis using mean and maximum occurrence levels. In most cases occurrence data were only available for individual mycotoxins (T-2 or HT-2) but not for their sum. For the majority of RTE foods, therefore, chronic and acute exposures to individual toxins were calculated, the exception being infant cereal, for which usable data were available for the sum of T-2 and HT-2.
52. All exposures were estimated for the following age and population groups; the information was based on data from the Diet and Nutrition Survey of Infants and Young Children (DNSIYC) (DH, 2013) and NDNS (Bates et al., 2014, 2016, 2020; Roberts et al., 2018):
- Infants (4-18 month-olds),
- Toddlers (1.5-3 year-olds),
- Children (4-10 year-olds),
- Older children (11-18 year-olds),
- Adults (19-64 year-olds),
- Older adults (65+ year-olds),
- Adult vegetarians/vegans (19-64 year-olds), and
- Women of childbearing age (16-49 year-olds).
Results
53. Exposures from unprocessed oats only (which constituted the majority of the data received from industry) were very high but were considered unlikely to reflect a real-life scenario. When a reduction factor (85 %) was applied to the values for unprocessed oats the resulting levels were similar to the (very limited) data for processed oats submitted by industry. This supported the use of the selected reduction factor of 85 % to adjust exposures from unprocessed oats; it also supported the use of “oats combined”, processed oats plus unprocessed oats adjusted using the reduction factor, as being the most realistic exposure scenario with the data currently available for oats.
54. No reduction factors for unprocessed wheat or barley could be identified. “All grains” exposure was therefore based on the limited data available from processed wheat and barley, as submitted by industry, as well as “oats combined”. The data showed that overall exposure from “all grains” was driven primarily by exposures from oats.
55. The most important estimated exposures to the sum of T-2 and HT-2 from “oats combined”, all processed cereal grains (“oats combined”, wheat and barley), and RTE foods are summarised in the following paragraphs. Full results of the exposure assessment can be found in Annex A (supplementary information).
56. Exposure estimates for T-2 and HT-2 in cereal grains were based on a commodity approach and calculated using median occurrence data. Due to the limited number of samples, exposure estimates for T-2 and HT-2 in RTE foods were calculated using the mean and maximum occurrence level on a food-by-food basis. All exposure estimates used both the mean and 97.5th percentile consumption rates (across all age and food groups). To avoid double counting, the exposure estimates from grains (commodity approach) were not added to exposure estimates from RTE foods.
Estimated exposures to the sum of T-2 and HT-2 for “oats combined” and all processed grains
Chronic exposure
57. For “oats combined”, i.e. unprocessed oats corrected using a reduction factor of 85 % and processed oats as submitted by industry (Annex A; Table 5):
- The lowest chronic exposures to the sum of T-2 and HT-2 were in older children (11-18 years) with mean and 97.5th percentile exposures of 0.0015-0.0019 µg/kg bw/day (LB-UB) and 0.010-0.013 µg/kg bw (LB-UB), respectively.
- The highest chronic exposures were in infants (4-18 months) with mean and 97.5th percentile exposures of 0.0063-0.0083 µg/kg bw/day (LB-UB) and 0.039-0.051 µg/kg bw/day (LB-UB), respectively. Toddlers (1.5-3 years) had similar exposures to infants.
58. For all processed grains, i.e. “oats combined”, processed wheat and processed barley as submitted by industry (Annex A; Table 5):
- The lowest chronic exposures to the sum of T-2 and HT-2 from all processed cereal grains occurred in older children (11-18 years), with mean and 97.5th percentile exposures of 0.0015-0.0039 µg/kg bw/day and 0.010-0.017 µg/kg bw/day, respectively.
- The highest chronic exposures were in infants (4-18 months) with mean and 97.5th percentile exposures of 0.0063-0.010 µg/kg bw/day and 0.039-0.052 µg/kg bw/day, respectively.
Acute exposure
59. For “oats combined”, i.e. unprocessed oats corrected using a reduction factor of 85 % and processed oats as submitted by industry (Annex A; Table 6):
- The lowest acute exposures to the sum of T-2 and HT-2 were in women of childbearing age (16-49 years) with mean and 97.5th percentile exposures of 0.0033-0.0043 µg/kg bw (LB-UB) and 0.020-0.026 µg/kg bw (LB-UB), respectively.
- The highest acute exposures were in infants (4-18 months) with mean and 97.5th percentile exposures of 0.014-0.018 µg/kg bw (LB-UB) and 0.078-0.10 µg/kg bw (LB-UB), respectively. Toddlers had similar exposures to infants.
60. For all processed grains, i.e. “oats combined”, processed wheat and processed barley as submitted by industry (Annex A; Table 6):
- The lowest acute exposures to the sum of T-2 and HT-2 were in women of childbearing age (16-49 years) with mean and 97.5th percentile exposures of 0.0033-0.0082 µg/kg bw and 0.020-0.034 µg/kg bw, respectively
- The highest acute exposures were in infants (4-18 months) with mean and 97.5th percentile exposures of 0.014-0.021 µg/kg bw and 0.078-0.10 µg/kg bw, respectively.
Estimated exposures from ready to eat foods
61. Limited occurrence data was submitted in response to the call for evidence, so consumer-based exposure estimates from RTE foods were only calculated for specific population groups that may have high relative intakes of oat products, i.e. infants (4-18 months), toddlers (1.5-3 years), adults (19-64 years), and adult vegetarians/vegans (19-64 years).
62. Mean and 97.5th percentile exposures were calculated based on the mean and maximum concentration (mean-max concentration) of T-2 or HT-2 (separately) or the sum of both, where available (Annex A; Tables 11-16). Very few datapoints for either T-2 or HT-2, and even fewer on the sum of T-2 and HT-2, were available for RTE foods. Exposures to T-2 or HT-2 (separately) were therefore included in this assessment in order to extract as much information as possible from the data submitted by industry.
Chronic and acute exposure estimates for the sum of T-2 and HT-2
63. The only RTE food category for which occurrence data for the sum of T-2 and HT-2 were available was infants’ cereals, so the only population groups for which exposure via this food category was considered was infants and toddlers (Annex A; Tables 11-12):
- The highest mean and 97.5th percentile exposures, both for chronic and acute, were in infants (4-18 months).
- In infants, mean and 97.5th percentile chronic exposure estimates were 0.36-0.71 µg/kg bw/day (mean-max concentration), and 1.5-2.9 µg/kg bw/day (mean-max concentration), respectively.
- In toddlers (1.5-3 years), mean and 97.5th percentile chronic exposure estimates ranged from 0.22 µg/kg bw (mean) to 1.4 µg/kg bw/day (97.5th percentile).
- Acute mean and 97.5th percentile exposure estimates in infants were 0.71-1.4 µg/kg bw (mean-max concentration), and 2.6-5.2 µg/kg bw (mean-max concentration), respectively.
- Acute mean and 97.5th percentile exposure estimates in toddlers ranged from 0.52 µg/kg bw to 2.6 µg/kg bw, respectively).
Chronic and acute exposure estimates for T-2 or HT-2
64. Where data on the sum of T-2 and HT-2 in RTE foods were not available, were too limited and/or did not meet the inclusion criteria, data on individually reported levels of T-2 or HT-2 were used to provide exposure estimates.
65. Chronic exposure estimates to T-2 only (Annex A; Table 13):
- The lowest chronic exposure estimates to T-2 from RTE foods were from plain muesli in infants with mean and 97.5th percentile exposures of 0.00030-0.00043 µg/kg bw/day (mean-max concentration), and 0.001-0.0015 µg/kg bw/day (mean-max concentration), respectively.
- The highest chronic exposure estimates to T-2 from RTE foods were from oat porridge in infants with mean and 97.5th percentile exposures of 0.033-0.10 µg/kg bw/day (mean-max concentration), and 0.17-0.51 µg/kg bw/day (mean-max concentration), respectively.
66. Acute exposure estimates to T-2 only (Annex A; Table 14):
- The lowest acute exposure estimates to T-2 from RTE foods were from plain muesli in infants with mean and 97.5th percentile exposures of 0.00073-0.0011 µg/kg bw (mean-max concentration), and 0.0025-0.0036 µg/kg bw (mean-max concentration), respectively.
- The highest acute exposure estimates for T-2 from RTE foods were from oat porridge in toddlers, with mean and 97.5th percentile exposures of 0.11-0.34 µg/kg bw (mean-max concentration), and 0.27-0.85 µg/kg bw (mean-max concentration), respectively.
67. Chronic exposure estimates to HT-2 only (Annex A; Table 15):
- The lowest chronic exposure estimates for HT-2 from RTE foods was from puffs/curls type extruded snack, in adults, with mean and 97.5th percentile exposures of 0.00064-0.00064 µg/kg bw/day (mean-max concentration), and 0.002-0.002 µg/kg bw/day (mean-max concentration), respectively.
- The highest chronic exposure estimates for HT-2 from RTE foods was from infants’ cereals, in infants, with mean and 97.5th percentile exposures of 0.70-0.71 µg/kg bw/day (mean-max concentration), and 2.9-2.9 µg/kg bw/day (mean-max concentration), respectively.
68. Acute exposure estimates to HT-2 only (Annex A; Table 16):
- The lowest acute exposure estimates to HT-2 from RTE foods was from puffs/curls type extruded snack, in adults, with mean and 97.5th percentile exposures of 0.0018-0.0018 µg/kg bw (mean-max concentration), and 0.0050-0.0050 µg/kg bw (mean-max concentration), respectively.
- The highest acute exposure estimates to HT-2 from RTE foods was from infants’ cereals, in infants, with mean and 97.5th percentile exposures of 1.4-1.4 µg/kg bw (mean-max concentration), and 5.2-5.2 µg/kg bw (mean-max concentration), respectively.
Risk characterisation
In this guide
In this guide69. Trichothecenes such as T-2 and HT-2 can cause chronic and acute adverse effects, haematotoxicity and emesis being the critical effects, respectively. After considering the scientific evidence underpinning the EFSA and JECFA assessments, the COT agreed in 2023 to continue applying the HBGVs established by EFSA in any future assessments, a group ARfD of 0.3 μg/kg bw for T-2, HT-2 and NEO and a group TDI of 0.02 μg/kg bw for T-2, HT-2 and NEO.
70. This statement provides an updated risk assessment on T-2 and HT-2 mycotoxins only, including an exposure assessment for UK consumers following the FSA and FSS call for evidence. It should be noted that the data received for processed wheat and barley were limited and exposures are dominated by oat data. Processed oat grains in this assessment were “oats combined”, i.e. unprocessed oat grains to which a reduction factor has been applied plus the limited data on processed oats industry submitted. The reduction factor of 85 % was selected from the literature; while this was supported by the limited data submitted by industry for processed oat grains, it could vary, potentially leading to an underestimation of risk, especially in instances where T-2 and HT-2 occurred in ‘hot spots’. Hot spots refer to specific geographic areas or locations where the levels of T-2 and HT-2 toxins in cereal grains are significantly higher than average.
71. All estimates of mean chronic exposure to the sum of T-2 and HT-2 from “oats combined” (Annex A; Table 9) and all processed grains (Annex A; Table 9) were below the TDI of 0.02 μg/ kg bw/day and were therefore not of toxicological concern. While the majority of 97.5th percentile chronic exposure estimates for “oats combined” and all processed grains were also not of toxicological concern, exposures in infants and toddlers (“oats combined”) and infants, toddlers, adults, and older adults (all processed grains) exceeded the TDI up to 4-fold. A toxicological concern cannot, therefore, be excluded. Exposures in vegetarians/vegans (“oats combined”; all processed grains) and older children (4-10 years; all processed grains) were at or close to the TDI but were unlikely to result in health concerns.
72. Acute exposure estimates for “oats combined” and for all processed grains were below the ARfD across all population groups assessed, both at mean and high consumption, and are therefore not of toxicological concern (Annex A; table 10).
73. Results on grains from this assessment were in line with the COT’s assessment on the risk of T-2 and HT-2 in the infant diet (COT, 2018). Based on a 2015 mycotoxin survey of oat-based products (FSA, 2015), acute exposures were all below the EFSA group ARfD and therefore not of toxicological concern, while for 97.5th percentile chronic exposures, the EFSA group TDI was exceeded in infants and young children aged 4-60 months. Hence, the COT concluded in 2018 that an effect on infant and toddler health could not be entirely excluded.
74. Chronic exposures from RTE foods (Annex A; Tables 13-15) suggest a potential concern for consumer health, especially in infants and toddlers, and for some foods in adults and vegetarians/vegans, mainly oat porridge. Estimated chronic exposures to the sum of T-2 and HT-2, which was only available for ‘infant cereals’, exceeded the TDI 11-fold (toddlers) and 145-fold (infants) (Annex A; Table 11). Chronic estimated exposures for T-2 only were at the TDI in toddlers for high intakes (97.5th percentile) for wheat bread rolls, while mixed breakfast cereals resulted in exceedances up to 3-fold the TDI. Estimated exposures from oat porridge exceeded the TDI in all age groups and exposure scenarios, ranging from 2- to 8-fold in adults and vegetarians/vegans, and 2-fold to 26-fold in infants and toddlers, respectively. Chronic exposure estimates to HT-2 only exceeded the TDI in most RTE foods for infants and toddlers with exceedances ranging from 3- to 70-fold, respectively, and plain muesli and oat porridge in adults and vegetarians/vegans (exceedance 2- to 22-fold, respectively).
75. When considering the exceedances from RTE foods and the potential concerns for human health it is important to note that the submitted data on RTE foods was very limited; on average, sample numbers were <5, and even in the case of oat porridge the number of samples analysed was <25. Furthermore, exposure estimates were calculated either on the sum of T-2 and HT-2 or in most instances on individual mycotoxins only. Hence, while the estimated exposures calculated from RTE foods may be an indication of potential foods of concern, they are subject to a high degree of uncertainty. In addition, the large exceedances of the TDI that have been derived from RTE foods (22-, 26-, and 70-fold) were based on the maximum occurrence when the 97.5th percentile consumption rate was applied (Annex A; Tables 13 and 15). It is unlikely that high consuming individuals would be exposed to foods at the highest occurrence levels continuously throughout their life, given the known seasonal variability of T-2 and HT-2 occurrence levels and differences in consumption between life stages and across the year. The mean occurrence level combined with the mean consumption rate may therefore provide a more appropriate indication of realistic chronic exposure; exposures estimated in this manner were much lower, indicating a lower risk.
76. Acute exposures to the sum of T-2 and HT-2 from RTE foods (‘infant cereals’) exceeded the ARfD 2-fold to 17-fold in infants and 2-fold to 9-fold in toddlers (Annex A; Table 12). Acute exposures to T-2 (only) from RTE foods were all below the ARfD, except for oat porridge in infants and toddlers with exceedances of up to 3-fold of the ARfD (Annex A; Table 14). For HT-2 (only), in infants and toddlers, exposures exceeded the ARfD by 2-fold to 7-fold from oat porridge, and by 3-fold to 17-fold from infants’ cereals (Annex A; Table 16). Exceedances at this level in infants and toddlers might be of concern due to their lower bodyweight and consequent susceptibility to lower absolute exposures. The sample number for oat porridge was, however, small (<25) and the levels reported may not be representative, especially given that no information was provided regarding sampling strategies; it is unclear whether random samples were analysed or whether sampling had occurred after a known incident or suspected contamination.
77. For HT-2 (only), high level (97.5th percentile) adult consumers had exposures equal to the ARfD, whilst exposures in vegetarians/vegans exceeded the ARfD 3-fold from oat porridge. While exceedances of the ARfD for adults, especially vegetarians/vegans, were of potential toxicological concern, it is unlikely that this level of exceedance would result in a significant concern for health.
78. Exposure estimates from grains and RTE foods indicated that RTE foods result in higher exposures to T-2 and HT-2 compared to either processed or unprocessed oats. However, exposures to processed grains were calculated on a commodity basis by using the median across the occurrence data, while exposures to RTE foods, due to the limited number of samples, were calculated on a food-by-food basis using mean and maximum occurrence levels. RTE foods provided a very limited snapshot of exposures to final food products and direct comparison to exposures from grains was therefore not possible. The analytical method used may further add to uncertainty in estimating exposures from RTE foods. Use of the LOQ as the occurrence level to estimate exposures where a low level/non-detect was determined to be below the LOQ will, especially where methods are relatively insensitive and have high LOQs, result in relatively high “occurrence levels”. Using the mean and maximum for individual mycotoxins, rather than the sum of T-2 and HT-2, added further uncertainties.
79. Year-to-year variability in the occurrence of T-2 and HT-2 in cereal grains (Figures 2a-c) can lead to occasional high acute exposures, particularly during “bad years” or in localised hot spots. In contrast, chronic exposures to the sum of T-2 and HT-2 from grains were calculated on a commodity basis. Consumption was modelled based on all foods containing the grains and occurrence was calculated at the LB and UB median. These, therefore, were the most representative estimates of chronic exposure.
Uncertainties and assumptions
In this guide
In this guide80. The risk assessment for T-2 and HT-2 in food involved various assumptions and was subject to a number of uncertainties. These relate to the preparation of the occurrence data, the calculation of the consumption data, the exposure estimates and the risk assessment itself.
81. Uncertainties associated with the preparation of the occurrence data:
- When a LOD was not reported these data were included, if all other acceptance criteria were met.
- When a result value was not reported it was assumed to be equal to the LOQ (where LOQ > 0).
- When a sample code description was not reported, the code was researched and the description filled in. Any changes to the codes over the years that the data covered would not be captured.
- Food codes were grouped in food groups for the purpose of the assessment on the basis of the FoodEx descriptions of the codes. When in doubt, assumptions were made as to which group the codes fitted best.
- In the UK and Ireland, it is common for grain to be delivered to the mill ‘as harvested’ i.e. uncleaned and unprocessed with the husk still intact. Where mycotoxin contamination was associated with the outer layers of the grain this may exhibit higher levels of contamination. A large proportion of data submitted as part of the data call were from such unprocessed grains which therefore may exhibit higher levels of contamination compared to cleaned, processed grains. Thus, a reduction factor of 85 % was applied to the sum of T-2 and HT-2 in unprocessed oat grains. It was assumed that this constituted a realistic reduction, although different reduction factors have been reported in the literature, potentially over- or underestimating the reduction and subsequent exposure.
- No reduction factor was applied to unprocessed wheat and barley grains. The COT did not identify a scientifically robust reduction factor, however the occurrence data here for both unprocessed and processed forms also fell below the LOQ. Hence the application of a reduction factor would not be expected to affect exposure estimates.
- It is unknown when each sample was analysed relative to the time of harvest. Storage time of the samples before mycotoxin levels were measured and recorded may have varied.
82. Uncertainties associated with calculation of the consumption and exposure estimates:
- The description of food categories within the FoodEx food code system were not always aligned with the names given to similar foods in NDNS and DNSIYC. Some assumptions were therefore made during the mapping of these foods to identify the closest match when searching the inhouse FSA recipes database for the most relevant food.
- For the RTE food groups, in some cases, there are a limited number of consumers (<60) as well as a limited number of samples. This may lead to unreliable exposure estimates. Consumer numbers less than 60 (<60) should be treated with caution as they may not be a true representation of the entire population.
- For RTE foods, samples on the sum of T-2 and HT-2 were only available for infant foods, for all other food samples either T-2 (only) or HT-2 (only) were available.
- For RTE food groups, there was uncertainty on whether concentrations were provided on a wet weight or dry weight basis, hence conversion factors were not applied while building the food groups. These included foods such as dried infant cereals and other dried food groups.
- NDNS does not include pregnant or lactating women. Data for women of childbearing age (16-49 years) were used as a proxy and may not be representative of the maternal diet.
- The summation of exposures from individual grains, especially for acute exposures, was likely to overestimate actual exposure, particularly at the 97.5th percentile. It was unlikely an individual would eat all grain foods at that level in a single day.
83. Uncertainties associated with the risk assessment:
- The exposure assessment only included T-2 and HT-2 mycotoxins, however the group TDI and group ARfD established by EFSA also includes NEO. Uncertainty regarding the occurrence of NEO in cereal grains, as well as its exclusion from the exposure assessment, might lead to an underestimation of total exposure and thus a possible underestimation of the corresponding health risk. Co-occurrence may lead to additive or synergistic effects, though the underlying mechanisms of interactions between individual mycotoxins in different combination(s) are yet to be fully elucidated and understood. Previous work undertaken by the FSA included a statement on the potential risk(s) of combined exposure to mycotoxins (COT, 2021) which assessed various mycotoxins including NEO, nivalenol (NIV), deoxynivalenol (DON), and DAS.
- Estimated exposures to T-2 and HT-2 were based on grains or products thereof only. Other potential sources of T-2 and HT-2, such as POAO were not considered, resulting in a potential underestimation of the full dietary exposure.
- For RTE foods T-2 only or HT-2 only were compared to a HBGV based on the sum of both mycotoxins.
- T-2 and HT-2 occurrence in cereal grains is significantly influenced by climate and levels can vary significantly from year to year (Figure 2a-c). Year to year variability may mean that individuals could be exposed to high levels of T-2 and HT-2 in one year compared to other years. Annual exposures have not been considered in this assessment.
Conclusions
In this guide
In this guide84. The COT was asked by the FSA and FSS to assess the risk to UK consumers from dietary exposure to T-2 and HT-2 mycotoxins following the introduction of EU MLs and the collection of new UK occurrence data for cereal grains and a limited number of ready to eat (RTE) foods.
85. Acute exposures to T-2 and HT-2 from processed cereal grains were below the group ARfD across all population groups and were therefore not a toxicological concern. Chronic exposures at mean consumption levels were also below the TDI and therefore not of toxicological concern. However, at high (97.5th percentile) consumption levels, chronic exposures in infants, toddlers, adults, and older adults exceeded the TDI by up to 4-fold, and a potential health concern cannot be fully excluded, especially for young age groups. These findings are broadly consistent with a previous COT assessment in infant and toddlers based on the FSA’s 2015 mycotoxin survey.
86. For RTE foods, estimated exposures were considerably higher than for grains and frequently exceeded the TDI and, in infants and toddlers, the ARfD. This suggested potential health risks in these age groups, particularly for chronic high consumers. However, the available dataset is very limited and may not reflect general population exposure. These results indicate the need to maintain a watching brief regarding foods of possible concern.
87. The Committee recommended that more extensive and representative occurrence data be collected, particularly for the sum of T-2 and HT-2 in RTE foods, to enable a more robust and reliable risk assessment. Testing throughout the cereal supply chain, from raw materials to finished products, would also help improve future assessments.
Statement COT/2026/02
Abbreviations
In this guide
In this guide|
Abbreviation |
Full Term |
|
ARfD |
Acute reference dose |
|
BMD / BMDL10 |
Benchmark dose / Benchmark dose lower confidence limit for 10% response |
|
Cmax |
Maximum plasma concentration |
|
COT |
Committee on the Toxicity of Chemicals in Food, Consumer Products and the Environment |
|
DAS |
4,15-diacetoxyscirpenol |
|
DNSIYC |
Diet and Nutrition Survey of Infants and Young Children |
|
EC |
European Commission |
|
EFSA |
European Food Safety Authority |
|
ELISA |
Enzyme-linked immunosorbent assay |
|
EU |
European Union |
|
FPIA |
Fluorescence polarisation immunoassay |
|
FSA |
Food Standards Agency |
|
FSS |
Food Standards Scotland |
|
GC-MS |
Gas chromatography-mass spectrometry |
|
GLP |
Good Laboratory Practice |
|
HBGV |
Health-based guidance value |
|
HT-2 |
HT-2 toxin |
|
JECFA |
Joint FAO/WHO Expert Committee on Food Additives |
|
LB / UB |
Lower bound / Upper bound |
|
LC-MS |
Liquid chromatography-mass spectrometry |
|
LFDs |
Lateral flow devices |
|
LOD / LOQ |
Limit of detection / Limit of quantification |
|
LOAEL / NOAEL |
Lowest observed adverse effect level / No observed adverse effect level |
|
MLs |
Maximum levels |
|
NDNS |
National Diet and Nutrition Survey |
|
NEO |
Neosolaniol |
|
P97.5 |
97.5th percentile |
|
POD |
Point of departure |
|
POAO |
Products of animal origin |
|
QA |
Quality assurance |
|
RPC |
Raw primary commodity |
|
RTE |
Ready to eat |
|
T-2 |
T-2 toxin |
|
TDI |
Tolerable daily intake |
|
UF |
Uncertainty factor |
References
In this guide
In this guideBates B.D., Collins K., Jones P., et al. (2020) National Diet and Nutrition Survey Results from years 9, 10 and 11 (combined) of the Rolling Programme (2016/2017 to 2018/2019). Survey, London: Public Health England. NDNS: results from years 9 to 11 (2016 to 2017 and 2018 to 2019) - GOV.UK.
Bates B., Lennox A., Prentice A., et al. (2014) National Diet and Nutrition Survey: Results from Years 1, 2, 3 and 4 (combined) of the Rolling Programme (2008/2009 – 2011/2012). London: Public Health England. Main heading.
Bates B., Cox L., Page S., et al. (2016) National Diet and Nutrition Survey Results from Years 5 and 6 (combined) of the Rolling Programme (2012/2013 – 2013/2014). London: Public Health England. Main heading.
Coddington K.A., Swanson S.P., Hassan A.S., et al. (1989). Enterohepatic circulation of T-2 toxin metabolites in the rat. Drug Metabolism and Disposition 17: 600-605. DOI:https://doi.org/10.1016/S0090-9556(25)08826-9
COT (2018) Statement of T-2 toxin (T-2), HT-2 toxin (HT-2) and neosolaniol (NEO) in the diet of infants aged 0 to 12 months and children aged 1 to 5 years. cotstatement-T-2HT-2andneosolaniol.pdf.
COT (2021) Statement on the potential risk(s) of combined exposure to mycotoxins. Combined exposure to mycotoxins report.
Department of Health (2013) “Diet and Nutrition Survey of Infants and Young Children, 2011.” Diet and nutrition survey of infants and young children, 2011 - GOV.UK.
EFSA (2011) Scientific Opinion on the risks for animal and public health related to the presence of T-2 and HT-2 toxin in food and feed. EFSA Journal 9(12): 2481 Scientific Opinion on the risks for animal and public health related to the presence of T‐2 and HT‐2 toxin in food and feed. DOI: https://doi.org/10.2903/j.efsa.2011.2481
EFSA (2017a) Appropriateness to set a group health based guidance value for T2 and HT2 toxin and its modified forms. EFSA Journal 51(1): 4655. DOI: https://doi.org/10.2903/j.efsa.2017.4655
EFSA (2017b) Human and animal dietary exposure to T-2 and HT-2 toxin. EFSA Journal 15(8):4972. DOI: https://doi.org/10.2903/j.efsa.2017.4972
EFSA (2022) Assessment of information as regards the toxicity of T-2 and HT-2 toxin for ruminants. EFSA Journal 20(9): 7564. DOI: https://doi.org/10.2903/j.efsa.2022.7564
EFSA (2025) Food classification standardisation – The FoodEx2 system. Food classification standardisation – The FoodEx2 system | EFSA.
JECFA (2001) WHO Food Additive Series: 47. Safety evaluation of certain mycotoxins in food. T-2 AND HT-2 TOXINS (JECFA 47, 2001).
FSA (2015). Retail survey of T-2 and HT-2 toxin levels in oat based products. Executive Summary: fs102126execsum.pdf.
FSA (2023) Call for data: T-2 and HT-2 toxins in food Call for data: T-2 and HT-2 toxins in food | Food Standards Agency.
JECFA (2022) Summary of Conclusions of 93rd meeting of JECFA. 93rd Joint FAO/WHO Expert Committee on Food Additives (JECFA) - Food additives. Summary and conclusions. 2022.
Matsumoto H., Ito T. & Ueno Y, (1978) Toxicological approaches to the metabolites of Fusaria. 12. Fate and distribution of T-2 toxin in mice. Japanese Journal of Experimental Medicine 48: 393-399.
Meyer J.C., Birr T., Hennies I., et al. (2022) Reduction of deoxynivalenol, T-2 and HT-2 toxins and associated Fusarium species during commercial and laboratory de-hulling of milling oats.” Food Additives & Contaminants: Part A 39(6): 1163–1183. DOI: https://doi.org/10.1080/19440049.2022.2059576
Nathanail A.V., Varga E., Meng-Reiterer J., et al. (2015) Metabolism of the Fusarium Mycotoxins T-2 Toxin and HT-2 Toxin in Wheat. J. Agric. Food Chem. 63: 7862–7872. DOI: https://doi.org/10.1021/acs.jafc.5b02697
Pascale M., Haidukowski M., Lattanzio V., et al. (2011) Distribution of T-2 and HT-2 Toxins in Milling Fractions of Durum Wheat. Journal of Food Protection 74(10): 1700-1707. DOI: https://doi.org/10.4315/0362-028X.JFP-11-149
Percie du Sert N., Holmes A.M., Wallis R., et al. (2012) Predicting the emetic liability of novel chemical entities: a comparative study. British Journal of Pharmacology 165: 1848-1867. DOI: https://doi.org/10.1111/j.1476-5381.2011.01669.x
Pettersson H. (2008) T-2 and HT-2 toxins in oats and oat products. 5th EC Fusarium-Toxin Forum, Brussels, 10-11 January 2008.
Pfeiffer R.L, Swanson S.P. & Buck W.B. (1988) Metabolism of T-2 toxin in rats – effects of dose, route, and time. Journal of Agricultural and Food Chemistry 36: 1227-123. DOI: https://doi.org/10.1021/jf00084a025
Polišenská I., Jirsa O., Vaculová K., et al. (2020) Fusarium Mycotoxins in Two Hulless Oat and Barley Cultivars Used for Food Purposes. Foods 9(8): 1037. DOI: https://doi.org/10.3390/foods9081037
PubChem (2026) PubChem database. National Institutes of Health (NIH) | (.gov).
Rafai P., Bata A., Vanyi A., et al. (1995a) Effect of various levels of T-2 toxin on the clinical status, performance and metabolism of growing pigs. Vet. Rec. 136: 485-489. DOI: https://doi.org/10.1136/vr.136.19.485
Rafai P., Tuboly S., Bata A., et al. (1995b) Effect of various levels of T-2 toxin in the immune system of growing pigs. Vet. Rec. 136: 511-514. DOI: https://doi.org/10.1136/vr.136.20.511
Rahman S., Sharma A.K., Singh N.D., et al. (2014) Clinico-haematological changes in T-2 toxicosis in Wistar rats. Indian Journal of Veterinary Pathology. 38: 22-28. DOI: https://doi.org/10.5958/0973-970X.2014.01129.8
Roberts C., Steer T., Maplethorpe N., et al. (2018) National Diet and Nutrition Survey Results from Years 7 and 8 (combined) of the Rolling Programme (2014/2015 to 2015/2016). Survey, London: Public Health England. National Diet and Nutrition Survey.
Safefood (2024) Mycotoxin control in cereals: safeguarding food. Technical Project Report. Mycotoxin control in cereals: safeguarding human food.
Schwake-Anduschus C., Langenkämper G., Unbehend G., et al. (2010) Occurrence of Fusarium T-2 and HT-2 toxins in oats from cultivar studies in Germany and degradation of the toxins during grain cleaning treatment and food processing. Food Additives and Contaminants. Part A, Chemistry, Analysis, Control, Exposure & Risk Assessment 27: 1253-1260. DOI: https://doi.org/10.1080/19440049.2010.487499
SCF (2002) Opinion of the Scientific Committee on Food on Fusarium toxins. Part 6: Group evaluation of T-2 toxin, HT-2 toxin, nivalenol and deoxynivalenol. Opinion of the Scientific Committee on Food on Fusarium toxins. Part 6: Group evaluation of T-2 toxin, HT-2 toxin, Nivaleno...
UK Government Data Quality Hub (2020) “The Government Data Quality Framework.” The Government Data Quality Framework - GOV.UK.
UK HM Treasury (2015) “The Aqua Book: guidance on producing quality analysis for government.” The Aqua Book.
Xu, X., Madden, L. V., and Edwards, S. G. 2014. Modeling the effects of environmental conditions on HT2 and T2 toxin accumulation in field oat grains. Phytopathology 104: 57-66. DOI: https://doi.org/10.1094/phyto-03-13-0070-r
Wu W., Zhou H., Bursian S.J., et al. (2016) Emetic responses to T-2 toxin, HT-2 toxin and emetine correspond to plasma elevations of peptide YY3-36 and 5-hydroxytryptamine. Archives of Toxicology. 90: 997-1007. DOI: https://doi.org/10.1007/s00204-015-1508-7