Microplastics - Inhalation route - Exposure
In this guide
In this guide66. Microplastics are present in the indoor and outdoor environment. Sources of MPs include textiles, furniture, toys, electric cables and cleaning agents, construction material and litter (e.g. discarded packaging and containers).
67. The data available on outdoor exposure is limited. However, studies have shown than when comparing inhalation and ingestion routes indoors, microplastic exposure via ingestion is minimal in comparison to that by inhalation.
Outdoor exposure from air
68. Microplastics found outdoors are more likely to fracture due to weathering in comparison to the microplastics present indoors. However, data on the levels and types of microplastics in the air compared to other media are limited (Ageel et al., 2021).
69. Environmental exposure to airborne microplastics occurs from a wide range of sources with synthetic textiles and the erosion of synthetic rubber tyres being the most frequently reported in the literature. Resuspended city dust which contains a fraction of settled synthetic fibres/rubber tyre wear is a secondary source of airborne microplastics. Wind transfer is estimated to be responsible for 7% of the ocean’s contamination (Boucher & Friot, 2017).
70. The fate and dispersion of microplastics in outdoor environments are dependent on several factors. These include the vertical concentration gradient where there are higher concentrations near the ground due to deposition and settling, wind speed and direction, land topography, precipitation, and temperature. Concentrations of airborne microplastics in outdoor air are expected to be low, due to dilution. O’Brien et al. (2023) noted in their review that the concentration of microplastics in outdoor ambient air ranges between <1 and >1000 MPPs/m3, while the outdoor deposition concentrations ranged between 0.5 and 1357 MPPs/m2/day.
71. There is limited information regarding the concentrations of airborne microplastics, however, the Dris et al. (2016, 2017) studies carried out in Greater Paris found average outdoor deposition rates of 53 and 110 particles/m2/day. Data for Central London on outdoor deposition rates of microplastics have also been reported, and these range from 575-1,008 total MPPs/m2/day; 510-925 fibres/m2/day (Wright et al., 2020). These numbers are affected by climate conditions and seasonality and are also affected by the sampling and analytical methodologies used.
72. An American study (Cox et al., 2019) has proposed an estimated daily consumption and inhalation of 142 MPPs and 170 MPPs in adult males, respectively. For adult females, the estimated values are 126 MPPs and 132 MPPs, respectively for the same exposure routes. Based on these values, a total annual estimated exposure of ~120,00 and ~98,000 MPPs was calculated for male and female adults, respectively. These exposure estimates were based on reported microplastic concentrations in salt, alcohol (beer), seafood (fish, shellfish and crustaceans), added sugars (sugar and honey), water (bottled and tap), and in air. Note that the estimated annual exposure values did not take into account atmospheric deposition of microplastics during food preparation and consumption. The authors are of the view that “these estimates are subject to large amounts of variation; however, given methodological and data limitations, these values are likely underestimates.”
73. As noted previously, inhalation of microplastics can result in toxicity due either to the physical effects of the particles or the chemical effects of their leachates. Amato-Lourenço et al. (2020) concluded that the response in humans depends on differences in individual metabolism and susceptibility. It is not yet known how the toxicity of synthetic fibres compares with that of organic/natural fibres (Donaldson & Tran, 2002). However, it is known that fibres from synthetic textiles are quite flexible (Bunsell (ed), 2018) and hence do not possess the characteristic rigid, long, thin morphology of asbestos fibres, which is responsible for their toxicity and carcinogenicity.
74. In general, the mechanisms of inhaled particle injury include dust overload where high surface area particles induce high chemotactic gradients that prevent macrophage migration, oxidative stress (production of reactive oxygen species, which induces cell injury and release of inflammatory mediators), cytotoxicity (where free intracellular particles damage cellular structures), and translocation (injury of secondary sites and vascular occlusion by particles or increased coagulability). Depending on the nature of the particle and the extent of exposure, such mechanisms might lead to adverse endpoints such as fibrosis, which can develop as a result of chronic cytotoxicity and inflammation.
Indoor exposure
75. The indoor behaviour of airborne microplastics is dependent on factors including room partition, ventilation and airflow.
76. Dris et al., (2017) investigated indoor (two apartments and one office) air samples in the city centre of Paris. Indoor concentrations of microplastics ranged between 1.0 and 60 fibres/m3. The fibres that were measured indoors consisted of 67% of natural materials, primarily made of cellulosic materials and the remaining 33% contained petrochemicals, predominantly polypropylene.
77. Zhang et al., (2020) collated data from 46 studies and calculated the annual intake of indoor and outdoor microplastics using an inhalation rate of 14.3 m3 per day as 1.9 x 10³-1.0 x 10⁵ and 101-3.0 x 10⁷ particles respectively, with approximate means of 3 x 10⁴ for indoor exposure and 4 x 10³ for outdoor exposure, confirming that there is increased exposure to microplastics in the indoor environment. Whereas Fang et al., (2022), calculated the annual atmospheric deposition of MPPs as 3.5 x 10⁵ – 2.2 x 10⁷ items (Figure 4).
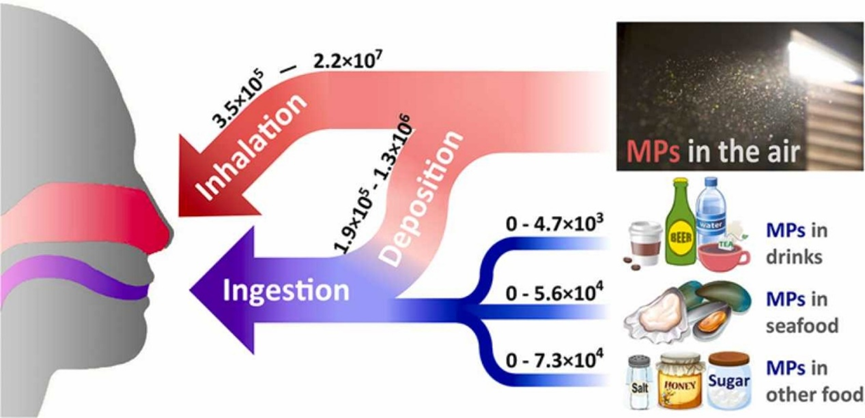
The diagram shows the estimated amount of microplastics inhaled from the air ranging from 3.5 x 10^5 to 2.2 x 10^7 particles. It shows that ingestion of microplastics is minimal in comparison to the inhalation route.
Figure 4. Diagram of microplastics (MPs) via the inhalation and ingestion routes of exposure showing that ingestion of microplastics (items/year) is minimal in comparison to the inhalation route, whereas microplastics that have deposited on food and then ingested was of a similar magnitude to the microplastics via the inhalation route (Taken from Fang et al., 2022).
78. A recent study conducted in Hull, UK sampled 20 households each month for a 6 month period for atmospheric fallout, detecting an average of 1414 MPPs/m2 per day with particles in the size range of 2-250 µm contributing 90% of the particles found. Polyethylene terephthalate (PET), polyamide (PA) and polypropylene (PP) were the most abundant materials in the samples collected (Jenner et al., 2021).
79. Microplastics have been identified in all areas of the lung from tissue samples obtained following surgical resection for cancer or lung reduction surgery. Data was not normally distributed (p = 0.013) and a Kruskal-Wallis test showed that the number of MMPs in the lower region was significantly higher than the middle/lingular (p = 0.038) and the upper region (p = 0.026). Within the upper region (n = 6, total mass = 33.66 g), 11 MMPs were identified; PE (polyethylene) (18%), PP (18%), PES (polyester) (9%), PS (polystyrene) (9%), resin (9%), SEBS (styrene-ethylene-butylene co-polymer) (9%), TPE (thermoplastic elastomer) (9%). Within the middle/lingular region (n = 3, total tissue mass = 12.19 g), 7 MMPs were identified; PET (29%), resin (29%), PE (14%), PMMA (polymethylmethacrylate) (14%), PUR (polyurethane) (14%). Within the lower region (n = 4, total tissue mass = 9.56 g), 21 MMPs were identified; PP (33%), PTFE (polytetrafluoroethylene) (19%), PET (14%), Resin (14%), PS (10%), PAN (polyacrylonitrile) (5%), PE (5%) (Jenner et al. 2022) (see Figure 5).
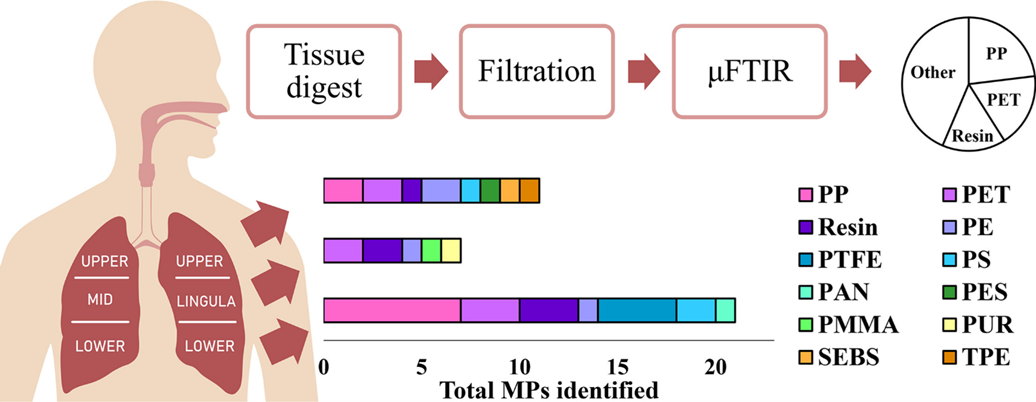
The diagram shows the range of different polymers discovered in the lungs and the area of the lung. Polypropylene (PP) is found in the highest amount in the lower and upper lung.
Figure 5. Diagram showing the difference polymer types discovered in the lung and the area of the lung Particle number (total MPs detected with no account taken for MPs found in controls) and polymer type of MPs identified within human lung tissue samples, assigned to their lung region (Figure image taken from Jenner et al., 2022).
80. The concentration of microplastics in indoor air is dependent on what occurs in the environment, for example, whether it is a home or occupational setting (discussed below in paragraphs 87-88).
Occupational exposure
81. Occupational exposure was not included in this statement as it was previously discussed in TOX/2019/62.