Microplastics - Inhalation route - Analytical detection methodologies
In this guide
In this guide32. From the literature, the detection methods described for microplastics include one or more of the following steps: sample collection and removal of biogenic matter, detection and quantification/enumeration and, the characterisation of the plastic (i.e. its chemical composition or polymer type) (Nguyen et al., 2019; Kwon, et al., 2020). It is important to note that during all these steps, precautions to avoid contamination from particles in the air, or with fibres from clothing, equipment or the reagents used, should be optimised (see Figure 1).
33. As seen in Figure 1, the majority of biological samples have been taken from aquatic species. The pre-separation method is dissection which recovers MPPs >500 µm, followed by separation methods including density separation, digestion using enzymes and various chemical compounds and filtration techniques. The analytical method is split between three categories: visual microscopic analysis, vibration spectroscopy (e.g. Fourier-transform infrared spectroscopy (FTIR) and Raman spectroscopy) and mass spectroscopy, the last of which is also suitable for the characterisation, quantification and identification of nanoplastics.
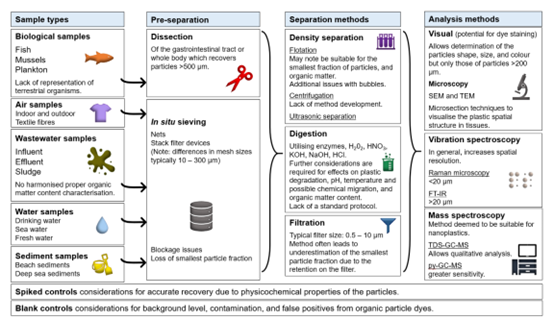
Diagram 1 provides an overview of the methods used in the separation and analysis of micro and Nano plastics in complex environmental samples. This includes biological samples, air samples, wastewater samples, water samples and sediment samples. The diagram is made up of black text and multicoloured images. The image is made up of 4 columns with directional flow lines and arrows. Underneath the columns are rectangle boxes with explanatory text of the Spike controls and Blank control's.
Figure 1. Provides an overview of the methodologies utilised in the separation and analysis of microplastics and nanoplastics in complex environmental samples including: biological samples (fish, mussels and plankton), air samples (indoor and outdoor, synthetic textile fibres), wastewater samples (influent, effluent and sludge), water samples (drinking water, sea water and fresh water) and sediment samples (adapted from Nguyen et al., 2019). Abbreviations: H2O2 = hydrogen peroxide; HNO3 = nitric acid; KOH = potassium hydroxide; HCl = hydrochloric acid; SEM = Scanning electron microscope; TEM = Transmission electron microscopy; FT-IR = Fourier-transform infrared; TDS-GC-MS = Thermodesorption gas chromatography-mass spectrometry; py-GC-MS = Pyrolysis gas chromatography-mass spectrometry (Image taken from COT Microplastics Overarching Statement 2021).
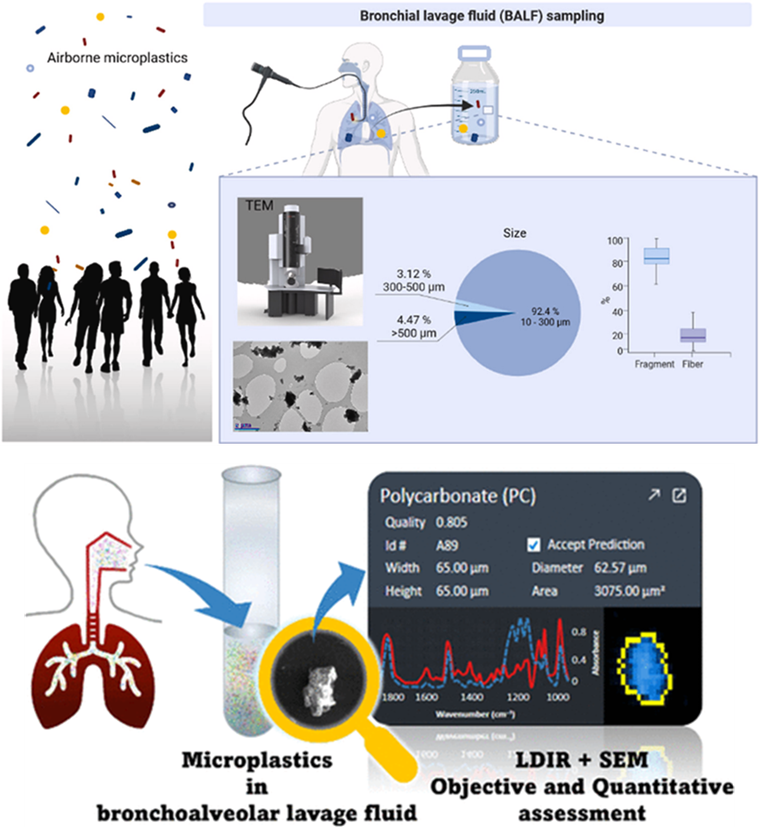
Diagrams taken from two studies observing microplastics in Bronchial Lavage Fluid samples. This image is made up of 2 pictures surrounded by a black outline. At the top on the left is a graphic of people in black silhouette with coloured shapes above them with a line of text which reads "Airborne microplastics". To the right of this is a a heading in black text "Bronchial lavage fluid (BALF) sampling". Under the text is a line drawing of a person and their airways and lungs shaded blue, with a curved black arrow pointing from their lung to a bottle shaded in blue. Underneath this is a grey dotted line forming a triangle above a rectangular box. The box has 2 images, a pie chart and a graph in it. The box is shaded in a pale blue. At the bottom of the rectangle on the left is a line drawing of a persons head, airways and lungs. The Lungs are coloured in red with white lines connecting the 2 parts. From the airways point a blue arrow to a flask. next to he flask is a magnifying glass depicted in yellow and black above a white particle. From the magnifier a blue curved arrow points upwards to a black box with lines of text in grey and small multicoloured images of a heart rate. At the bottom of the whole image are line of bold black text: "Microplastics in bronchoalveolar lavage fluid" and "LDR + SEM Objective and Quantitative assessment".
Figure 2. Diagrams taken from two studies observing microplastics in Bronchial Lavage Fluid samples (Qui et al, 2023; Uoginte et al. 2023).
34. Studies have now reported on human samples obtained during bronchoscopy procedures, whereby bronchoalveolar lavage fluid (BALF) was obtained. A measured fluid, such as saline solution was passed into the lung and then aspirated. These samples were then analysed using optical and TEM-EDX microscopy or SEM microscopy as shown in Figure 2 (Qiu et al, 2023; Uoginte et al. 2023). Other studies have detected microplastics in human lung samples using µFT-IR (Jenner et al. 2021).
35. Currently there are only limited analytical methods available to detect and quantify the presence microplastics in various matrices. These include FT-IR, Nile Red staining techniques, Micro-Raman spectroscopy, quantitative 1H nuclear magnetic resonance spectroscopy (qNMR) (Peez et al., 2019) and mass-spectroscopy; however, each of these methods has its own associated limitations (Nguyen et al., 2019).
36. Additionally, there are neither standardised testing protocols for different matrices (i.e. air, soil, food and water), nor standard refence materials for the analysis, characterization and quantification of micro and nanoplastics. No single technique is suitable for all plastic types or for all particle sizes or shapes. Therefore, the use of either a suite of methods or generation of new techniques will be necessary.
37. Comparison and replication of studies can be difficult due to differences in sampling, extraction, purification and analytical methods for enumerating and characterising microplastics. These methods are not yet standardized and have not been subject to interlaboratory validation. Contamination with airborne microplastics or cross contamination of samples can also occur, so suitable control samples may be difficult to obtain.
38. Most studies have performed tests on pristine particles; however, this may not be representative of what is present in the environment (i.e. the particles have not been subject to environmental degradation and other changes). Therefore, it is important to consider the variability among samples when comparing studies of the same polymer type.
Physicochemical properties
39. There are four morphological and chemical characteristics of microplastics, i.e. physicochemical properties, which influence their potential hazards. These are:
i). Physical (e.g. bulk, fibres in the lung or those which could lead to gut blockage, as observed in aquatic and avian species);
ii). Chemical composition (unbound monomers, additives, sorbed chemicals from the environment e.g. persistent organic pollutants and metals);
iii). Metabolism or degradation to form monomers or other derivatives, some of which could be chemically reactive (e.g. isocyanates from polyurethane) and;
iv). The presence of biofilms (attachment and colonisation of microorganisms on the plastics).
40. Due to the small size of some nano-/microplastics (NMPs) (0.1 µm to 5 mm), uptake across the gastrointestinal tract (GIT) and uptake into internal tissues is possible and thus they may have both local and systemic effects. Particles <50 μm in size can be absorbed from the gut via intracellular gaps and by phagocytic and endocytic pathways but only those of <1-2 μm in size are able to cross the cell membranes of internal organs.
Physical properties
41. NMPs can differ in their physicochemical properties (shape, size, density, surface charge, etc). The consideration of physical properties during hazard and/or risk assessment of plastic particles is important because the interactions of NMPs with biological systems can vary with differences in their size and shape (Nel et al., 2009), even when they have the same chemical composition.
42. The physical properties and morphologies of tyre materials can also vary under different sampling conditions. Those collected from road runoff and shredded tyres have elongated shapes, whilst samples generated from road simulator systems in laboratories range between jagged, droplets, granules, warped, porous, irregular, and near spherical in shape (Wagner et al., 2018). A review by Kole et al., (2017) revealed that the size distribution range of tyre wear and tear particles, could be from 6-350,000 nm. This wide size distribution range was attributed to several factors including the use of difference size metrics (e.g. particle mass versus particle numbers), analytical difficulties in separating tyre from road particles, and the large variation in experimental conditions and analytical equipment.
Chemical Properties
43. A particle’s chemical properties such as charge or zeta potential (when particles are immersed in a conducting liquid such as water) are dependent on its chemical composition.
44. A particle’s properties can also be influenced and changed by its surface chemistry. Each particle could have its own unique corona consisting of proteins adsorbed from plasma and/or intracellular fluid, adsorbed chemicals from the environment or microbiological organisms (see Figure 3).
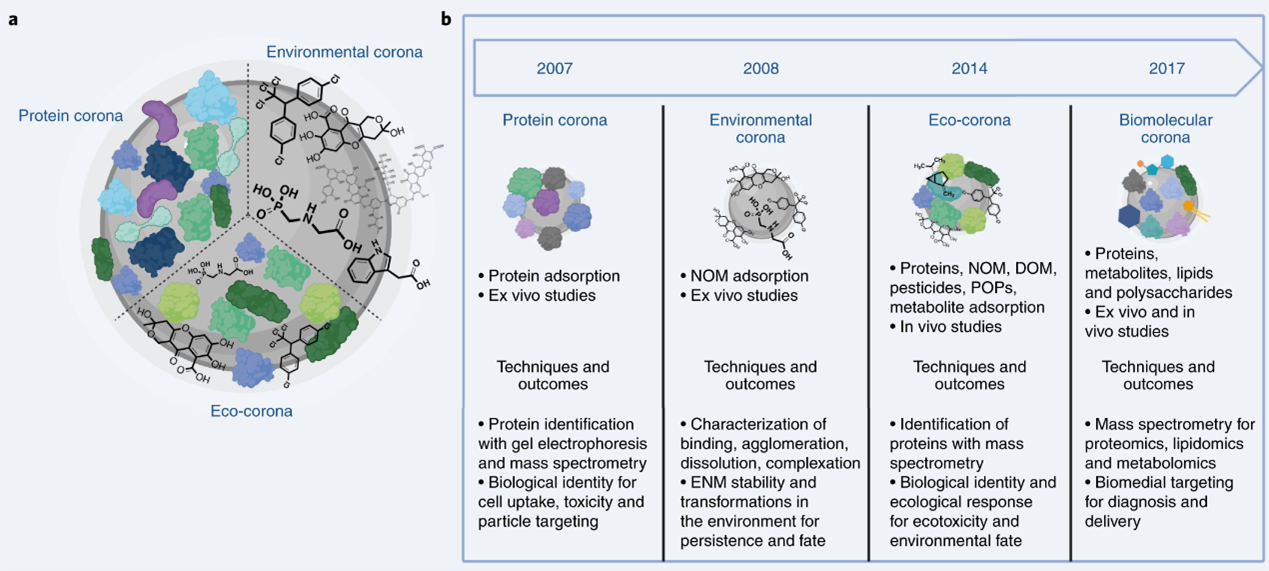
Figure 3 shows the different corona development across the decade from 2007-2017. The figure is a grey box with 2 sections. On the left hand side there is a large multicoloured image of a corona divided in to 3 parts: Protein corona, Eco-corona and Environmental corona. To the right is a timeline arrow of years 2007, 2008, 2014, and 2017. Underneath each year is a heading in blue text with a multicoloured corona and bullet points of black text underneath each year.
Figure 3. (a) Comparison of the protein, environmental, and eco-coronas. Formed within organisms at locations of high protein content, the term protein corona has been used to describe the binding of proteins to ENM (engineered nanomaterials) surfaces, but also incorporates lipids, metabolites (typically <1000 Da which are either reactants, intermediaries or products of enzymatic processes), and other biomolecules. To date, the term environmental corona has described a corona formed in aquatic environments with high concentrations of NOM, including humic substances. By contrast, the eco-corona incorporates features of both the protein and environmental coronas, where the balance of proteins and other molecules varies. (b) The evolution of the protein corona concept, adapted from Hadjidemetriou and Kostarelos. Studies of protein adsorption to surfaces and particles dates back to at least the 1960s. The term protein corona was first coined in 2007. Protein corona studies developed with mass spectroscopy-based proteomics to aid identification of the proteins bound at the surface of ENMs and explore the role of surface curvature in altering protein structure and function relative to macroscale surfaces. Protein corona studies evolved in parallel with those on the environmental corona, but the characterization techniques and goals for each area remained separate, with environmental corona focusing mainly on the dispersion stabilization provided by NOM (natural organic material). The environmental dimensions of the protein corona began to appear later, as the concept of the eco-corona and its role in (nano)ecotoxicity emerged. Both the eco-corona and biomolecular corona embrace the diversity of molecules in solution with the goal of understanding and controlling downstream biological responses to nano-enabled technologies. (Image obtained from Wheeler et al. 2021).
45. The physicochemical properties of micro and nanoplastics can change over their life cycle and can also affect each other. For example, physical degradation resulting in the formation of nano-sized plastic particles and/or plastic particles with different shapes can generate a higher number of particles and thus gives rise to a larger total surface area and higher particle number which in turn affects the concentration. The weathering process can change the surface chemistry and size of microplastics, and chemical migration from the MPPs into the surrounding medium results in altered stability which in turn changes the physical degradation processes (Wheeler et al. 2021).