Scoping paper on the potential risks of chemicals (other than caffeine) found in green and black tea in the maternal diet
Background
In this guide
In this guideThis is a paper for discussion. It does not reflect the views of the Committee and should not be cited.
1. The Scientific Advisory Committee on Nutrition (SACN) last considered the maternal diet and nutrition in relation to offspring health in its reports on ‘The influence of maternal, foetal and child nutrition on the development of chronic disease in later life’ (SACN, 2011) and on ‘Feeding in the first year of life’ (SACN, 2018). In the latter report, the impact of breastfeeding on maternal health was also considered.
2. In 2019, SACN agreed to conduct a risk assessment on nutrition and maternal health, focusing on maternal outcomes during pregnancy, childbirth and up to 24 months after delivery. SACN agreed that, where appropriate, other expert Committees would be consulted and asked to complete relevant risk assessments. A provisional list of chemicals was proposed by SACN Members. However, this was subject to change following discussion by the Committee on the Toxicity of Chemicals in Food, Consumer Products and the Environment (COT). A scoping paper (TOX/2020/32) was presented to the COT in July 2020 to define the scope of the work from a toxicological safety perspective and also requested their input on the selection of candidate chemicals or chemical classes that could be added or removed.
3. This list was brought back to the COT meeting in September 2020 (TOX/2020/45). It was agreed that papers on a number of components should be prioritised, including a scoping paper on the potential toxic effects of chemicals (other than caffeine) found in green and black tea in the maternal diet.
4. The COT previously published statements on the reproductive effects of caffeine in 2001 (COT, 2001) and in 2008 (COT, 2008a) and will revisit the potential adverse effects of caffeine as part of the wider SACN work on nutrition and maternal health. As such, caffeine has not been included in the scope of chemical compounds reviewed in this paper. Statements on the potential health effects of raspberry leaf tea in the maternal diet (COT, 2024a) and the hepatotoxicity of green tea catechins (COT, 2024b) have been published in 2024. The COT are also preparing a statement on the potential health effects of Echinacea in the maternal diet (TOX/2025/45). Peppermint, camomile and dandelion teas are on the list for potential consideration.
5. The aim of this scoping paper is to provide an overview of chemical compounds which may be present in tea and have the potential to result in a health risk for woman of childbearing age. Please note, two types of tea have been considered in this scoping paper, green and black tea. While other tea is consumed in the United Kingdom (UK), these are the most common teas, and for the purpose of this scoping paper, it can be assumed that any compounds present in these two types of tea, would also be present in other types.
Introduction
In this guide
In this guideThis is a paper for discussion. It does not reflect the views of the Committee and should not be cited.
6. Green and black tea are produced from the plant Camellia sinensis (C. sinensis). The difference between the two types of tea depends on several factors, for example, how they are processed after harvesting (e.g. the level of oxidation the leaves are exposed to) and the different varieties that they are produced from.
7. It should be noted that only the liquid product made from steeping dried parts of the C. sinensis plant (e.g. flowers, leaves, roots) has been considered here. Considerations for ‘tea extracts’, which are often used in dietary supplements and other types of teas (e.g., fruit, herbal, white) were not included.
8. The National Health Service (NHS) England website provides guidance on foods and drinks to avoid or limit in pregnancy because of microbiological, toxicological or teratogenic hazards (NHS, 2023). This includes advice on the amount of regular (black) and herbal teas that may be consumed. However, these recommendations are based on limiting the amount of caffeine per day (200 mg per day). The Association of UK Dietitians also recommends limiting the amount of caffeine at 200 mg, which equates to 3 cups of tea a day. Outside of the UK, the US National Centre for Complementary and Integrative Health (NCCIH) states that, “During pregnancy, caffeine intake should not exceed moderate levels. Green tea is a source of caffeine.” (NCCIH, 2025). To our knowledge, neither the NHS nor NCCIH provided commentary or advice on any other compounds that may be present in tea.
UK Import data on tea
9. To gain a better understanding of the UK imported tea market, trade information was collected from the UK HM Revenue and Customs (HMRC). The database only provided import data for green and black tea.
10. In 2024, the UK imported ~110,240 and 3,460 tonnes of black and green tea, respectively. The top ten countries for tea imports based on the total monetary values (£) for EU and non-EU countries are shown in Figures 1 and 2, respectively. The top EU and non-EU countries based on the total value of imports to the UK were Germany and Kenya. The majority of imports were of black tea (HMRC, 2024).
11. At present, tea from China has import restrictions under the High-Risk Food and Feed of Non-Animal Origin (HRFNAO). This means that all tea imports from China must comply with pesticide residue limits under Commission Implementing Regulation (EU) 2019/1793 for residues of tolfenpyrad and, pesticides listed within Article 29(2) of Regulation (EC) No 396/2005.
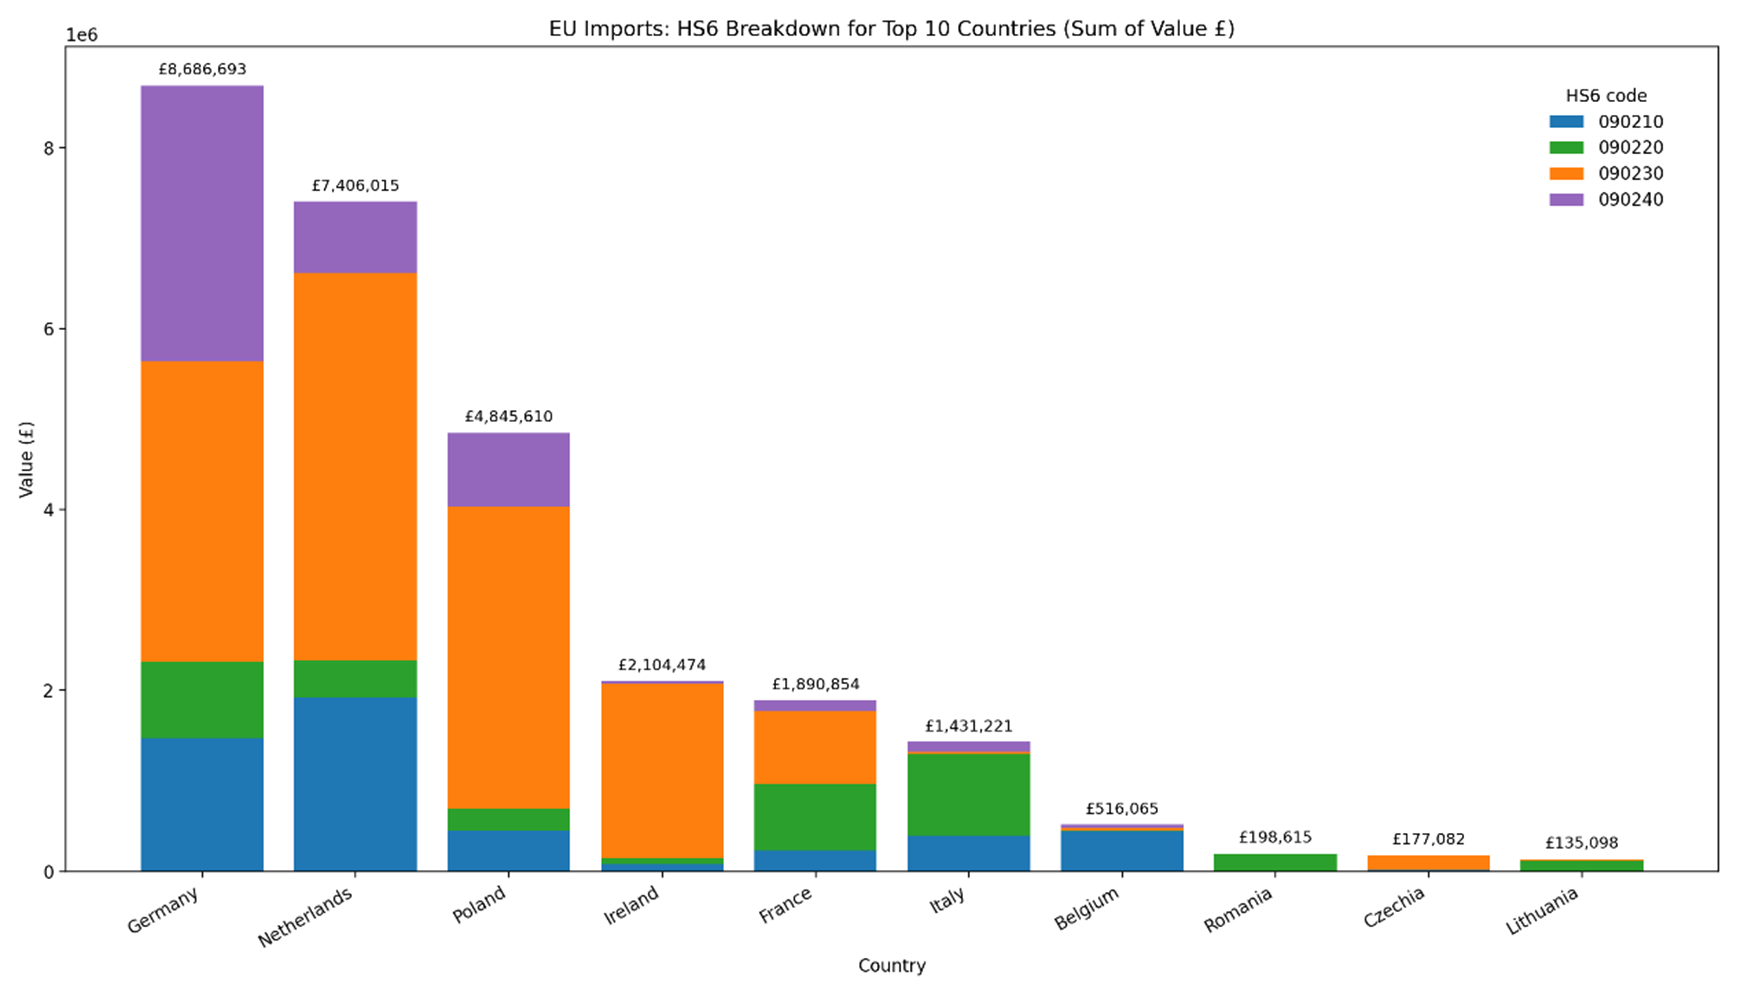
Figure 1 – Top 10 EU countries based on the sum value of imports into the UK. The total value is based on four HS6 commodity categories: 090210 - Green tea in immediate packings of <= 3 kg; 090220 - Green tea in immediate packings of > 3 kg; 090230 - Black fermented tea and partly fermented tea, whether or not flavoured, in immediate packings of <= 3 kg and; 090240 Black fermented tea and partly fermented tea, whether or not flavoured, in immediate packings of > 3 kg. This figure was generated using Microsoft 365 Copilot.
Figure 1 – Top 10 EU countries based on the sum value of imports into the UK. The total value is based on four HS6 commodity categories: 090210 - Green tea in immediate packings of <= 3 kg; 090220 - Green tea in immediate packings of > 3 kg; 090230 - Black fermented tea and partly fermented tea, whether or not flavoured, in immediate packings of <= 3 kg and; 090240 Black fermented tea and partly fermented tea, whether or not flavoured, in immediate packings of > 3 kg. This figure was generated using Microsoft 365 Copilot.
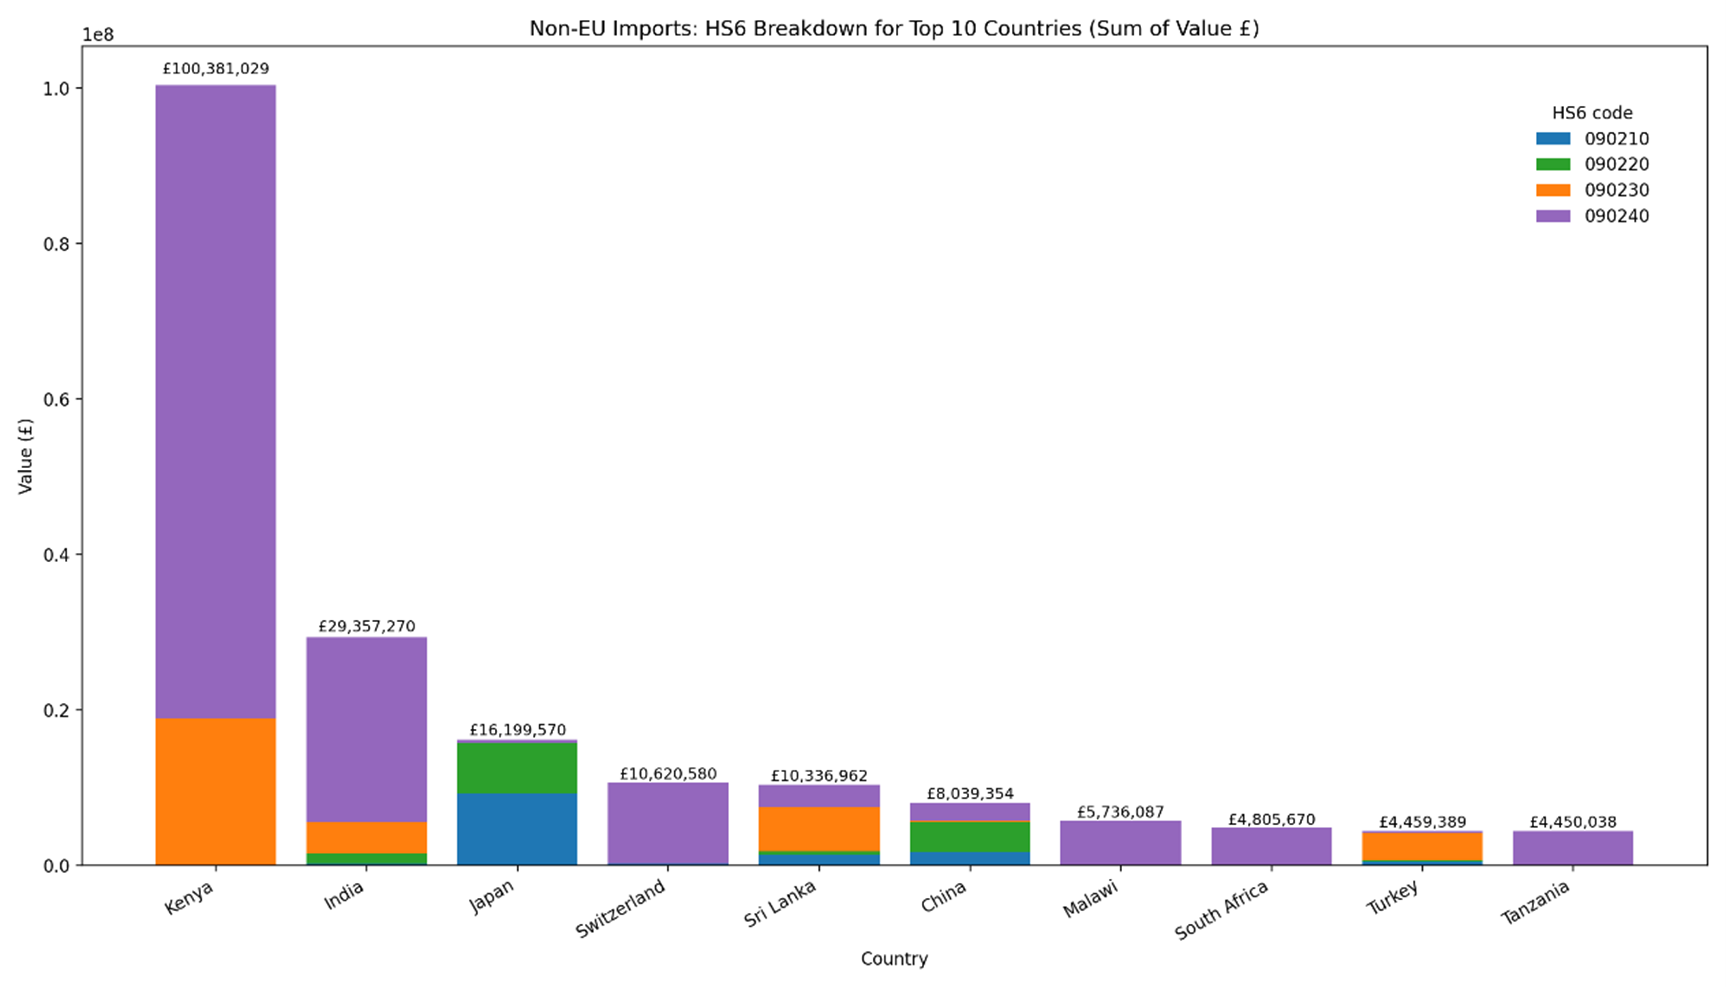
Figure 2 – Top 10 Non-EU countries based on the sum value of imports into the UK. The total value is based on four HS6 commodity categories: 090210 - Green tea in immediate packings of <= 3 kg; 090220 - Green tea in immediate packings of > 3 kg; 090230 - Black fermented tea and partly fermented tea, whether or not flavoured, in immediate packings of <= 3 kg and; 090240 Black fermented tea and partly fermented tea, whether or not flavoured, in immediate packings of > 3 kg. This figure was generated using Microsoft 35 Copilot.
Figure 2 – Top 10 Non-EU countries based on the sum value of imports into the UK. The total value is based on four HS6 commodity categories: 090210 - Green tea in immediate packings of <= 3 kg; 090220 - Green tea in immediate packings of > 3 kg; 090230 - Black fermented tea and partly fermented tea, whether or not flavoured, in immediate packings of <= 3 kg and; 090240 Black fermented tea and partly fermented tea, whether or not flavoured, in immediate packings of > 3 kg. This figure was generated using Microsoft 35 Copilot.
Chemical compounds in tea
In this guide
In this guideThis is a paper for discussion. It does not reflect the views of the Committee and should not be cited.
12. A literature search was carried out to gather information/data on compounds that are present in the that may present a health risk to women of childbearing age. The search terms are described in Annex A. The databases used were PubMed, Science Direct and Google Scholar. Any available relevant reports published by authoritative bodies such as the European Safety Authority (EFSA), World Health Organization (WHO), Food and Agriculture Organisation (FAO), the Joint FAO/WHO Expert on Committee on Food Additives (JECFA), United States of America Food and Drug Administration (US FDA) have also been included.
13. The respective compounds are presented in this scoping paper in compound groups and within their grouping in alphabetical order. In brief, the groups cover chemicals used in crop management (pesticides), naturally occurring toxins (pyrrolizidine alkaloids, tropane alkaloids, mycotoxins), heavy metals (arsenic, cadmium, chromium, lead, mercury), plant components (catechins, polyphenols, trace elements) and process contaminants (acrylamide and furans, polyaromatic hydrocarbons).
Crop management
14. To increase tea crop yields, growers utilise synthetic agrochemical compounds to prevent, kill or repel pests or lessen the damage of animals, insects, nematodes, acarus (mites), fungi, viruses, bacteria, and plant competition. Data from the literature suggests that insecticides and herbicides are the main pesticides in tea (Fernandes et al., 2023).
15. Several studies have investigated the transfer rates of pesticide residues to tea infusions. The majority of which report that adverse health effects are dependent on whether maximum residue levels (MRLs) are exceeded (Fan et al., 2025a; Dong et al., 2023; Fernandes et al., 2023; Heshmati et al., 2020; Chen et al., 2014).
Pesticides
16. In GB, MRLs for pesticides including those applicable to green and black tea are set under Assimilated Regulation (EC) 396/2005. If a pesticide active substance is not listed with a specific MRL, the default MRL of 0.01 mg/kg applies.
17. The official data source for tea residue results is found in the Pesticide Residues in Food (PRiF) dataset (DEFRA, 2025). The most recent entry for tea was found in 2015 (PRiF, 2016b) and the report states that tea was last surveyed in 2012 as part of a herbal infusions and tea survey. The 2015 survey was limited to “true tea (infusions of Camellia sinensis of any type, such as black tea, green tea, white tea, and Earl Grey), and rooibos or red bush tea (infusions of Aspalathus linearis). The teas can be in teabags, loose or instant.” In both the 2012 and 2015 reports, it was noted that the country of origin does not necessarily indicate where the tea was grown. It may be where it was dried or packed for consumer purchase.
18. Tea was sampled in every quarter of 2015 and reported in quarter two (PRiF, 2016a) and four (PRiF, 2016b). The samples were tested for up to 250 pesticide residues. The results showed that 35 samples contained no residues from those sought and six samples contained residues above the reporting level. None of the samples contained residues above the MRL. One sample contained two residues. The main conclusion by the Expert Committee on PRiF was that “none of the residues detected by the laboratory would be expected to have an effect on health.”
19. Colapinto et al., (2015) determined whether tea intake in the first trimester was associated with elevated concentrations of various organochlorine or organophosphate pesticides in maternal blood or urine. They further examined the relationship between tea consumption and adverse birth outcome. Data from the Canadian Maternal-Infant Research on Environmental Chemicals (MIREC) Study cohort were used for these analyses (n=1,898 women). The geometric means (GM) of organochlorine pesticide constituents or metabolites in maternal plasma (lipid adjusted) and organophosphate pesticide metabolites (adjusted for specific gravity) in maternal urine were calculated for participants who drank regular (black), green or herbal tea in the first trimester and for those who did not. The following GM of organochlorine pesticide constituents were detected: trans-nonachlor (2.74 mg/g lipid), metabolites oxychlordane (1.94 ng/g lipid) and p,p′-DDE (55.8 ng/g lipid). The organophosphate pesticide metabolite concentrations adjusted for specific gravity, were dimethylphosphate (GM: 3.19 µg/L), dimethylthiophosphate (GM: 3.29 µg/L), dimethyldithiophosphate (GM: 0.48 µg/L), diethlphosphate (GM: 2.46), and diethylthiophosphate (GM: 0.67 µg/L).
20. The authors observed that there was no significant difference in mean concentrations between tea drinkers (of any type) and non-tea drinkers. No association was found between tea intake in the first trimester and adverse birth outcomes.
Nicotine
21. Nicotine is the main alkaloid in tobacco; it is also found in low concentrations in other crops belonging to the family of Solanaceae. Due to its action as an agonist for acetylcholine receptors, nicotine exhibits insecticidal activities, and the compound was used as an active substance in plant protection products in the past. In the UK, the current MRL for nicotine in tea is 0.5 mg/kg (though this is subject to be reduced to 0.4 mg/kg in February 2026).
22. A temporary European Union (EU) MRL for nicotine in tea is established under Regulation (EC) No. 396/2005 at 0.6 mg/kg. This was used in the EFSA assessment (described in the next paragraph). However, it should be noted that this was reduced to 0.5 mg/kg in line with EU Commission Regulation (EU) 2023/377. This may be further reduced to 0.4 mg/kg which is scheduled for February 2026.
23. In 2022, EFSA published a statement on the short-term (acute) dietary risk assessment for the temporary maximum residue levels for nicotine in rose hips, teas and capers (EFSA, 2022a). The PRIMo (rev 3.1) model was used to calculate acute exposure calculations for unprocessed tea leaves and tea infusions. Specific discussion/exposure for maternal women was not included in the review as the exposures were based on the general population.
24. The highest consumption data expressed as dried tea leaves have been reported for adults and children. For adults, this was German women (aged 14-50 years) (P97.5): 33.74 g/person, equivalent to 0.5 g/kg bw. For children, this was Irish children (P97.5): 30.6 g/person, equivalent to 1.53 g/kg bw. EFSA considered that a large portion of tea leaves contained residues equal to the legal EU MRL limit (0.6 mg/kg), with estimated exposure amounts of 0.3 μg/kg body weight (38% of the acute reference dose; ARfD) for adults and 0.92 μg/kg body weight (115% of the ARfD) for children. The outputs from these exposure calculations gave an indication that the existing temporary MRL for tea was not sufficiently protective for children. The threshold residue concentration for nicotine in teas (dry leaves) that leads to an exposure that does not exceed the ARfD was calculated to be 0.52 mg/kg.
25. The highest consumption expressed on the basis of tea infusion (processed tea leaves) have been reported for adults and children. For adults, this was the Dutch general population (P97.5): 1335.3 g/person, equivalent to 20.29 g/kg body weight. For children, this was Dutch children (P97.5): 645.7 g/person, equivalent to 35.09 g/kg body weight. EFSA utilised a default dilution factor of 0.01 for tea, the residue concentration in tea infusion (corresponding to the existing EU MRL of 0.6 mg/kg) is estimated up to 0.006 mg/kg. For tea infusions the calculated exposure amounted to 0.12 μg/kg body weight for adults and 0.21 μg/kg body weight for children. This exposure corresponds to 15% and 26% of the ARfD for adults and children, respectively.
26. It should be noted that the COT reviewed literature on possible effects of exposure to nicotine on developmental outcomes in humans, from exposure via the parents prior to or during pregnancy or lactation (TOX/2018/45) as part of their work on determining the potential toxicological risks from electronic nicotine (and non-nicotine) delivery systems (e-cigarettes). However, since this considers a different exposure route (i.e. inhalation) rather than exposure via the diet from tea, the data may be of limited relevance.
Metals
In this guide
In this guideThis is a paper for discussion. It does not reflect the views of the Committee and should not be cited.
Heavy metals
27. Heavy metals are persistent organic pollutants that can bioaccumulate in animals and plants. For tea plants, metal content is attributed to two main routes: a) the tea processing procedure (possible contamination from processing equipment, packaging or storage materials), and b) to the acidic soils in which they are grown in. Other sources such as rainfall, atmospheric dust, pesticides and biocides, fertilisers can also contribute to the metal contamination in tea. Although some heavy metals, such as manganese, copper, zinc, and iron, play an essential role in metabolism, others, such as mercury, cadmium, lead, and arsenic, are non-essential and can cause adverse health effects, even in trace quantities (Fan et al., 2025b).
28. Shah et al., (2022) analysed the adverse effects of heavy metals in tea on pregnant mothers (n=400; n=200 non-tea drinkers and n=200 tea drinkers) and foetal outcomes. Maternal blood was analysed for the concentration of aluminium, copper, lead, cadmium, mercury and zinc, as well as iron, total iron binding capacity and ferritin. A “structured questionnaire” was used to collect data from pregnant women in personal interviews at hospital. The frequency of tea of cups (150 mL) drank by mothers in the tea drinker group was: one = 20/200, two = 41/200, three = 69/200, four = 18/200, five = 52/200.The authors observed gestational hypertension, maternal iron deficiency and maternal gestational weight gain in the tea drinking group. Higher plasma concentrations of aluminium, copper, lead, cadmium, and mercury in pregnant tea drinkers than the pregnant non-tea drinkers were also observed. The authors noted a limitation as they were unable to measure the amount of caffeine that tea drinkers consume and thus limits the connection between caffeine and preterm deliveries.
29. Colapinto et al., (2016) examined the association between tea intake during pregnancy and maternal and infant metal exposures. Data from the MIREC Study cohort were used for these analyses. Participants with a gestational age of ⩾20 weeks (n=1954) with available biomarker data for metal exposure were included. Intake of regular (black), green and herbal tea was evaluated in the first and third trimesters via a questionnaire. Women reported their frequency of consumption for each type of tea in terms of number of 6-ounce (~180 mL) cups per day, week or month.
30. Metal concentrations of lead, cadmium, arsenic, total mercury and manganese in maternal whole blood were measured in the first and third trimester visits. Cord blood concentrations of these metals were also measured. Urine analysis for speciated arsenic was conducted in the first trimester.
31. The proportions of women consuming regular, green or herbal tea during the first and third trimesters of pregnancy were described by GM of each metal in the maternal whole blood collected at these time points. Where significant differences in GM metal concentrations were observed between tea drinkers and non-tea drinkers, adjusted least squares geometric means (LSGMs), and their confidence intervals, were calculated by frequency of tea intake for each type of tea consumed.
32. In the first trimester, concentrations of all metals were above the limits of detection (LOD): lead (GM: 0.62 μg/dL) 100% of participants, mercury (GM: 2.99 nmol/L) 90% of participants; cadmium (GM 1.93 nmol/L) 97% of participants, arsenic (GM 9.75 nmol/L) 92% of participants and manganese (GM 160.1 nmol/L) 100% of participants. Adjusted LSGMs for lead in the first trimester were higher for tea drinkers than for those who were non-tea drinkers (LSGM 0.65 μg/dL, 95%CI: 0.62, 0.69 and 0.61 μg/dL, 95%CI: 0.59, 0.62), and there was evidence of a dose–response relationship for green and herbal tea. Those who consumed herbal tea in the third trimester had significantly higher third trimester maternal and cord blood lead concentrations than non-herbal tea drinkers. The authors were of the opinion that these results provided evidence of an association between blood lead concentrations and green or herbal tea consumption. However, they acknowledged that the GM blood lead concentrations of the highest tea consumers were still less than 1 μg/dL and within the normal range of blood lead concentrations in the Canadian population.
Arsenic
33. A discussion paper on the effects of arsenic in the maternal diet (TOX/2023/20) was presented to the COT in March 2023. Following this, an additional paper was presented containing information on epigenetic effects (TOX/2023/54) and the draft statement (TOX/2023/55).
34. The publication of the statement has been put on hold due to the recent assessments by EFSA and JECFA, and the need to consider which health-based guidance values to take forward for use in risk assessment.
Cadmium
35. In 2022, the COT published their statement on the potential risks from cadmium in the maternal diet (COT, 2022). Exposures considered cadmium levels that have been measured in the composite food samples of the Total Diet Study (TDS) (Bates et al., 2014, 2016; Roberts et al., 2018).
36. The food groups providing the highest cadmium exposures were miscellaneous cereals, potatoes, and bread. As stated above, high intakes of rice can occur, especially in certain groups, but there are no separate concentration data for cadmium in rice in the TDS. Although the TDS data can be used for exposure in specific sub populations (e.g. vegetarian or ethnic origin), the data sets are small and therefore not sufficiently robust to provide separate, statistically reliable exposure estimates in these sub-populations.
37. The COT concluded that “food is the main source of cadmium for non-smoking women of maternal age who have never smoked. In their assessment, breads, miscellaneous cereals and potatoes make the highest dietary contribution. Cadmium intake via other routes such as water, soil, and dust only contribute a small amount to total exposure. Taking the total amount of exposure from the TDS, the mean percentage and 97.5th percentile when compared to the EFSA tolerable weekly intake (TWI) of 2.5 µg/kg bw per week were 22-58% and 58-100% respectively.”
38. Overall, cadmium in the maternal diet does not appear to be a health concern.
Chromium
39. Chromium (Cr) is a hard, highly lustrous metal that exists in various mineral forms and is present throughout the environment. The most prevalent natural ionic form of chromium is Cr(III). Some Cr(VI) is present in the environment, largely due to industrial activity. The general population is primarily exposed to chromium via food and drinking water. The International Agency for Research on Cancer (IARC) reviewed Cr(III) and Cr(VI) and their compounds. Cr(VI) and its compounds have been classified as human carcinogens that cause cancers of the lung, and paranasal sinuses after inhalation (IARC, 2012). However, the potency of the carcinogenic effect varies with the physicochemical properties of the compound. There is no consistent evidence to suggest that Cr(III) compounds cause cancer in humans at concentrations to which people are exposed in food or the wider environment.
40. Little to no data could be found that specifically correlated the risk to health from chromium due to consumption of tea as part of the maternal diet.
41. In 2014, the FSA completed a survey of metals and other elements, this included chromium. Chromium was below the limit of detection (0.04 mg/kg) in tea (n=24) (FSA, 2014a).
42. In 2014, EFSA published a scientific opinion on the risks to public health related to the presence of chromium in food and drinking water (EFSA, 2014). The EFSA Panel on Contaminants in the Food Chain (CONTAM) considered the additional contribution to the exposure to Cr(VI) from water used to prepare certain foods including tea. A worst-case scenario assumed that there was no reduction of Cr(VI) into Cr(III) occurred when these foods were ingested immediately after their preparation. The scenario led to an increase up to two-fold in the exposure levels to Cr(IV), in comparison to those estimated via the consumption of only drinking water. However, the CONTAM Panel was not able to consider this additional contribution to the exposure to Cr(VI) when deriving margin of exposures (MOEs) since no reliable data to quantify Cr(VI) in food exist. The Panel derived a Tolerable Daily Intake (TDI) of 300 µg Cr(III)/kg bw per day from the relevant no observed adverse effect level of 286 mg/kg bw per day identified in a long-term rat study, applying the default uncertainty factor of 100 to account for species differences and human variability, and an additional uncertainty factor 10 to account for the absence of adequate data on reproductive and developmental toxicity.
43. Guidance from the UK Health Security Agency (UKHSA), states that there is some limited evidence to suggest that Cr(VI) compounds for example potassium dichromate may be toxic to reproductive system and the unborn child. Cr(III) compounds were not considered to be harmful to the unborn child at levels not harmful to the mother (UKHSA, 2022).
Lead
44. In 2014, the FSA performed an analysis of lead levels in tea (FSA, 2014b), i.e. in samples of black (n=42) and green tea (n=9) leaves. These samples were also analysed as tea liquid (drink), after steeping the tea leaves for both a shorter (15 seconds) and a longer brew time (20 minutes).
45. Results showed that the levels of lead in dried tea varied significantly, ranging from 0.125 to 2.56 mg/kg. The highest levels were found in green tea varieties, where n=5/9 samples contained lead levels above 1 mg/kg. The levels of lead found in the brewed teas were low with half the results being less than the LOD (<0.2µg/L). Teas brewed for a longer period of time resulted in only a slight increase in the level of lead. The report concluded that exposure to lead from the consumption of the analysed brewed teas was not a concern for consumer health compared to levels of exposure to lead from all dietary sources.
46. Studies by Gustin et al., (2020), Tagne-Fotso et al., (2016) and Wennberg et al., (2017) found an association between a mothers’ lead exposure increasing with increased consumption of coffee and/or tea.
47. In 2024, the COT published a statement on the effects of lead on the maternal health (COT, 2024). The FSA Exposure Assessment Team provided dietary exposure data on lead for women of childbearing age (16 – 49 years of age) as a proxy to maternal diet using data from the TDS food groups (Bates et al., 2014, 2016; Roberts et al., 2018). Tea (green and black) was included in the non-alcoholic beverages food group. The mean and 97.5th percentile exposure to lead (lower bound; LB to upper bound; UB) from this food group was 0-0.039 and 0-0.091 µg/kg bw per day, respectively.
48. The COT concluded that any risk of toxicity from lead in food is likely to be small. However, the COT acknowledged that “toxicity will depend on total exposure to lead from all sources”. As such the COT also considered aggregate exposures and concluded that “any aggregate risk of toxicity from lead in relation to the maternal diet together and other potential sources of maternal exposure is likely to be small.”
Mercury
49. In 2025, the COT published a statement on the effects of mercury on maternal health (COT, 2025). The FSA Exposure Assessment Team provided dietary exposure data on lead for women of childbearing age (16 – 49 years of age) as a proxy for maternal diet. Exposure to mercury was determined using data from the National Diet and Nutrition Survey (NDNS) (Bates et al., 2014, 2016, 2020; Roberts et al., 2018), and 2014 TDS (FERA, 2015).
50. Tea (green and black) was included in the non-alcoholic beverages food group. Non-alcoholic beverages resulted in a mean and 97.5th percentile exposure values of 0.07 and 0.17 µg/kg bw per week, respectively. This food category was the second highest contributor for exposure to mercury (the first was fish and seafoods).
51. The COT concluded that the high individual and aggregate exposure assessments to mercury from food, water, soil and air all estimated exposures were below the EFSA TWIs for both methylmercury and inorganic mercury. For the UK population, therefore, the risk to women of maternal age and their foetuses is low.
Trace elements
52. Trace elements such as aluminium, copper, fluoride, manganese and nickel are present in tea, as they are naturally absorbed from soil and water, with higher absorption rates in tea plants grown in acidic soil conditions. These elements can also be from anthropogenic sources (e.g. addition of pesticides, fertilisers) and have shown to influence the absorption by tea plants. The final concentration in tea is dependent on the soil, growth location, harvest time and processing (e.g. contamination from machinery) (Han et al., 2006; Rai, 2025).
53. Długaszek et al., (2025) determined the content of calcium, copper, iron, potassium, magnesium, manganese, sodium, zinc, and aluminium in infusions of black tea, including bagged and loose leaf. The amount of each element extracted from 1 g of tea was: calcium- ND (not detected)-7.23 mg, potassium- 15.1–32.3 mg, magnesium- 0.11–0.86 mg, sodium- ND-2.85 mg, and aluminium- ND- 1028 µg, copper- 1.24–11.02 µg, iron- ND-36.13 µg, manganese- 97.3–541.6, and zinc- 6.18–22.43 µg.
54. Tao and Mai (2017) determined the metal content in tea leaves (n=19; for further processing into green tea) grown in two Vietnam provinces. A total of 18 elements was determined including aluminium, calcium, potassium, magnesium, manganese, sodium, barium, iron, copper, tin, zinc, selenium, nickel, boron and heavy metal (lead, mercury, cadmium and arsenic). The results showed that potassium was present at the highest range at 12,203.49 – 21,762.47 mg/kg), followed by calcium (2,807.84 – 6,810.78 mg/kg), aluminium (237.96 – 2,454.48 mg/kg), magnesium (1,418.88 – 2,160.74 mg/kg), and manganese (409.21 – 2,149.15 mg/kg). Levels of heavy metals in most of the samples were either non detects or below the “acceptable level” as required by food law.
55. Podwika et al., (2017) investigated the concentrations of copper, manganese, zinc and cadmium in tea leaves (n=27 total; n=8 black, n=8 green) purchased from a market in Southern Poland. The mean levels of manganese, zinc, cadmium and copper in black tea were: 1,094.1, 21.8, 31.4 and 21.3 mg/kg, respectively. The mean levels of manganese, zinc, cadmium and copper in green tea were: 814.3, 21.6, 60.7 and 17.5 mg/kg, respectively.
56. Karak and Bhagat (2010) published a systematic review of the recent findings on different trace elements in tea leaves, made tea (black, green and oolong tea) and tea infusions from various non-EU countries. The range of trace elements aluminium, arsenic, cadmium, chromium, copper, iron, manganese, nickel and lead in tea infusions were 0.06 – 16.82 mg/L, trace – 1.53 μg/L, trace – 0.79 μg/L, below detectable limit (BDL) – 43.2 μg/L, 0.02 – 40.0 mg/L, 0.2 – 4.54 mg/L,– 250 mg/L and BDL – 0.16 mg/L, respectively. The authors concluded that the presence of trace elements in all analysed tea samples was within the safe limits for human consumption when comparing with health based guidance values from FAO/WHO (where available). However, they also noted that tea consumption “provides a significant additional source of trace elements” but that “toxicity of trace elements depends not only on the total amount of the metal but also on the existing species. Therefore, total element determination is not adequate for risk assessment.”
Fluorine – Fluoride
57. Fluorine is a trace element which is ubiquitous in the environment and is present at low levels in all plants and animals. Elemental fluorine is a highly reactive gas, and the ionic form, fluoride is present in food. Any references to fluorine in this section should be interpreted as fluoride i.e. since tea is a beverage/food. It was noted that the majority of information on fluoride was based on drinking water.
58. When considering drinking/tap water (typically used in tea making), fluoride is naturally present at low levels in most drinking water in England and Wales. Some drinking water is fluoridated; whereby drinking water is dosed to bring the fluoride level up to a target level of 1 mg/L as a public health measure intended to prevent tooth decay The maximum permitted level in drinking water is 1.5 mg/L. The Department of Health and Social Care is responsible for national policy on fluoridation (DHSC, 2025). The Drinking Water Inspectorate ensures that water companies comply with all drinking water regulations such that water supplies do not contain more than 1.5 mg/L of fluoride.
59. Pattaravisitsate et al., (2021) investigated the concentrations of fluoride in five different types of tea and herbal products purchased from a market in Bangkok. Teas were brewed for five minutes. The highest average concentration was detected in black tea (n=5/16) at 2.54 mg/L. The average concentration for green tea (n=3/16) was 1.19 mg/L. The concentrations of detected fluoride were inversely associated with the leaf size and the type of water (distilled ultrapure, water treated by reverse osmosis membrane system, tap, bottled and, bottled mineral) used for the brewing process.
60. Ruxton and Bond (2015) determined the fluoride content of UK retail tea and compared the levels between tea bags and infusions. The authors stated that tea provided ~70% of adult fluoride intake in the UK, with estimated daily mean tea intakes of 542 and 648 mL for all adults and older adults, respectively. Retail samples of tea bags (n=27 black; n=11 decaffeinated; n=11 speciality/single estate teas (white, green and black)). Mean fluoride/kg dry weight was 1,164 mg black blended, 877 mg speciality and 1,464 mg decaffeinated. Samples were brewed in 240 mL of boiled de-ionised water, 40 seconds later the bags were gently squeezed against the side of the beakers and removed. Infusions contained 4.91 mg/L black blended, 3.0 mg/L speciality and 7 mg/L decaffeinated equating to 0.72–1.68 mg of F- per serving.
61. Chan et al., (2013) reported a risk of high exposure to fluoride if consuming 1L/day of “UK supermarket economy black tea”, which contained levels of fluoride ranging from 3.60 to 7.96 mg/L in a two-minute brewing infusion (using deionised water).
62. Walters et al., (1983) reviewed the dietary intake of fluoride in the UK and fluoride content of some foodstuffs and noted that in some individuals fluoride intakes from tea could be as high as 8.9 mg/day. The authors estimated that tap water containing 1 mg fluoride/L could increase normal dietary intakes by 54%.
63. Sonnenburg et al., (2025) presented several scenarios which resulted in different levels of exposure to fluoride by varying the extent of oral intake of contributing sources. For tea consumption (black or green), the following serving sizes per day were used: 75 mL (0.5 cup), 150 mL (1 cup), 300 mL (2 cups), 600 mL (4 cups), and 1,200 mL (8 cups). The fluoride concentration was measured in the prepared infusions, considering the fluoride concentration in the water used for brewing. Results indicated that drinking black or green tea may result in fluoride exposure between 0.24 mg/d and 3.76 mg/d, based on a mean infusion concentration of 3.13 mg/L.
64. Kampouri et al., (2022) evaluated the impact of gestational fluoride exposure on birth outcomes (birth size and gestational age at birth). Maternal urinary fluoride (MUF) concentrations (n=558 gestational week 29, n= 463 4 months postpartum) were positively correlated with tea intake (p = < 0.001), with the correlation of urinary fluoride being stronger with black tea (p = < 0.000) than with green tea (p = 0.013).
65. Krishnankutty et al., (2021) examined maternal exposure to fluoride through tea consumption in a low-fluoride water region (Western Jutland, Denmark; fluoride range: 0.10 to 0.18 mg/L, mean 0.12 mg/L) by measuring fluoride released from commercially available teas (tea bags (n=33) and loose teas n=57)). The fluoride concentration from tea bags ranged from 0.34 to 2.67 mg/L. In loose teas the levels for black and green tea were 0.72 – 4.50 and 1.28 – 1.50 mg/L, respectively. MUF concentrations were measured in spot urine samples (n=118) from first-trimester pregnant women and in prepared tea infusions made with deionised water. MUFs from pregnant tea drinkers were higher than those with no tea consumption (p=0.002).
66. The UK first reviewed the safety of fluorine in 2000, based on the findings of a TDS conducted by the FSA in 1997 (FSA, 2000). The TDS collected food samples which were analysed for the presence of halogen elements, including fluorine (COT, 2000). The highest mean fluoride concentrations were found in fish (1.9 mg/kg) and beverages (1.1 mg/kg). The high fluoride levels in fish are thought to originate mainly from the skeleton, as fluoride accumulates in the bones of fish. Some canned fish contains small bones which may result in a higher fluoride exposure if eaten whole. The fluoride content of beverages largely reflects the fluoride content of the water used in their preparation. However, tea contains higher amounts of fluoride than other beverages, as fluoride is selectively taken up from the soil by the tea plant (COT, 2003a).
67. The United States Department of Health and Human Services National Institutes of Health Office of Dietary Supplements (US NIH ODS) state that “brewed tea typically contains higher levels of fluoride than most foods, depending on the type of tea and its source, because tea plants take up fluoride from soil.” Fluoride levels can range from 0.3 to 6.5 mg/L (0.07 to 1.5 mg/cup) in brewed tea made with distilled water. Other sources of dietary fluoride were provided, and most foods not prepared with fluoridated water was described to provide less than 0.05 mg/100g (US NIH, 2025).
68. There is an upcoming piece of work for COT to review toxicity information with respect to fluoride in relation to neurotoxicity, effects on bone and effects on the thyroid, and to consider the potential risks in the context of UK exposure levels through dental products, drinking water, and other exposure sources. Tea will be considered as one of the other exposure sources. Specific evaluation of the impact of tea in the maternal diet will be made following this wider COT review.
Manganese
69. Manganese (Mn) is a silver-grey metal that is naturally present in the earth’s crust. It is found in water, soil and rocks combined with sulphur, oxygen and chlorine (UKHSA, 2024). The general public may be exposed to low levels of manganese due to its natural presence in the environment. Manganese is involved in the formation and activation of several enzymes in the human body.
70. The main exposure pathway of manganese is from dietary sources (food and drinking water). Nuts, grains, beans and tea are rich in manganese, and as such, vegetarians and tea drinkers may have higher intakes than the average person, but such levels are unlikely to cause adverse health effects (DWI, undated). The maximum concentration of manganese in UK drinking water is 50 µg/L (DWI, undated). An individual should be able to get all the manganese they require by eating a varied and balanced diet. For the majority of the population, taking 4 mg or less of manganese from supplements a day is unlikely to cause harm (NHS, 2020).
71. Özdemir and Güçer (1998) developed a speciation scheme for the identification of manganese in tea leaves and tea infusions. The range of manganese in five different groups of tea leaves was 1,107–2205 μg/g (dry weight). It was noted that 30% of Mn (II) was passed into the water of tea infusions.
72. Extremely high manganese exposure in children may affect brain development. However, it is not known whether children are more sensitive than adults. Exposure to manganese during pregnancy is not likely to cause damage to the unborn child at doses where the mother appears unaffected (UKHSA, 2024). However, some studies suggest that higher manganese levels were associated with an increased odds ratio for maternal complications (Iqbal et al., 2020), increased the risk of preterm delivery (Bakouei et al., 2015), and were associated with the risk of preeclampsia (Liu et al., 2020).
73. The COT updated their assessment on the safety of manganese following the availability of an updated TDS conducted by the FSA in 2000 (COT, 2003b).There was insufficient information to determine whether there were toxicological risks associated with dietary exposure to manganese and the COT did not specifically consider sub-population groups such as pregnant, lactating or breastfeeding women. In their assessment on the potential risks from manganese in the diets of infants aged 0-12 months and children aged 1 to 5 years, their review included data that considered adverse neurological effects from in utero exposure but the COT concluded that “it was not possible to relate the adverse effects observed in humans to dietary exposures and therefore it is not possible to draw firm conclusions on the effects of current dietary exposures on the neurodevelopment of children ages 0-5 years” (COT, 2018).
74. In 2023, the EFSA Panel on Nutrition, Novel Food and Food Allergens (NDA) published a scientific opinion on the tolerable upper intake level for manganese. Based on the available human and animal studies, neurotoxicity was identified as the critical effect; however, the data were not sufficient nor suitable to characterise a dose-response relationship and identify a reference point for manganese induced neurotoxicity. EFSA noted that the main contributors to manganese intake from the background diet are grain-based products (mainly bread (and similar products), and breakfast cereals), tea and other manganese-rich beverages (e.g. hibiscus, maté infusions). High consumers of tea and other manganese-rich beverages, or vegetarians, may have habitual intakes of manganese in the higher range of the intake distribution in the general population. For vegetarians, this ranges from 1.5 to 2.4-fold higher intakes of manganese compared to those with omnivorous diets. For tea drinkers, in a ‘UK food composition database’ a value of 0.14 mg manganese /100 g of tea was found. The mean intake was 5.5 mg/day (range 2–12 mg/day) or 10 mg/day (range 5–20 mg/day), whilst the mean for non-tea drinkers was 3.2 mg/day (range 0.5–6.5 mg/day). For pregnant and lactating women the 95th percentile estimated background intake of manganese from natural food sources was up to 8.27 mg/day and 8.97 mg/day in lactating women, respectively (data were based on surveys included in EFSA’s intake assessment).
75. The EFSA NDA Panel utilised the estimated background dietary intakes (i.e. manganese intakes from natural dietary sources only) for the 95th percentile of consumers EFSA established a safe level of intake of 8 mg/day for adults ≥18 years (including pregnant and lactating women) and a range of 2 to 7 mg/day for other population groups.
76. In 2021, WHO performed a reassessment of the risk posed by manganese in drinking water in support for the development of WHO Guidelines for drinking-water quality (WHO, 2021). The WHO reviewed studies relating to prenatal exposures of manganese and risks to foetus health/development. Specific maternal effects were not considered. The WHO reviewed a number of epidemiological studies that have identified associations between neurotoxic effects in children and increased exposure to manganese in drinking water and established a provisional HBGV (pHBGV) of 80 µg/L for total manganese, based on “identified health considerations for bottle-fed infants.” Bottle-fed infants were identified to be the most susceptible subpopulation; however, the WHO noted that the pHBGV is also applicable to the general population. In 2022, the WHO derived a TDI of 0.024 mg/kg bw by applying an uncertainty factor of 1,000 to a lowest-observed adverse effect level of 25 mg/kg bw per day identified from studies that reported neurological effects in rats exposed to manganese from birth to postnatal day 21 (WHO, 2022).
Naturally occurring toxins
In this guide
In this guideThis is a paper for discussion. It does not reflect the views of the Committee and should not be cited.
Alkaloids
Pyrrolizidine alkaloids
77. Pyrrolizidine alkaloids (PAs) are naturally occurring toxins found in variety of plant species and are produced as a defence mechanism against insect herbivores. C. sinensis does not produce PAs itself but depending on their cultivation and harvesting, contamination with other plants (i.e. weeds) that produce PAs is possible.
78. In 2014, the FSA commissioned a research project/market survey of the occurrence of PAs in food (FSA, 2014c). The samples included tea and herbal infusions. The analytical results are provided in Table 1.
Table 1 – Analytical results for PAs detected in tea samples (n=55) (FSA, 2014c).
|
Sample |
Total no. of samples |
No. of samples in which PAs were detected |
0-100 µg/kg |
100-500 µg/kg |
500-1000 µg/kg |
1000-3000 µg/kg |
>3000 µg/kg |
Range (µg/kg) |
|
Teas (black, green and Early grey) |
55 |
11 |
6 |
4 |
- |
1 |
- |
<LOQ – 1,170 |
Abbreviations: LOQ – limit of quantification.
79. The findings of the report led to changes in agricultural practices and newer industry results show a reduction in PA levels (FSA, 2014d). The FSA continues to monitor the levels of PAs in food.
80. In 2008, the COT published a statement on PAs in food, specifically in honey and milk (COT, 2008b). The COT noted that the available reports of human poisoning cases did not provide sufficient reliable exposure data to be used in establishing a health-based guidance value (HBGV). The COT therefore concluded that a two-year study in rats administered riddelliine by oral gavage was the most robust basis for assessing the non-cancer effects of PAs (US NTP, 2003). The COT statement does not include any detail on PAs in tea or exposure thereof.
81. In 2011, the EFSA CONTAM Panel assessed the risks related to the presence of PAs in food in feed (EFSA, 2011). Based on the available data, the CONTAM Panel concluded that 1,2-unsaturated PAs may act as genotoxic carcinogens in humans and applied the MOE approach. The occurrence data of PAs was limited to honey, but EFSA concluded that there was a possible health concern for toddlers and children, who were the high consumers of honey.
82. A new exposure assessment including new occurrence data was published by EFSA in 2016 (EFSA, 2016) and was used to update the risk characterisation for the EFSA assessment in 2017 (EFSA, 2017). The assessment considered the presence of PAs in honey, tea, herbal infusions and food supplements. EFSA established a new Reference Point of 237 μg/kg body weight per day to assess the carcinogenic risks of PAs, and concluded that there is a possible concern for human health related to the exposure to PAs, in particular for frequent and high consumers of tea and herbal infusions.
83. In 2013, the German Federal Institute for Risk Assessment (BfR) published an opinion regarding PAs in herbal teas and tea (BfR, 2013). Green and black tea samples (n=8 each) were analysed for 17 PAs: echimidine, heliotrine, heliotrine-N-oxide intermedine, lasiocarpine, lasiocarpine-N-oxide, lycopsamine, monocrotaline, monocrotalineN-oxide, retrorsine, retrorsine-N-oxide, senecionine, senecionine-N-oxide, seneciphylline, seneciphylline-N-oxide, senkirkine and trichodesmine.
84. The UB value of PA contents in green and black tea was 486.9 and 1155.5 µg/kg of dry product, respectively. While the BfR’s exposure assessment did not include green and black tea due to the small number of samples, the BfR overall concluded that the probability of adverse health effects from long-term consumption of teas with high PA contents was “possible” for the general population, pregnant women, breastfeeding women and children; the severity of these adverse health effects may vary. This conclusion was based on “average” robustness of the available data (“some important data is missing or is contradictory”). The BfR recommended that exposures to PAs can be controlled by taking precautionary measures (e.g. vary consumption of herbal teas and teas with other beverages) and/or refraining from consumption.
Tropane alkaloids
85. Tropane alkaloids (TAs) are secondary plant metabolites and are mostly found in high concentrations in the Solanaceae and Erythroxylaceae plant species. They are characterised by their unique bicyclic tropane ring system and are classed in three major groups: i) hyoscyamine and scopolamine, ii) cocaine and iii) calystegines. Although all TAs have the same basic structure they differ in their biological, chemical and pharmacological properties (Kohnen-Johannsen and Kayser, 2019).
86. In 2017, EFSA commissioned research to obtain representative occurrence data for TAs in foods, to which the FSA provided UK data (FSA, 2017). A total of 286 UK retail samples of which 20 were dry herbal teas were analysed for the EFSA survey, an additional 52 of which 9 were tea were analysed on behalf of the FSA. The TAs tested for were scopolamine, atropine, 6-hydroxytropinone, O-acetylscopolamine, nortropinone, anisodamine, pseudotropine, anisodine, scopine, apoatropine, scopoline, aposcopolamine, tropine, tropinone, homatropine, 2α-hydroxymethyl, littorine, convolamine, noratropine, convolidine, norscopolamine, convolvine, phenylacetoxytropane, fillalbine, and calystegines (for potatoes and aubergine only).
87. The data reported here focusses on black and green tea samples. For the FSA analysis, samples of black and green tea were selected (n=5 and 4, respectively). Two samples contained low levels of scopolamine at 0.15 µg/kg and 0.05 µg/kg (both in black tea), although this level was below the reporting limit of 0.1 µg/kg and could not be confirmed by ion ratio. The presence of TAs in tea was presumed to be “caused by the unintentional inclusion of TA containing weeds in the tea product.”
88. The FSA research (FSA, 2017) included a review of the toxicity of TAs and concluded that “very little is known about the toxicity of TAs other than atropine and scopolamine.”
89. In 2022, the EFSA published an assessment of the conclusions of the Joint FAO/WHO Expert meeting on tropane alkaloids (EFSA, 2022b). The main TAs considered in the assessments were (‐)‐hyoscyamine and (‐)‐scopolamine, which exert their pharmacological and toxicological effects by acting as competitive antagonists of the muscarinic acetylcholine receptors. Both authoritative bodies considered a study in human volunteers as the key study to assess the effects of TAs. The EFSA CONTAM Panel established a group ARfD of 0.016 μg/kg bw for the sum of (‐)‐hyoscyamine and (‐)‐scopolamine, based on decreased heart rate. EFSA concluded that “an update the CONTAM Panel assessment on the risks to human health related to the presence of tropane alkaloids in food is not considered necessary.” In contrast, the FAO/WHO concluded that it was not possible to establish an ARfD and instead selected a point of departure of 1.54 μg/kg bw for the sum of the two substances, based on decreased salivary secretion, and applied a MOE approach. For the general diet, MOEs for the general population (children and women of reproductive age) ranged from 3 080 to 3 850 (mean) and 440–616 (95th percentile) for combined exposures to hyoscyamine and scopolamine. These MOEs were not considered to be of concern by the FAO/WHO (FAO and WHO, 2020).
Mycotoxins
90. Mycotoxins are naturally occurring toxins produced by certain moulds (fungi). They grow on a variety of different crops and foodstuffs, often under warm and humid conditions and can cause a variety of adverse health effects and pose a serious health threat to both humans and livestock (WHO, 2023).
91. Mycotoxins production can occur at any stage during manufacturing, during, cultivation, harvest, processing and storage (Sedova et al., 2018). The literature reports that due to the different processing steps and characteristics of different tea categories (e.g., green and black), fungal contamination likelihoods and varieties differ from each other. Zhang et al., (2022) collated survey results of mycotoxins in different categories. The mycotoxins detected in green and black tea are show in Table 2.
Table 2 – Survey results of mycotoxins in green and black tea (adapted from Zhang et al., 2022).
|
Tea |
Detected mycotoxins |
|
Green |
AFB1, ENB, OTA |
|
Black |
AFs, AFB1, AFG2, CTN, DON, FB1, OTA, ZEN, T-2 |
Abbreviations: AFs – Aflatoxins; AFB1 – Alfatoxin B1; AFG2 – Aflatoxin G2; CTN – Citrinin; DON – Deoxynivalenol; ENB – Enniatin B; FB1 – Fumonisin. B1; OTA – Ochratoxin A; ZEN - Zearalenone.
92. In GB, maximum levels for mycotoxin are set in Assimilated Regulation (EU) 1881/2006. While tea is not among the highest-risk commodities for mycotoxins, aflatoxins and ochratoxin A are monitored and regulated. The official methods for sampling and analysis of mycotoxins are listed in Assimilated Regulation (EU) 401/2006.
93. Kyei et al., (2022) investigated the exposure of 439 pregnant women in rural Bangladesh to 35 mycotoxins and their corresponding health risks. Overall, 447 first-morning urine samples were collected from pregnant women and mycotoxin biomarkers were quantified. Median regression analyses were performed to investigate the association between the consumption of certain foods and local stimulants (betel nut/leaf and chewing tobacco), and urinary concentration of frequently occurring mycotoxins. In the tested cohort, 52% of women consumed hot beverages like tea or coffee the day prior to urine collection. While the study did not provide further information on the amounts consumed, it noted that in the region where the study was conducted tea was consumed more frequently than coffee. The results showed a “significant negative associations between urine OTA concentration and intake of … tea or coffee (p=0.01).” The estimated mean dietary exposure to OTA in the study population (for the total diet, not just from tea) ranged from 400-426 ng/kg bw (LB – UB). The maximum estimated probable daily intake for OTA was 3, 968 ng/kg bw and 8, 070 ng/kg bw when using density-adjusted and creatinine-adjusted data. The health risk was characterised utilising the MOE approach. Even under the LB scenario, the MOEs for OTA were lower than 1000 in nearly all samples (95%) and the authors noted that this indicated a high health concern.
94. Ongoing work of the COT includes the review of the potential risk of several mycotoxins from the diet to maternal health.
Plant components
In this guide
In this guideThis is a paper for discussion. It does not reflect the views of the Committee and should not be cited.
95. For purpose of this this discussion paper, plant components are chemical compounds that are intrinsic to the normal physiology of C. sinensis. These include polyphenols.
Polyphenols
96. Tea polyphenols mainly include flavonoids, flavanols, phenolic acids. Tea polyphenols, known as catechins are reported to account for 30-42% of the dried weight of the solids in brewed green tea. Green tea contains the highest levels of catechins. These include: catechin, epicatechin, gallocatechin, epigallocatechin, catechin gallate, epigallocatechin-3-gallate (EGCG), epicatechin gallate, and gallocatechin gallate.
97. Due to various preparations of black tea, a definitive composition for the components of solid extracts in black tea can only be estimated, these are: catechins (10–12%), theaflavins (3–6%), thearubigins (12–18%), flavonols (6–8%), phenolic acids (10–12%), amino acids (13–15%), methylxanthines (8–11%), carbohydrates (15%), proteins (1%), mineral matter (10%), and volatiles (< 0.1%).
98. It has been suggested that the polyphenolic compounds EGCG and theaflavin-3’3-digallate found in green and black tea, respectively are the two compounds that result in positive health effects (Khan and Mukhtar, 2007).
99. In 2018, EFSA assessed the safety of green tea catechins (EFSA, 2018). It was noted by EFSA that none of the intervention studies addressed pregnant women, breast-fed infants or children. Overall, the conclude that “the sparse data on green tea exposure from traditional green tea infusions and noted that there was no evidence of elevated ALT [alanine transferase] levels at a consumption of green tea infusion of ≥ 5 cups per day or containing 700 mg EGCG/day.”
100. Dania et al., (2022) performed a systematic review and meta-analysis to investigate whether pregnant women who drink tea have a higher incidence rate of anaemia than non-tea drinking pregnant women. Based on the seven studies that were selected, based on a set of inclusion criteria, pregnant women (n=280-550 per study) who were tea drinkers were shown to have a 1.94 times increased risk of developing anaemia compared to pregnant women who did not drink tea (adjusted odd ratio (OR) = 1.94; 95% confidence interval (CI) =1.10 to 3.43; p= 0.020). The authors proposed that this increase is based on the polyphenols in tea inhibiting iron absorption.
101. Yazdy et al., (2012) examined whether tea consumption during early pregnancy was associated with an increased risk of spina bifida as previous studies have demonstrated that catechin (present in tea) reduces the bioavailability of folate. The authors utilised data from the Slone Epidemiology Centre Birth Defects Study. Mothers of 518 spina bifida cases and 6,424 controls were interviewed. Data on tea intake were collected during three periods (1976–1988, 1998–2005 and 2009–2010). Logistic regression models were used to calculate ORs and 95% CIs. Among women with total folic acid intake greater than 400 μg, consumption of 3 cups or more of tea per day was associated with an increased risk of spina bifida in 1976-1988 (OR, 2.04; 95% CI, 0.69–7.66) and in 2009-2010 (OR, 3.13; 95% CI, 0.87–11.33). For 1976-1988, ORs were not elevated for daily tea intake). The authors acknowledged that the data generated do not support an overall association between tea consumption and spina bifida; however, the data did suggest a possible interaction between higher levels of folic acid intake and tea consumption.
102. Ye et al., (2011) examined the association between tea drinking during periconceptional period and the risk of neural tube defects (NTDs) in a population-based case-control study in Shanxi, China. The authors hypothesized that tea catechins inhibit the activity of the enzyme dihydrofolate reductase, which catalyses the inactive form of folate 7,8-dihydrofolate to the active form of folate 5,6,7,8-tetrahydrofolate.They suggested that the inhibition would lead to disturbance of the folate metabolic pathway and to lower bioavailability of folate to cells and therefore, it may increase the risk of NTDs. Compared with women who did not drink tea during the periconceptional period (487 NTD cases and 688 controls), women who drank tea daily (20 NTD cases and 9 controls) had a 3-fold increased risk (ORs = 3.1 [95% CI = 1.4–7.0]) of having an NTD-affected pregnancy.
Process contaminants
In this guide
In this guideThis is a paper for discussion. It does not reflect the views of the Committee and should not be cited.
Acrylamide and furans
103. Acrylamide, furan and methyl furans (2-methyl furan, 3-methyl furan, 2,5-dimethyl furan) are organic compounds produced when some foods are subjected to high temperatures (greater than 120ºC) during cooking (including home-cooking) and processing (FSA, 2014d).
104. Tea is typically processed in four stages: withering, rolling, oxidation and drying. The aim of these steps is to reduce the moisture content of the fresh tea leaves. The drying stage involves heating at various temperatures and for different times. The typical industrial drying parameters of black tea is 100 - 140°C (Aaqil et al., 2023), whilst higher temperatures are utilised for green tea at 130 - 150°C (Zhou et al., 2024). The formation of acrylamide and furans in tea are therefore possible at the higher temperature range.
105. Regular and prolonged exposures over a lifetime to foods containing high levels of acrylamide and furan has the potential to increase the risk of developing cancer. The FSA concluded that exposure to acrylamide and furan should be as low as reasonably achievable (ALARA) (FSA, 2022).
106. There is no specific maximum limit for acrylamide in tea (green or black). However, assimilated Regulation (EU) 2017/2158 – for England and Wales and Regulation (EU) 2017/2158 for Northern Ireland) requires food business operators to put in place practical steps to manage acrylamide within their food safety management systems, including sourcing of ingredients, and appropriate storage (FSA, 2024). There is no specific regulation for maximum levels of furans in tea (green or black). The FSA monitors the levels of acrylamide and furans in food surveys.
107. The FSA has not conducted any food survey specifically focused on tea with regard to acrylamide or furans. However, previous broad, multi-product contaminant surveys did not identify tea as major sources of acrylamide and furans (FSA, 2014; 2018; 2024). Furans will also evaporate from hot drinks in an open container, thus minimising exposure.
108. Hinojosa-Nogueira et al., (2025) evaluated exposure to 11 food processing contaminants and their effects on maternal and foetal health in a group of women from Northern Spain. This included 5-Hydroxymethyl-2-Furfural (HMF5), furosine, acrylamide, and furan. The study analysed the characteristics of 84 pregnant women and their newborns. The average age of participants was ~35 years. Dietary intake during pregnancy was assessed using a food frequency questionnaire once in the first trimester and again in the third trimester.
109. Analysis showed that for the dietary intake of HMF5, coffee, cocoa, tea and infusions were responsible for 86% of the total exposure, with mean exposures being 0.81 ± 0.91 mg/kg bw per day. Exposure to acrylamide and furans from this food group contributed 14% (0.15 ± 0.10 µg/kg bw per day) and 30% (0.66 ± 0.03 µg/kg bw per day) of the total exposure, respectively. The study did not provide a breakdown on the numbers of samples for each of the hot drinks. Therefore, it is not possible to establish the contribution of tea consumption alone to the exposure of these compounds.
110. It is anticipated that the COT will be undertaking work on acrylamide later in the year and this will be reflected in the maternal diet programme of work.
Polyaromatic hydrocarbons
111. Polyaromatic hydrocarbons (PAHs) are compounds that have at least two condensed aromatic rings. They can be formed during food processing procedures such as grilling, roasting, frying, smoking and drying. PAHs are also common environmental pollutants generated from the incomplete combustion of fossil fuels or biomass (Ma et al., 2023).
112. At present in the UK, there are no established maximum permitted levels of PAHs in tea.
113. In 2015, the FSA published a report on the occurrence of PAHs in herbs, spices, supplements and tea (FSA, 2015). PAHs were measured in 92 of the 95 teas tested (n= 68 herbal teas, n=27 teas). Teas that had concentrations either at the LOD or very low PAH4 (sum of benzo[a]pyrene, benz[a]anthracene, benzo[b]fluoranthene, and chrysene) concentrations (n=3; ranging from LOD – 21.04 µg/kg) and were intended for consumption by infants. Of the remaining samples, the majority showed PAHs with lower molecular weight to occur at elevated levels. Benzo(a)pyrene (BaP) concentrations ranged from <0.13 µg/kg to 80.54 µg/kg with a mean of 6.00 µg/kg. PAH4 concentrations ranged from 0.40 µg/kg to 385.93 µg/kg with a mean of 32.73 µg/kg. Approximately a third of the samples showed BaP and PAH4 concentrations above 2 µg/kg and 20 µg/kg, respectively.
114. In 2008, the EFSA CONTAM Panel published their scientific opinion on PAHs in food (EFSA, 2008). This included dried tea samples (n=30). The lower and upper bound means concentrations are shown in Table 4.
Table SEQ Table \* ARABIC 3 - Lower and upper bounds for the mean of the concentration of BaP, PAH4 and PAH8 (µg/kg) (adapted from EFSA, 2008).
|
Mean levels (µg/kg) |
BaP |
PAH2 |
PAH4 |
PAH8 |
|
Lower bound |
8.37 |
24.85 |
42.66 |
61.02 |
|
Upper bound |
8.38 |
24.87 |
42.69 |
61.14 |
BaP = benzo[a]pyrene.
PAH2 = benzo[a]pyrene and chrysene.
PAH4 = benzo[a]pyrene, chrysene, benz[a]anthracene and benzo[b]fluoranthene.
PAH8 = PAH4 plus benzo[k]fluoranthene, benzo[ghi]perylene, dibenz[a,h]antracene, indeno[1,2,3-cd]pyrene.
115. In general, it was observed that tea was noted to exceed 10 µg/kg of PAH8. The concentrations of PAHs in the 30 tea leaf samples varied between 1 and 173 µg/kg with 20% exceeding 100 µg/kg. EFSA however noted that the preparation of the tea will dilute the level found in the beverage before consumption. The average total dietary exposure (whole population) for the UK to BaP, PAH2, PAH4 and PAH8 was 188, 499, 936 and 1,415 ng/day, respectively. Based on their corresponding BMDL10 values, the MOEs for PAHs indicate a low concern for consumer health at the average estimated dietary exposures across EU Member States (average exposures 3.1-4.3 ng/kg bw per day, MOEs: 16,300-22,600 for benzo[a]pyrene alone and 23.6-35.6 ng/kg bw per day, MOEs: 13,800-20,800 for PAH8).
Summary
In this guide
In this guideThis is a paper for discussion. It does not reflect the views of the Committee and should not be cited.
116. The purpose of this scoping paper was to provide an overview of chemical compounds (excluding caffeine) found in green and black tea (C. sinensis), that may pose health risks to women during pregnancy, childbirth, and up to 24 months postpartum.
117. The UK imports ~110,240 tonnes of black tea and ~3,460 tonnes of green tea annually. The main importers are Kenya and Germany. Import restrictions apply to Chinese tea due to pesticide residue compliance (under HRFNAO).
118. The chemical groups reviewed included chemicals involved in crop management (pesticides), heavy metals (arsenic, cadmium, chromium, lead, mercury), naturally occurring toxins (alkaloids and mycotoxins), plant components (polyphenols and trace elements) and process contaminants (acrylamide, furans and polyaromatic hydrocarbons).
119. UK/MRLs apply to pesticides and recent surveys show compliance. There is no significant association between dietary intake and adverse birth outcomes in based on the available information. Lead and mercury exposures from tea are low and not considered a major risk, cadmium exposure from tea is minimal compared to other foods. Some studies suggest that higher maternal blood metal levels are observed in pregnant women who are tea drinkers, but the levels are within normal ranges. The presence of alkaloids is rare and likely to result from contamination. There was limited data available that specifically correlated the risk to health from the maternal diet based on consumption of tea that was contaminated with mycotoxins. The concentration of process contaminants that are formed during drying stages (acrylamide, furans, PAHs) in tea are generally low.
120. The key observations were:
- Most compounds occur at low levels; regulatory limits and monitoring exist for many.
- Some evidence suggests tea drinking during pregnancy may increase risk of anaemia (due to polyphenols) and possibly neural tube defects (linked to folate metabolism).
- Fluoride and manganese intake from tea can be elevated, especially for high consumers.
- Data gaps remain for maternal-specific risk assessments for several compounds.
Abbreviations
In this guide
In this guide|
AFB1 |
Alfatoxin B1 |
|
AFG2 |
Aflatoxin G2 |
|
AFs |
Aflatoxins |
|
ALARA |
As low as reasonably achievable |
|
ALT |
Alanine transferase |
|
ARfD |
Acute Reference Dose |
|
BaP |
Benzo(a)pyrene |
|
BDL |
Below detectable limit |
|
BfR |
German Federal Institute for Risk Assessment |
|
CI |
Confidence interval |
|
CONTAM |
Contaminants in the Food Chain |
|
COT |
Committee on the Toxicity of Chemicals in Food, Consumer Products and the Environment |
|
Cr |
Chromium |
|
CTN |
Citrinin |
|
DHSC |
Department of Health and Social Care |
|
DON |
Deoxynivalenol |
|
DWI |
Drinking Water Inspectorate |
|
EC |
European Commission |
|
EFSA |
European Food Safety Authority |
|
EGCG |
Epigallocatechin-3-gallate |
|
ENB |
Enniatin B |
|
EU |
European Union |
|
FAO |
Food and Agriculture Organisation |
|
FB1 |
Fumonisin B1 |
|
FSA |
Food Standards Agency |
|
GB |
Great Britain |
|
GM |
Geometric mean |
|
HBGV |
Health based guidance value |
|
HMF5 |
5-Hydroxymethyl-2-Furfural |
|
HMRC |
UK HM Revenue and Customs |
|
HRFNAO |
High-Risk Food and Feed of Non-Animal Origin |
|
IARC |
International Agency for Research on Cancer |
|
IQ |
Intelligience quotient |
|
JECFA |
Joint FAO/WHO Expert on Committee on Food Additives |
|
LOD |
Limit of detection |
|
LOQ |
Limit of quantification |
|
LSGMs |
Least squares geometric means |
|
MIREC |
Canadian Maternal-Infant Research on Environmental Chemicals |
|
Mn |
Manganese |
|
MRLs |
Maximum residue levels |
|
MUF |
Maternal urinary fluoride |
|
NCCIH |
US National Centre for Complementary and Integrative Health |
|
ND |
Not detected |
|
NDA |
Nutrition, Novel Food and Food Allergens |
|
NDNS |
National Diet and Nutrition Survey |
|
NHS |
National Health Service |
|
NTDs |
Neural tube defects |
|
OR |
Odd ratio |
|
OTA |
Ochratoxin A |
|
PAH2 |
benzo[a]pyrene and chrysene |
|
PAH4 |
sum of benzo[a]pyrene, benz[a]anthracene, benzo[b]fluoranthene, and chrysene |
|
PAH8 |
PAH4 plus benzo[k]fluoranthene, benzo[ghi]perylene, dibenz[a,h]antracene, indeno[1,2,3-cd]pyrene |
|
PAHs |
Polyaromatic hydrocarbons |
|
PAs |
Pyrrolizidine alkaloids |
|
pHBGV |
Provisional health based guidance value |
|
PRiF |
Pesticide Residues in Food |
|
SACN |
Scientific Advisory Committee on Nutrition |
|
TAs |
Tropane alkaloids |
|
TDI |
Tolerable daily intake |
|
TDS |
Total Diet Study |
|
TUIL |
Tolerable upper intake levels |
|
TWI |
Tolerable weekly intake |
|
UK |
United Kingdom |
|
UK |
United Kingdom |
|
UKHSA |
UK Health Security Agency |
|
US EPA |
United States Environmental Protection Agency |
|
US FDA |
United States of America Food and Drug Administration |
|
US NIH ODS |
United States Department of Health and Human Services National Institutes of Health Office of Dietary Supplements |
|
US NTP |
US National Toxicology Program |
|
WHO |
World Health Organization |
|
ZEN |
Zearalenone |
References
In this guide
In this guideThis is a paper for discussion. It does not reflect the views of the Committee and should not be cited.
Aaqil, M., Peng, C., Kamal, A., Nawaz, T., Zhang, F. And Gong, J. (2023) Tea Harvesting and Processing Techniques and Its Effect on Phytochemical Profile and Final Quality of Black Tea: A Review. Foods 13;12(24):4467. https://doi.org/10.3390/foods12244467.
Bakouei, S., Reisian, F., Lamyian, M., Zadeh, E. H., Zamanian, H. And Kharameh, Z. T. (2015) High Intake of Manganese During Second Trimester, Increases the Risk of Preterm Delivery: A Large Scale Cohort Study. Glob J Health Sci. 2015 Mar 16;7(5):226–232. https://doi.org/10.5539/gjhs.v7n5p226.
Bates, B., Lennox, A., Prentice, A., Bates, C., Page, P., Nicholson, S. and Swan, G. (2014) National Diet and Nutrition Survey (NDNS): results from Years 1 to 4 (combined) of the rolling programme for 2008 and 2009 to 2011 and 2012. NDNS: results from Years 1 to 4 (combined) - GOV.UK Accessed: 05/11/2025.
Bates, B., Cox, L., Nicholson, S., Page, P., Prentice, A., Steer, T. and Swan, G. (2016) National Diet and Nutrition Survey (NDNS): results from Years 5 and 6 (combined) of the Rolling Programme (2012/2013 – 2013/2014). NDNS: results from Years 5 and 6 (combined) - GOV.UK Accessed: 05/11/2025.
Bates, B., Collins, D., Jones, K., Page, P., Roberts, C., Steer, T. and Swan, G. (2020) National Diet and Nutrition Survey Results from years 9, 10 and 11 (combined) of the Rolling Programme (2016/2017 to 2018/2019). National Diet and Nutrition Survey Accessed: 05/11/2025.
BfR. (2013) Pyrrolizidine alkaloids in herbal teas and teas. BfR Opinion No. 018/2013 of 5 July 2013. Pyrrolizidine alkaloids in herbal teas and teas Accessed: 07/01/2026.
Chan, L., Mehra, A., Saikat, S. and Lynch, P. (2013) Human exposure assessment of fluoride from tea (Camellia sinensis L.): A UK based issue? Food Research International Volume 51, Issue 2, May 2013, pp. 564-570. https://doi.org/10.1016/j.foodres.2013.01.025.
Chen, H., Wang, Q., Jiang, Y., Wang, C., Yin, P., Liu, X., & Lu, C. (2015). Monitoring and risk assessment of 74 pesticide residues in Pu-erh tea produced in Yunnan, China. Food Additives & Contaminants: Part B, 8(1), 56–62. https://doi.org/10.1080/19393210.2014.972471.
Colapinto, C. K.., Arbuckle, T. E., Dubois, L. and Fraser, W. (2015) Tea consumption in pregnancy as a predictor of pesticide exposure and adverse birth outcomes: The MIREC Study. Environmental Research Volume 142, October 2015, pp. 77-83. https://doi.org/10.1016/j.envres.2015.06.020.
Colapinto, C. K.., Arbuckle, T. E., Dubois, L. and Fraser, W. (2016) Is there a relationship between tea intake and maternal whole blood heavy metal concentrations? Journal of Exposure Science & Environmental Epidemiology volume 26, pages503–509 (2016). https://doi.org/10.1038/jes.2015.86.
COT. (2000) Statement on the 1997 Total Diet Study – Fluorine, Bromine and Iodine. COT Statement 2000/05. [ARCHIVED CONTENT] COT: The 1997 Total Diet Study - Fluorine, Bromine, and Iodine (July 2000) Accessed: 05/11/2025.
COT. (2001) COT Statement on the reproductive effects of caffeine. COT Statement 2001/06. [ARCHIVED CONTENT] COT: COT statement on the reproductive effects of caffeine Accessed: 05/11/2025.
COT. (2003a) COT Statement on fluorine in the 1997 Total Diet Study. COT Statement 2003/03. [ARCHIVED CONTENT] COT statement on fluorine in the 1997 Total Diet Study | Food Standards Agency Accessed: 05/11/2025.
COT. (2003b) COT Statement on twelve metals and other elements in the 2000 Total Diet Study. COT Statement 2003/07. COT metals statement.doc Accessed: 04/12/2025.
COT. (2008a) Statement on the reproductive effects of caffeine. COT Statement 2008/04. [ARCHIVED CONTENT] COT statement on the reproductive effects of caffeine | Food Standards Agency Accessed: 05/11/2025.
COT. (2008b) COT Statement on Pyrrolizidine Alkaloids in Food. COT Statement 2008/06 October 2008. Microsoft Word - 2008-06 Pyrrolizidine Alkaloids.doc Accessed: 01/10/2025.
COT. (2018) COT Statement on the health effects of manganese in the diets of infants aged 0-12 months and children aged 1-5 years. COT Statement 2018/06. [ARCHIVED CONTENT] Statement on the health effects of manganese in the diets of infants aged 0-12 months and children aged 1-5 years | Food Standards Agency Accessed: 19/12/2025.
COT. (2022) Statement on the potential risks from cadmium in the maternal diet. COT November 2022 Statement Number 05/22. Cadmium in the Maternal Diet - Introduction | Committee on Toxicity Accessed: 07/01/2026.
COT. (2024a) Statement on the potential health effects of raspberry leaf tea in the maternal diet. COT Statement/2024/06. Raspberry leaf tea statement Accessed: 05/11/2025.
COT. (2024b) Statement on the hepatotoxicity of green tea catechins. COT Statement 2024/08. https://doi.org/https://doi.org/10.46756/sci.fsa.wii944.
COT. (2024c) Statement on effects of lead on maternal health. COT Statement Number 03/2024. Statement on the effects of lead on maternal health | Committee on Toxicity Accessed: 07/01/2026.
COT. (2025) Statement on the effects of mercury on maternal health. COT Statement 2025/03. Introduction and Background - Statement on the Effects of Mercury on Maternal Health | Committee on Toxicity Accessed: 18/01/2026.
Dania, S. R., Dewi, Y. L. R. and Pamungkasari, E. P. (2022) Meta Analysis of the Relationship between Tea Drinking Habits and the Incidence of Anemia in Pregnant Women. J Epidemiol Public Health. 07(04): 465-474. https://doi.org/10.26911/jepublichealth.2022.07.04.05.
DEFRA. (2025) Pesticide Residues in Food. Published by: Department for Environment, Food and Rural Affairs Last updated: 17 December 2025. Pesticide Residues in Food - data.gov.uk Accessed: 08/10/2025.
DHSC. (2025) Guidance Chapter 9: Fluoride. Updated 10 September 2025. Chapter 9: fluoride - GOV.UK Accessed: 05/11/2025.
Długaszek, M., Mierczyk, J. and Skrzeczanowski, W. (2025) Assessment of Elements in Black Tea Infusions by Brewing Method in Terms of their Nutritional Value. Biol Trace Elem Res. 2025 Apr 28;203(12):6132–6143. https://doi.org/10.1007/s12011-025-04629-7.
Dong, X., Zhu, B., Zhao, X., Wang, H. and Liu, S. (2023). Transfer rates on nine pesticides from dry tea to infusion by QuEChERS purification followed by LC-MS/MS analysis. International Journal of Environmental Analytical Chemistry, 103(13), 2931–2947. https://doi.org/10.1080/03067319.2021.1900149.
DWI. (undated b) Drinking Water Standards and Regulations. Drinking Water Standards and Regulations - Drinking Water Inspectorate Accessed: 21/11/2025.
EC. (2008) Commission Directive 2008/100/EC amending Council Directive 90/496/EEC on nutrition labelling for foodstuffs as regards recommended daily allowances, energy conversion factors and definitions. Official Journal of the European Union L285: 9–12.
EFSA. (2008) Polycyclic Aromatic Hydrocarbons in Food Scientific Opinion of the Panel on Contaminants in the Food Chain (Question N° EFSA-Q-2007-136) Adopted on 9 June 2008. EFSA Journal (2008) 724, 1-114. https://doi.org/10.2903/j.efsa.2008.724.
EFSA. (2011) Scientific Opinion on Pyrrolizidine alkaloids in food and feed. EFSA Journal Volume 9, Issue 11 November 2011, 2406. https://doi.org/10.2903/j.efsa.2011.2406.
EFSA. (2014) Scientific Opinion on the risks to public health related to the presence of chromium in food and drinking water. EFSA Journal Volume 12, Issue 3 3595. https://doi.org/10.2903/j.efsa.2014.3595.
EFSA. (2016) Dietary exposure assessment to pyrrolizidine alkaloids in the European population. EFSA Journal Volume 14, Issue 8 August 2016 e04572. https://doi.org/10.2903/j.efsa.2016.4572.
EFSA. (2017) Risks for human health related to the presence of pyrrolizidine alkaloids in honey, tea, herbal infusions and food supplements. EFSA Journal Volume 15, Issue 7 July 2017 e04908. https://doi.org/10.2903/j.efsa.2017.4908.
EFSA. (2018) Scientific opinion on the safety of green tea catechins. EFSA J
. 2018 Apr 18;16(4): e05239. https://doi.org/10.2903/j.efsa.2018.5239.
EFSA. (2022a) Statement on the short-term (acute) dietary risk assessment for the temporary maximum residue levels for nicotine in rose hips, teas and capers. EFSA Journal Volume 20, Issue 9 e07566. https://doi.org/10.2903/j.efsa.2022.7566.
EFSA. (2022b) Assessment of the Conclusions of the Joint FAO/WHO Expert Meeting on Tropane Alkaloids. EFSA Journal Volume 20, Issue 4 e07229. https://doi.org/10.2903/j.efsa.2022.7229.
EFSA. (2023) Scientific opinion on the tolerable upper intake level for manganese. EFSA Journal Volume 21, Issue 12 e8413. https://doi.org/10.2903/j.efsa.2023.8413.
Fan, J., Wang, S., Gong, L., Ren, R. and Jin, Q. (2025a) Occurrence, exposure and health risk assessment of heavy metals in green tea samples cultivated in Hangzhou area. Nature Scientific Reports (2025) 15:19405. https://doi.org/10.1038/s41598-024-84287-2.
Fan, Y., Jin, H., Chen, J., Lin, K., Zhu, L., Guo, Y., Ji, J. and Chen, X. (2025b) Neonicotinoid Residues in Tea Products from China: Contamination Patterns and Implications for Human Exposure. Toxics 2025, 13(7), 550. https://doi.org/10.3390/toxics13070550.
FAO and WHO. (2020) Joint FAO/WHO Expert Meeting on Tropane Alkaloids
30 March – 3 April 2020. https://doi.org/10.4060/cb1857en.
Fernandes, I. A. A., Maciel, G. M., Bortolini, D. G., Pedro, A. C., Rubio, F. T. V., de Carvalho, K. Q., Windson, C. and Haminiuk, I. (2023).
The bitter side of teas: Pesticide residues and their impact on human health, Food and Chemical Toxicology, Volume 179, 2023, 113955. https://doi.org/10.1016/j.fct.2023.113955.
FSA. (2000) 1997 Total Diet Study: Fluorine, bromine and iodine. Food Surveillance Sheet No. 5/00.
FSA. (2013) Survey of acrylamide and furan in UK retail products 2011-13. Project code: FS142001. Survey of acrylamide and furan in UK retail products 2011-13 | Food Standards Agency Accessed: 16/10/2025.
FSA. (2014a) Total diet study: metals and other elements. Project code: FS102081. Total diet study: metals and other elements | Food Standards Agency Accessed: 26/08/2025.
FSA. (2014b) Analyses of lead levels in tea. Project code: FS102115. Analyses of lead levels in tea | Food Standards Agency Accessed: 07/01/2026.
FSA. (2014c) Occurrence of Pyrrolizidine Alkaloids in Food. Project code: FS102056. Occurrence of Pyrrolizidine Alkaloids in Food | Food Standards Agency Accessed: 30/05/2025.
FSA. (2014d) Total diet study of inorganic contaminants, acrylamide & mycotoxins. Project code: FS102081. Total diet study of inorganic contaminants, acrylamide & mycotoxins | Food Standards Agency Accessed: 15/10/2025.
FSA. (2015) Occurrence of Polycyclic Aromatic Hydrocarbons in Herbs, Spices, Supplements and Tea. Project code: FS102111. Occurrence of Polycyclic Aromatic Hydrocarbons | Food Standards Agency Accessed: 12/01/2026.
FSA. (2017) Monitoring of tropane alkaloids in foods. Project code: FS102116. Monitoring of tropane alkaloids in food | Food Standards Agency Accessed: 26/08/2025.
FSA. (2018) Survey of acrylamide and furan in UK retail products. Project code: FS102075. Survey of acrylamide and furan in UK retail products | Food Standards Agency Accessed: 15/10/2025.
FSA. (2022) Acrylamide. Acrylamide | Food Standards Agency Accessed: 13/10/2025.
FSA. (2023) Acrylamide and Furans Survey Summary. Project code: FS101229. Acrylamide and Furans Survey Summary | Food Standards Agency Accessed: 06/01/2026.
FSA. (2024) Acrylamide legislation. Acrylamide legislation | Food Standards Agency Accessed: 14/10/2025.
Gustin, K., Barman, M,. Stråvik, M., Levi, M., Englund-Ögge, L., Murray, F., Jacobsson, B., Sandberg, A-S., Sandin, A., Wold, A. E., Vahter, M. and Kippler, M. (2020) Low-level maternal exposure to cadmium, lead, and mercury and birth outcomes in a Swedish prospective birth-cohort. Environmental Pollution Volume 265, Part B, October 2020, 114986. https://doi.org/10.1016/j.envpol.2020.114986.
Han, W-Y., Zhao F-J., Shi, Y-Z., Ma, L-F. and Ruan, J-Y. (2006) Scale and causes of lead contamination in Chinese tea. Environ Pollut. Jan;139(1):125-32. https://doi.org/10.1016/j.envpol.2005.04.025.
Heshmati, A., Mehri, F. and Khaneghah, A. M. (2020) Simultaneous multi-determination of pesticide residues in black tea leaves and infusion: a risk assessment study. Environ Sci Pollut Res 28, pp. 13725–13735 (2021). https://doi.org/10.1007/s11356-020-11658-3.
Hinojosa-Nogueira, D., Bahamonde, J. R., Aguilera-Nieto, M., Navajas-Porras, González-Vigil, V., Rufían-Henares, J. A. and de la Cueva, S. P. (2025) Dietary exposure to food contaminants of pregnant women in Northern Spain and possible effects on fetal anthropometric parameters. Toxics 16;13(5):399. https://doi.org/10.3390/toxics13050399.
HMRC. (2025) HM Revenue and Customs - Find UK trade data from HM Revenue & Customs. UK Trade Info from HM Revenue & Customs Accessed: 08/10/2025.
IARC. (2012) Arsenic, Metals, Fibres, and Dusts IARC Monographs on the Evaluation of Carcinogenic Risks to Humans Volume 100C. ISBN-13
978-92-832-1320-8. IARC Publications Website - Arsenic, Metals, Fibres, and Dusts Accessed. 08/10/2025.
IMFNB. (1997) Institute of Medicine, Food and Nutrition Board. Dietary Reference Intakes for Calcium, Phosphorus, Magnesium, Vitamin D, and Fluoride. Washington, DC: National Academies Press; 1997. https://doi.org/10.17226/5776.
Iqbal, S., Ali, I., Rust, P., Kundi, M. and Ekmekcioglu, C. (2020) Selenium, Zinc, and Manganese Status in Pregnant Women and Its Relation to Maternal and Child Complications. Nutrients. 2020 Mar 10;12(3):725. https://doi.org/10.3390/nu12030725.
Kampouri, M., Gustin, K., Stråvik, M., Barman, M., Levi, M., Daraki, V., Jacobsson, B., Sandin, A., Sandberg, A-S., Wold, A. E., Vahter, M. and Kippler, M. (2022) Association of maternal urinary fluoride concentrations during pregnancy with size at birth and the potential mediation effect by maternal thyroid hormones: The Swedish NICE birth cohort. https://doi.org/10.1016/j.envres.2022.114129.
Karak, T. and Bhagat. R. M. (2010) Trace elements in tea leaves, made tea and tea infusion: A review. Food Research International
Volume 43, Issue 9, November 2010, Pages 2234-2252. https://doi.org/10.1016/j.foodres.2010.08.010.
Khan, N., Mukhtar, H. (2007) Tea polyphenols for health promotion. Life Sciences 81;7 pp.519-533. https://doi.org/10.1016/j.lfs.2007.06.011.
Kohnen-Johannsen, K. and Kayser, O. (2019) Tropane Alkaloids: Chemistry, Pharmacology, Biosynthesis and Production. Molecules. 2019 Feb 22;24(4):796. https://doi.org/10.3390/molecules24040796.
Krishnankutty, N., Storgaard Jensen, T., Kjær, J., Jørgensen, J. S., Nielsen, F. and Grandjean, P. (2022) Public-health risks from tea drinking: Fluoride exposure. Scand J Public Health. 2022 May;50(3):355-361. https://doi.org/10.1177/1403494821990284.
Kyei, N. N. A., Cramer, B., Humpf, H-U., Degen, G. H., Ali, N. And Gabrysch, S. (2022) Assessment of multiple mycotoxin exposure and its association with food consumption: a human biomonitoring study in a pregnant cohort in rural Bangladesh. Arch Toxicol 96, 2123–2138 (2022). https://doi.org/10.1007/s00204-022-03288-0.
Liu, T., Hivert, M-F., Rifas-Shiman, S. L., Rahman, M. L., Oken, E., Cardenas, A. and Mueller, N. T. (2020) Prospective Association Between Manganese in Early Pregnancy and the Risk of Preeclampsia. Epidemiology. 2020 Sep;31(5):677–680. https://doi.org/10.1097/EDE.0000000000001227.
Ma, J., Zhu, Z., Du, S., Zhang, D., Li, X., Zheng, A., Shen, J., Xiao, L., Wu, X., Chen, Y., Ji, J. and Lu, S. (2023) Polycyclic aromatic hydrocarbons in commercial tea from China and implications for human exposure. Journal of Food Composition and Analysis Volume 116, March 2023, 105075. https://doi.org/10.1016/j.jfca.2022.105075.
NCCIH. (2025) National Center for Complementary and Integrative Health – Green Tea. Green Tea: Usefulness and Safety | NCCIH Accessed: 20/11/2025.
NHS. (2020) Others - Vitamins and Minerals. Vitamins and minerals - Others - NHS Accessed: 20/11/2025.
NHS. (2023) Foods to avoid in pregnancy. Foods to avoid in pregnancy - NHS Accessed: 27/01/2025.
Özdemir, Y. and Güçer, S. (1998) Speciation of manganese in tea leaves and tea infusions. Food Chemistry Volume 61, Issue 3, 31 March 1998, pp. 313-317. https://doi.org/10.1016/S0308-8146(97)00071-X.
Pattaravisitsate, n., Phetrak, A., Denpetkul, T., Kittipongvises, S. and Kuroda, K. (2021) Effects of brewing conditions on infusible fluoride levels in tea and herbal products and probabilistic health risk assessment. Scientific Reports volume 11, Article number: 14115 (2021). https://doi.org/10.1038/s41598-021-93548-3.
Podwika, W., Kleszcz, K., Krośniak, M. and Zagrodzki, P. (2017) Copper, Manganese, Zinc, and Cadmium in Tea Leaves of Different Types and Origin. Biol Trace Elem Res 183, 389–395 (2018). https://doi.org/10.1007/s12011-017-1140-x.
PRiF. (2016a) The Expert Committee on Pesticide Residues in Food. Report on the Pesticide Residues Monitoring Programme for Quarter 2 2015. Pesticide Residues Monitoring Programme: Quarter 2 2015 Accessed: 08/01/2026.
PRiF. (2016b) The Expert Committee on Pesticide Residues in Food. Report on the Pesticide Residues Monitoring Programme for Quarter 4 2015. PRiF Results Quarter 4 2015 Accessed: 08/01/2026.
Rai. G. (2025) Multi-elemental Profiling of Temi Tea (Camellia sinensis) from Sikkim by ICPMS. Indian Journal of Ecology (2025) 52(3): 535-539. https://doi.org/10.55362/IJE/2025/4532.
Roberts, C., Steer, T., Maplethorpe, N., Cox, L., Meadows, S., Nicholson, S., Page, P. and Swan, G. (2018) National Diet and Nutrition Survey (NDNS): results from years 7 and 8 (combined) for 2014 to 2015 and 2015 to 2016. Available at: https://www.gov.uk/government/statistics/ndns-results-from-years-7-and-8-combined. Accessed: 05/11/2025.
Ruxton, C. H. S. and Bond, T. J. (2015) Fluoride content of UK retail tea: comparisons between tea bags and infusions. Proceedings of the Nutrition Society. 2015;74(OCE1):E84. https://doi.org/10.1017/S0029665115000993.
SACN. (2011) The influence of maternal, foetal and child nutrition on the development of chronic disease in later life. ISBN: 9780108510649. SACN_Early_Life_Nutrition_Report.pdf Accessed: 08/10/2025.
SACN. (2018) Feeding in the First Year of Life. SACN_report_on_Feeding_in_the_First_Year_of_Life.pdf Accessed: 08/10/2025.
Sedova, I., Kiseleva, M. and Tutelyan, V. (2018) Mycotoxins in Tea: Occurrence, Methods of Determination and Risk Evaluation. Toxins (Basel). 2018 Oct 30;10(11):444. https://doi.org/10.3390/toxins10110444.
Shah, T., Shaikh, F., Ansari, S., Shaikh, S., Mehar, B. and Zareen, R. (2022) Heavy Metals in Tea and Their Adverse Effects on Mother and Fetal Outcome. Journal of Hunan University (Natural Sciences) 49, 10 pp. 105-112. https://doi.org/10.55463/issn.1674-2974.49.10.12.
Sonnenburg, A., Batke, M., Damm, G., Foth, H., Freyberger, A., Hengstler, J. G., Mangerich, A., Partosch, F., Schupp, Th., Wollin, K-M, Brocke, J. V. and Gundert-Remy, U. (2025) Fluoride intake during pregnancy: calculation of realistic exposure scenarios for individual risk assessment. Arch Toxicol. 2025 Dec;99(12):4931-4940. https://doi.org/10.1007/s00204-025-04143-8.
Tagne-Fotso, R., Leroyer, A., Howsam, M., Dehon, B., Richeval, C. and Nisse, C. (2016) Current sources of lead exposure and their relative contributions to the blood lead levels in the general adult population of Northern France: The IMEPOGE Study, 2008–2010. Journal of Toxicology and Environmental Health, Part A, 79(6), 245–265. https://doi.org/10.1080/15287394.2016.1149131.
Tao, N. Y. and Mai, T. T. (2017) Determination of metal content in tea leaves grown in Yen Bai and Tuyen Quang Province, Vietnam. Vietnam Journal of Science and Technology 55 (5A):143.
UKHSA. (2022) Guidance Chromium: general information. Updated 24 May 2022. Chromium: general information - GOV.UK Accessed: 09/01/2026.
UKHSA. (2024) Guidance Manganese: general information. Updated 4 December 20254. Manganese: general information - GOV.UK. Accessed: 20/11/2025.
US NIH ODS. (2025) Fluoride Fact Sheet for Health Professionals. Updated: April 11, 2025. Fluoride - Health Professional Fact Sheet Accessed: 05/11/2025.
US NTP. (2003) Toxicology and carcinogenesis studies of riddelliine (CAS No. 23246-96-0) in F344/N rats and B6C3F1 mice (gavage studies). May 2003. NTP Technical Report 508. NIH Publication No. 03-4442. TR-508: Riddelliine (CASRN 23246-96-0) in F344/N Rats and B6C3F1 Mice (Gavage Studies) Accessed: 15/10/2025.
Walters, C. B., Sherlock, J. C., Evans, W. H. and Read, J. I. (1983) Dietary Intake of Fluoride in the United Kingdom and Fluoride Content of Some Foodstuffs. Journal of the Science of Food and Agriculture 34;5 May 1983 pp. 523-528. https://doi.org/10.1002/jsfa.2740340514.
Wennberg, M., Lundh, T., Sommar, J. N. And Bergdahl, I. A. (2017) Time trends and exposure determinants of lead and cadmium in the adult
population of northern Sweden 1990–2014. Environmental Research 159 (2017) 111–117. https://doi.org/10.1016/j.envres.2017.07.029.
WHO. (2021) Manganese in drinking-water. WHO/HEP/ECH/WSH/2021.5. Manganese in drinking-water Accessed: 12/01/2025.
WHO, (2022) Guidelines for drinking-water quality: fourth edition incorporating the first and second addenda. pp. 420-423. ISBN: 978-92-4-004506-4. Guidelines for drinking-water quality: fourth edition incorporating the first and second addenda Accessed: 21/01/2026.
WHO. (2023) Mycotoxins. Mycotoxins Accessed: 08/01/2026.
Yazdy, M., Tinker, S. C., Mitchell, A. A., Demmer, L. A. and Werler, M. M. (2015) Maternal Tea Consumption during Early Pregnancy and the Risk of Spina Bifida. Birth Defects Res A Clin Mol Teratol. 2012 May 29;94(10):756–761. https://doi.org/10.1002/bdra.23025.
Ye, R., Ren, A., Zhang, L., Li, Z., Liu, J., Pei, L. and Zheng, X. (2011) Tea Drinking as a Risk Factor for Neural Tube Defects in Northern China. Epidemiology 22(4):p 491-496, July 2011. https://doi.org/10.1097/ede.0b013e31821b4526.
Zhang, X., Zhang, L., Zhou, T. and Zhou, Y. (2022) Fungal flora and mycotoxin contamination in tea: Current status, detection methods and dietary risk assessment - A comprehensive review. Trends in Food Science & Technology 127, pp. 207-220. https://doi.org/10.1016/j.tifs.2022.05.019.
Zhou, H., Liu, Y., Wu. Q., Zhang, X., Wang, H. And Lei, P. (2024) The manufacturing process provides green teas with differentiated nonvolatile profiles and influences the deterioration of flavor during storage at room temperature. Food Chemistry: X Volume 22, 30 June 2024, 101371. https://doi.org/10.1016/j.fochx.2024.101371.
Annex A TOX/2026/05
In this guide
In this guideThis is a paper for discussion. It does not reflect the views of the Committee and should not be cited.
Details of literature search carried out by the Secretariat at the Food Standards Agency (FSA)
The following search strings were used in Science Direct, PubMed and, Google Scholar:
“maternal” AND “tea” AND “toxicity” NOT “caffeine”
"tea" AND "mycotoxin" AND "maternal"
“tea” AND “pesticide” AND “maternal”
Additional ad hoc searches were carried out as considered appropriate.