Discussion paper on existing health-based guidance values (HBGVs) for T2 & HT2 mycotoxins
On this page
Skip the menu of subheadings on this page.This is a paper for discussion.
This does not represent the views of the Committee and should not be cited.
Background
1. The Committee on Toxicity of Chemicals in Food, Consumer Products and the Environment (COT) last assessed the mycotoxins T-2 (T2) and HT-2 (HT2) when reviewing the diet of infants aged 0 to 12 months and young children aged 1 to 5 years (COT, 2018). At the time, the COT agreed with EFSA’s group ARfD and group TDI for T2 and HT2 which EFSA had established in 2017.
2. The COT published a further statement on the potential risk(s) of combined exposure to mycotoxins in 2021, however, the Committee were unable to conclude on the potential risk(s) from combined exposure to mycotoxins mostly due to a lack of UK occurrence data (COT, 2021).
3. Commission Recommendation 2013/165/EU sets out indicative levels for T2/HT2 in a number of food commodities. However, the European Commission has proposed to replace these current indicative values with legislative limits for T2/HT2 in the EU. The proposed legislative limits are much lower that the pre-existing indicative values (Tables 1-2). This has caused concern regarding the potential impacts for UK industry, especially for UK cereals.
4. It should be noted that the proposed levels are draft ones and therefore subject to change.
Table 1: Pre-existing indicative values for T2 & HT2 in cereals and cereal products (2013/165/EU).
|
Entry |
Foodstuff |
Current indicative levels for sum of T2 & HT2 (µg/kg) |
|
1 |
Unprocessed cereals |
n/a |
|
1.1 |
barley (including malting barley) and maize |
200 |
|
1.2 |
Oats (with husk) |
1000 |
|
1.3 |
Wheat, rye and other cereals |
100 |
|
2 |
Cereal grains for direct human consumption |
n/a |
|
2.1 |
oats |
200 |
|
2.2 |
maize |
100 |
|
2.3 |
other cereals |
50 |
|
3 |
Cereal products for human consumption |
n/a |
|
3.1 |
Oat bran and flaked oats |
200 |
|
3.2 |
cereal bran except oat bran, oat milling products other than oat bran and flaked oats, and maize milling products |
100 |
|
3.3 |
other cereal milling products |
50 |
|
3.4 |
breakfast cereals including formed cereal flakes |
75 |
|
3.5 |
bread (including small bakery wares), pastries, biscuits, cereal snacks, pasta |
25 |
|
3.6 |
cereal-based foods for infants and young children |
15 |
|
4 |
Cereal products for feed and compound feed |
n/a |
|
4.1 |
oat milling products (husks) |
2000 |
|
4.2 |
other cereal products |
500 |
|
4.3 |
compound feed, with the exception of feed for cats |
250 |
Table 2: Proposed maximum levels for sum of T2 & HT2 in food (Annex to Regulation (EC) No 1881/2006, section 2 (entry 2.7))
|
Entry |
Foodstuff |
Proposed maximum level for sum of T2 & HT2 (µg/kg) |
|
2.7.1 |
Unprocessed cereals |
n/a |
|
2.7.1 |
Barley, maize, and durum wheat with the exception of unprocessed maize intended to be processed by wet milling |
100 |
|
2.7.1 |
Oats |
1250 |
|
2.7.1 |
Other cereals |
50 |
|
2.7.2 |
Cereals placed on the market for the final consumer |
n/a |
|
2.7.2 |
Oats, barley, maize and durum wheat |
50 |
|
2.7.2 |
Other cereals |
20 |
|
2.7.3 |
Cereal milling products |
n/a |
|
2.7.3 |
Cereal bran, oat milling products (including oat flakes) and maize milling products |
50 |
|
2.7.3 |
Other cereal milling products |
20 |
|
2.7.4 |
Breakfast cereals composed of at least 75% of cereal bran, oat milling products, maize milling products and/or while grains of oats, barley, maize and durum wheat |
50 |
|
2.7.5 |
Bakery wares, pasta (dry), cereal snacks, and breakfast cereals other than those referred to in 2.7.4 |
20 |
|
2.7.6 |
Processed cereal-based foods for infants and young children and baby foods |
10 |
|
2.7.7 |
Dietary foods for special medical purposes intended for infants and young children |
10 |
5. Currently there is no retained EU law covering T2 and/or HT2. However, the FSA has had extensive dialogue with industry, and has previous been involved in EU working groups on the development of appropriate maximum levels.
6. EU Food Law continues to apply in Northern Ireland under the current terms of the Protocol on Ireland/Northern Ireland. Therefore, any decisions made by the EU will be applicable in Northern Ireland.
7. The FSA intends to assess the level of risk from dietary exposure to T2/HT2 for UK consumers through a call for UK occurrence data. The focus of the problem formulation statement is on T2 and HT2. The FSA Policy team has not asked the Secretariat to look at neosolaniol (NEO) and 4,15-diacetoxyscirpenol (DAS) due to the limited data available for these compounds. The COT and EFSA have also previously stated that there is limited information on NEO/DAS, and it is insufficient to perform an exposure assessment and the available data were inconclusive. Therefore, NEO and DAS have not been included in this discussion paper; however, as part of the full risk assessment that will be conducted later in the year, the FSA Secretariat will review the scientific literature to assess whether any additional information has been published. As part of this work, the FSA would like the COT to consider the existing health based guidance values (HBGVs) for T2/ HT2 published by the European Food Safety Authority (EFSA) and the Joint FAO/WHO Expert Committee on Food Additives (JECFA), and to agree a HBGV for FSA risk assessments going forward.
Introduction
8. T2 and HT2 are type A trichothecenes and are produced by a variety of Fusarium and other fungal species. Fusarium species grow and invade crops and produce T2 and HT2 under cool, moist conditions prior to harvest. T2 and HT2 are found predominantly in cereal grains (particularly oats) and their products. NEO is a hydrolytic phase I metabolite of T2 and may be formed in fungi and mammals. NEO has been found in some brewed coffee samples, in a sample of cereal-containing baby food and at trace levels in some barley field malt samples. The major metabolic pathway of T2, regardless of the animal species, is rapid deacetylation at the fourth carbon position resulting in the formation of HT2 (Nathanail et al. 2015). Hence, HT2 is produced by Fusarium and other fungal species, and it is a metabolite of T2.
9. T2 and HT2 have previously been assessed by the COT in 2018 and 2021 (in reviewing the diet of infants and young children and combine mycotoxin exposure), by JECFA in 2002, 2016, and 2022, the Scientific Committee on Food (SCF) in 2002 and EFSA in 2011 and 2017.
10. There are currently no maximum levels agreed at CODEX for T2 and HT2. This is pending publication of JECFA’s full report and toxicological monograph; currently only the summary and conclusions are available (JECFA, 2022).
11. The chemical structures of T2 and HT2 are shown below in Figure 1.
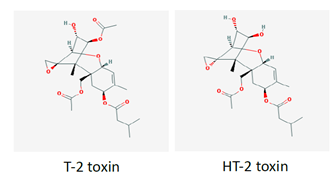
This image is black, grey and red, there are 2 images making up 1 figure. On the left is a chemical structure of T-2 toxina and on the right is the chemical structure of HT-2 toxin.
Figure 1. Chemical structures of T2 and HT2.
Toxicokinetics
12. The toxicokinetics of T2 and HT2 have been reviewed previously by JECFA (2001) and EFSA (2017a).
13. In summary, there is very little information on the in vivo absorption of T2 and HT2 in animals after oral administration. However, 40 to 57% of radioactivity was found in bile and blood in studies in which tritiated T2 was administered directly into the small intestine of male rats. Only low amounts of T2 were observed in these studies, suggesting extensive hydrolysis to HT2 and other metabolites during the rapid intestinal absorption of T2 (EFSA, 2017a).
14. Rapid absorption has been confirmed by the excretion of total radioactivity in rats within 48 hours after oral gavage. T2 radioactivity was rapidly distributed to the liver, kidney and other organs without accumulation in any organ in orally dosed rats and mice. (EFSA, 2017a). The metabolism of T2 and HT2 in humans and other species is complex and was reviewed by EFSA (2011). Phase I metabolites arise from either hydrolysis of ester group, hydroxylation, or de-epoxidation. These reactions may also occur in combination. Glucuronides are the most prevalent mammalian phase II metabolites of T2 and HT2 (EFSA, 2017a).
Toxicity
15. The toxicity of T2 and HT2 has been reviewed previously by EFSA (2011, 2017), JECFA (2002, 2016, 2022) and the SCF (2002). All Committees agreed that these trichothecenes were haematotoxic, immunotoxic and caused reduced body weight, and emesis. These effects occurred at lower doses than other toxic effects such as dermal toxicity, developmental and reproductive toxicity, and neurotoxicity. Haematotoxicity was the critical chronic effect of T2; the underlying mode of action is the inhibition of protein synthesis, the induction of ribotoxic stress and apoptosis. Mink and pigs have been identified as the most sensitive species to the toxic effects of trichothecenes.
HBGV’s established by the SCF, JECFA, and EFSA
SCF
SCF’s tTDI
16. In 2002, the SCF used the haematotoxicity and immunotoxicity of T2 demonstrated in a short-term study in pigs (Rafai et al. 1995a) as the basis for the risk assessment (SCF, 2002).
17. In this subacute study conducted by Rafai et al. (1995a), four groups of seven-week-old pigs weighing about 9 kg were fed for three weeks a pre-starter that contained 0.5, 1.0, 2.0 or 3.0 mg/kg of highly purified T2 toxin. The experimental and control pigs were immunised with 5 ml aluminium hydroxide gel-absorbed purified horse globulin on the first and fourth days of the treatment period. Blood samples were withdrawn on days 7, 14 and 21 and used for the determination of the titre of anti-horse globulin antibody, for an in vitro lymphocyte proliferation test, using purified horse globulin, phytohaemagglutinin and concanavalin-A and for determinations of the immune complex, the cytotoxic reaction and the phagocytic activity and phagocytic index of circulating granulocytes. The samples taken on day 21 were also used to determine the erythrocyte count, the mean cell volume of the erythrocytes, the haematocrit, the blood haemoglobin concentration, the leucocyte count and the proportion of T lymphocytes. At the end of the study samples were taken from the thymus, spleen and mesenteric lymph nodes for histological examination. The diets that contained 2 or 3 mg T-2 toxin/kg caused a significant decrease in the red blood cell count, the mean corpuscular volume and the haemoglobin concentration. A significant decrease in the leucocyte count and the proportion of T lymphocytes was observed in all the treatment groups. There were also dose-dependent, significant decreases in antibody formation and in the blastogenic transformation of lymphocytes, and mild to moderate reactive processes were observed histologically in the lymphoid organs.
18. The SCF used leukopenia/reduced antibody production as the critical effect of T2 exposure, with a lowest observed adverse effect level (LOAEL) of 0.03 mg T2/kg bw/day. An uncertainty factor of 500 was applied to this LOAEL for the derivation of a temporary tolerable daily intake (tTDI) of 0.06 μg/kg bw (60 ng/kg bw). The SCF concluded that the toxicity of T2 in vivo may be partly attributed to HT2, hence it was appropriate to establish a combined tTDI for the sum of T2 and HT2 (SCF, 2002).
JECFA
JECFA’s group ARfD
19. In April 2022, JECFA published their summary and conclusions on the safety of T2, HT2 and DAS (JECFA, 2022); the full toxicological monograph has not yet been published.
20. The Committee agreed that emesis is a common effect of acute trichothecene exposure in both humans and experimental animals. On this basis, the Committee established a group ARfD for T-2, HT-2 and DAS. While JECFA found limited evidence that DAS is regularly detected as a co-contaminant with T2/HT2, recent acute data indicated that DAS exhibits similar effects in mink, via a similar mode of action to T2/HT2, but at lower potency. JECFA applied the lower 95% confidence limit on the benchmark dose for a 10% response (BMDL10) of 2.6 μg/kg bw for emesis in mink following acute gavage exposure to T2 or HT2 as the point of departure. Based on the available evidence, the Committee decided that an uncertainty factor of 8 (2.5 for interspecies variability in toxicodynamics and 3.16 for intra-human variability in toxicodynamics) was sufficiently protective on the basis that:
- the mechanisms for emesis in mink are likely to be similar to the mechanisms for emesis in humans (for example, activation of receptors in both the gastrointestinal tract and central nervous system);
- the speed to onset (approximately 30 minutes) and the duration of T-2- and HT-2-induced emesis is proportional to the administered dose suggesting that it is likely to be dependent on the maximum (or peak) concentration in serum or plasma (Cmax) rather than area under the concentration–time curve; and,
- the point of departure is based on a gavage study where higher Cmax are expected compared with equivalent dietary exposures.
21. Based on the above, JECFA established a group ARfD for T2, HT2 and DAS of 320 ng/kg bw (rounded down). Considering the highly comparable nature of the methods used in studies concerning the emetic effects of T2, HT2 and DAS in mink, the Committee recommended a relative potency factor of 0.2 for acute exposure to DAS.
JECFA’s group TDI
22. JECFA (2002) concluded that immunotoxicity and haematotoxicity were the critical effects of T2 after short-term intake. JECFA used the lowest observed effect level (LOEL) of 29 μg/kg bw/day for changes in red and white blood cell counts identified in the studies by Rafai (1995a, b) and applied an uncertainty factor of 500 to establish a provisional maximum tolerable daily intake (PMTDI) for T2 of 60 ng/kg bw. HT2 was included in the PMTDI, which resulted in a group PMTDI of 60 ng/kg bw for T2 and HT2, alone or in combination.
23. At the eighty-third JECFA meeting (2016), the Committee included DAS in the group PMTDI of 60 ng/kg bw per day for T2, HT2 and DAS toxins, alone or in combination.
24. In April 2022, JECFA published their summary and conclusions on the safety of T2, HT2 and DAS (JECFA, 2022); the full toxicological monograph has not yet been published. From the currently published information, JECFA established a group TDI of 25 ng/kg bw for T2, HT2 and DAS, alone or in combination. The previous group PMTDI of 60 ng/kg bw withdrawn.
25. In establishing the new group TDI of 25 ng/kg bw, JECFA concluded that the most sensitive, reliable and reproducible effects observed following repeated dietary exposure were reported in the 3-week toxicity study in juvenile pigs. This study adequately characterised the test material and background exposure to common mycotoxins detected in feed and examined critical toxicological effects at relatively low doses (for example, <25 µg/kg bw per day). JECFA also noted that juvenile pigs have been identified previously as a species sensitive to the emetic and haematotoxic effects of trichothecenes. Dose-response analysis of body weights, daily body weight gain and daily feed intake was conducted, and a BMDL10 of 1.8 µg/kg bw per day based on reduced daily body weight gain was selected as the most appropriate point of departure for establishing a group TDI. Considering that the critical effect (i.e. nausea-induced reductions in feed intake resulting in decreased body weight gain) is likely to be Cmax-dependent, and given JECFA’s low confidence in the overall toxicological database, a composite uncertainty factor of 72 was considered appropriate (eightfold for the group HBGV, threefold for extrapolation from subacute to chronic exposure, and threefold for other uncertainties in the database).
26. Although comparative longer-term data on T2, HT2 and DAS are not available, JECFA concluded that the relative potency factor of 0.2 for DAS was applicable for exposure durations longer than acute, (due to the similar critical effects observed following acute and repeated oral exposures), and hence should be applied in comparing dietary exposure to DAS with the group TDI.
EFSA
EFSA’s group ARfD
27. The lowest dose at which acute effects were seen was in mink in a study by Wu et al. (2016) and the ED50 (dose causing emesis in 50% of the treated animals) obtained was 1030 μg/kg bw via the oral route. The mink, in lieu of the ferret (which is more expensive and difficult to raise), has been suggested as the model species for emesis in drug testing (Gordon, 1985; Zhang et al., 2006; Percie du Sert et al., 2012) and EFSA therefore concluded that the mink was an appropriate animal model for vomiting in humans (EFSA, 2017a).
28. In the study conducted by Wu et al. (2016), groups of fasted female mink (n = 4) were given 50 g of feed 30 minutes prior to either a) i.p. administration of 0, 0.001, 0.01, 0.05 or 0.25 mg/kg bw of T2 or HT2 or 0, 0.5, 1, 2.5 or 5 mg/kg bw emetine (positive control), or b) administration by oral gavage of 0, 0.005, 0.05, 0.25 or 0.5 mg/kg bw T2 or HT2 or 0, 0.5, 1, 2.5 or 5 mg/kg bw emetine. The animals were then monitored for emetic events for six hours (an emetic event was classed as either vomiting or retching; according to Wu et al. (2016) vomiting is rhythmic abdominal contraction with oral expulsion of either solid or liquid material; retching is a response which mimics vomiting but without the expulsion of any material). In a second study, 3 groups of fasted female mink (n = 4) were given 50 g of feed 30 minutes prior to 0.5 mg/kg bw T2 or HT2 or 5 mg/kg bw emetine by oral gavage. Emetic events were recorded for up to 2 hours and levels of plasma satiety hormone peptide YY3-36 (PYY3-36) and 5-hydroxytryptamine (5-HT) (hormones known to be implicated in emesis) measured. The lowest dose at which emetic events were observed after i.p. administration was 0.05 mg/kg bw for T2 and HT2 and 25% of animals were affected for each. After oral exposure, the lowest dose at which emetic events occurred was 0.05 mg/kg bw and 75% of animals were affected for both T2 and HT2. At 0.25 mg/kg bw 4 animals (100%) were affected for both T2 and HT2 via i.p. and oral administration. The lowest doses at which emetic events occurred in animals dosed with emetine was 2.5 (50%) and 1 mg/kg bw (50%) for i.p. and oral administration routes, respectively. The latency of emetic events decreased while duration and frequency of emetic events increased with dose. Oral administration of T2 and HT2 caused increases in plasma concentrations of PYY3-36 and 5-HT. The study authors concluded that via the oral route the NOAELs were 5 μg/kg bw, LOAELs were 50 μg/kg bw and ED50s were 20 μg/kg bw for both T2 and HT2.
29. EFSA used the Wu et al. (2016) study for their benchmark dose (BMD) analysis (using PROAST software version 38.9) as the basis for an ARfD and selected a benchmark response of 10%. EFSA combined the results from 2 independent experiments on T2 and HT2 and the experiments were considered as a covariate.
30. Until recently, performing model averaging using the PROAST software was not possible. The overall BMDL - BMDU range therefore was 2.97 – 49.8 μg/kg bw (when considering all models with AIC ≤ AICmin +2) and, following their own guidance (EFSA, 2017b), EFSA selected a BMDL10 of 2.97 μg/kg bw for further consideration, as this was the lowest valid BMDL10. EFSA noted that there was considerable uncertainty associated with the BMDL calculation due to the large dose spacing at the lower doses and the small number of animals used.
31. An uncertainty factor of 10 for intraspecies variability was applied to the BMDL10 of 2.97 μg/kg bw derived for emetic response in mink, resulting in a group ARfD of 0.3 μg/kg bw for T2 and HT2. No interspecies uncertainty factor was applied because humans were not considered more sensitive than mink to acute emetic effects. This was based on observations with emetine (an ipecacuanha alkaloid), which induces vomiting in humans and minks at the same effective dose. Hence, it was assumed that this would also be the case for T2 and HT2. NEO was equipotent to T2 and HT2 when tested for vomiting in ducklings (Ueno et al., 1974) and was therefore included together with T2 and HT2 in this group ARfD (EFSA, 2017a). Dose additivity of T2 and HT2 and their modified forms was assumed, although EFSA noted that, antagonistic or less likely, synergistic, effects of their co-exposure cannot be excluded in principle.
32. In 2018, the COT accepted the group ARfD for T2 and HT2 established by EFSA, with the following caveats:
i. The AIC values for all the models, except the Two-stage model, fell within the EFSA acceptance criterion (AIC ≤ AICmin +2), however, the BMDU/BMDL ratio is quite large, generally >10-fold.
ii. The COT considered that the lack of an interspecies uncertainty factor might be justifiable for the toxicodynamic component (similar sensitivity to emetine) but there was some concern as to whether the toxicokinetic differences would be accounted for (potential differences in the toxicokinetics of the toxins as compared with emetine).
iii. The Wu et al. (2016) study used only female minks and there did not appear to be any consideration by EFSA as to how suitable this was as a model.
33. Using a very recent update to the PROAST software, it was possible to perform model averaging on the Wu et al. (2016) data. This resulted in a model averaged BMDL10 of 12.2 μg/kg bw, approximately 4-fold greater than the BMDL10 used by EFSA to establish the ARfD. The COT was uncertain as to the current validation status of the model averaging function of the PROAST software. Hence, the Committee continued to apply the ARfD established by EFSA, acknowledging that given the uncertainties of model averaging the EFSA ARfD was more conservative.
EFSA’s group TDI
34. In 2011, EFSA performed a BMD analysis on the specific antibody response (anti-horse globulin) detected in a studies conducted by Rafai et al. (1995a; described above), and Rafai et al. (1995b; described below), using the PROAST software (version 26.0 under R 2.10.2) (EFSA, 2011b). Due to the rapid metabolism of T2 to HT2 (and the fact that T2 toxicity may in part be due to HT2), EFSA decided to establish a group TDI for the sum of T2 and HT2.
20. The methods in the study of Rafai et al. (1995b) were as described above for Rafai et al. (1995a). In addition, on the 1st and 4th days control and dosed pigs were immunised intramuscularly with 5 ml of purified horse globulin adsorbed in aluminium hydroxide gel. Blood samples were withdrawn from the vena cava cranialis before the 1st immunisation and then after 7, 14 and 21 days. Significant decreases in red blood cell (RBC) count and the haematocrit were observed in pigs with diets containing 105 and 129 µg T2/kg bw/day. Leucocyte numbers and haemoglobin (Hb) decreased as the T2 toxin concentration increased. In general, the humoral immune response of pigs dosed with T2 toxin was significantly reduced compared to control animals. Lymphocyte stimulation by homologous antigen, phytohaemagglutinin A (PHA) and concanavalin A (Con A) decreased by varying degrees by the diets containing T2 toxin. Histological changes were observed in the thymus, spleen and lymph nodes. (Rafai et al.,1995b).
35. EFSA used the BMDL05 of 10 μg/kg bw/day for T2 toxin as a point of departure and applied the default uncertainty factor of 100 to establish a TDI of 100 ng/kg bw for the sum of T2 and HT2. (NB. the default value for continuous data recommended by EFSA is a benchmark response of 5%; the BMDL05 is the 95% lower confidence limit for the benchmark dose response of 5%).
36. Since 2011 however, several subacute and subchronic toxicity studies on T2 were published, including a 90-day rat study conducted by Rahman et al. (2014).
37. In the study by Rahman et al. (2014), 192 male Wistar rats were assigned to 4 groups (n = 48) and dosed with 0, 0.5, 0.75 or 1.0 mg T2/kg (ppm) (equivalent to 0, 45, 68 and 90 µg T2/kg bw/day, respectively) daily via the diet for 12 weeks. Eight animals each were sacrificed at 2, 4, 6, 8, 10 and 12 weeks. Rats dosed with T2 toxin showed varying degrees of clinical signs, including dullness, weakness, lethargy, growth retardation, reduced feed intake, reluctance to move and rough hair coat, which worsened over time in groups 68 or 90 µg/kg bw/day. Rats treated with 90 µg/kg bw/day showed gangrenous dermatitis of tail (15/24) at 8th week, and facial and podal dermatitis after the 10th week. A statistically significant dose dependent decrease in bodyweights was seen after 90 days of dosing. Mean body weights were 264, 219, 184 and 160 g for rats dosed with 0, 45, 68 and 90 µg/kg bw/day, respectively. Significant decreases in haemoglobin (Hb), packed cell volume (PCV), total erythrocyte count (TEC), total thrombocytes count (TTC), total leucocyte count (TLC), mean corpuscular volume (MCV), mean corpuscular Hb (MCHb), and percentages of lymphocytes were observed but the percentage of neutrophils increased. Generally, all of these observations became more pronounced with study length, with no sign of reaching a plateau at the end. After 90 days of feeding mean TECs were 8.97, 5.85, 5.77 and 4.65 x10⁶ /µl in rats fed 0, 45, 68 and 90 µg/kg bw/day, respectively; mean TLCs were 14.83, 8.95, 6.92 and 5.20 x10³ /µl in animals dosed with 0, 45, 68 and 90 µg/kg bw/day, respectively; mean TTCs were 122.5, 77.7, 56.5 and 38.0 x10³ /µl in animals fed 0, 45, 68 and 90 µg/kg bw/day. The study authors concluded that T2 induces microcytic hypochromic anaemia, leukocytopaenia (due to lymphocytopaenia) and thrombocytopaenia in rats which increased with dose and duration of exposure.
38. EFSA (2017a) noted that the effects observed (i.e. anorectic effects and effects on immune system and blood parameters) in the Rahman et al. (2014) rat study were similar to those seen in the pig study, confirming the immune system and blood cell production as targets of T2 across species. EFSA also noted that the exposure duration to T2 in the study of Rahman et al. (90 days) was longer than in the Rafai et al. (1995a, b) studies in pigs - not only in absolute terms, but also as a proportion of species lifetime.
39. Therefore, EFSA decided, considering the longer exposure duration in the study by Rahman et al. (2014) and its biological relevance, to apply the total leucocyte counts reported by Rahman et al. (2014) for the derivation of a new BMD for T2. EFSA did not identify a NOAEL, but considered the lowest dose tested (45 μg T2/kg bw/day) to be a LOAEL (EFSA, 2017a). EFSA used a benchmark response (BMR) of 10%, considering such a response in leucocyte counts to be within the individual physiological variation and negligible, and further noted that the selected BMR is slightly below the control standard deviation of the controls in the Rahman et al. study (14%).
40. The overall BMDL - BMDU range was 3.30 - 27.60 μg/kg bw (when considering all models with AIC ≤ AICmin +2). A 95% lower confidence limit for the benchmark dose response (BMDL10) of 3.3 μg T2/kg bw was used as a reference point for establishing a chronic TDI for T2 and HT2 as it was the lowest valid BMDL10.
41. To this value, an uncertainty factor of 200 was applied: a factor of 10 for interspecies variability, 10 for intraspecies variability and 2 for extrapolation from subchronic to chronic exposure duration and for the progression of the toxic effect through the duration of the study with no signs of reaching a plateau at the end. EFSA thus established a TDI of 0.02 μg T2/kg bw.
42. Based on HT2’s similar acute toxicity profile and potency, structural similarity to T2 (and the fact that HT2 is an immediate metabolite of T2), and in agreement with their previous assessment in 2011, EFSA concluded that T2 and HT2 should be included in a group TDI with the same potency.
43. EFSA noted that no in vivo studies on the haematotoxicity of modified forms of T2 and HT2 could be identified. However, as some phase I metabolites have shown to cause protein synthesis inhibition, they may work via a similar mode of action and as such induce haematotoxicity. EFSA therefore considered it appropriate to include such metabolites in a group TDI, assuming dose addition as a model of joint action. Because potencies of phase I metabolites differ with respect to inhibition of protein synthesis and other toxic effects, EFSA decided to assign relative potency factors (RPFs), on a molar basis.
44. When assigning potency factors to the phase I metabolites EFSA used in vivo and in vitro studies on comparative toxicity. EFSA noted that none of the phase I metabolites were more potent than T2 or HT2. Since in vitro test systems may have a limited capacity for detoxification, results would in general overestimate the toxicity of T2 compared to that in vivo. Therefore in vivo data were used preferentially. When there were different values for relative potencies for the same metabolite, EFSA used the highest potency so that relative toxicity was not underestimated. EFSA rounded the RPFs to half orders of magnitude to avoid spurious accuracy whilst retaining a conservative approach. The relative potency factors (RPFs) calculated for T2, HT2 and NEO were 1, 1 and 0.3, respectively (EFSA, 2017a).
45. EFSA noted that the test compound in the study used to determine the group TDI for T2, HT2, and NEO was purified from fungal culture material and its purity was not specified; therefore, EFSA could not exclude the possibility that minor amounts of other mycotoxins (including modified forms) were present. Furthermore, EFSA noted there was uncertainty associated with using a subchronic study to establish a chronic HBGV. Additionally, there were no repeated dose studies available for HT2 which has been included in the group TDI with T2, based on similar acute toxicity profile and potency, structural similarity and because HT2 is an immediate metabolite of T2.
46. In 2018, in reviewing the diet of infants and young children, the COT agreed with EFSA’s group TDI of 0.02 μg/kg bw for T2, HT2 and NEO which EFSA established in 2017 (COT, 2018).
Conclusions/Discussion
47. T2, and HT2 are type A trichothecenes; with HT2 also being a metabolite of T2. These mycotoxins are produced by a variety of Fusarium species, which grow in crops under cool and moist conditions prior to harvest. T2 and HT2 are found predominantly in cereal grains (particularly oats) and their products.
48. There is very little information on the in vivo absorption of T2 and HT2 in animals after oral administration. However, following absorption, T2 is rapidly and extensively hydrolysed to HT2 and other metabolites, which are rapidly distributed to organs such as the liver, and ultimately excreted.
49. The toxicity of T2 and HT2 has been reviewed by numerous authorities and Committees, i.e EFSA (2011, 2017), JEFCA (2002, 2016, 2022), and the SCF (2002).
50. HBGVs were established for T2 and HT2 by JECFA, SCF and EFSA. In 2002, the SCF established a tTDI of 0.06 μg/kg bw for the sum of T2 and HT2. In 2017, EFSA established a group ARfD of 0.3 μg/kg bw for T2, HT2 and NEO and a group TDI of 0.02 μg/kg bw for T2 (x 1), HT2 (x 1) and NEO (x 0.3). In 2022, JECFA established a group ARfD for T2, HT2 and DAS of 0.32 µg/kg bw and also a group TDI of 0.025 µg/kg bw for T2, HT2 and DAS, alone or in combination (full report has yet to be published).
51. The COT previously agreed with EFSA’s group ARfD of 0.3 μg/kg bw from 2017, with some caveats and EFSA’s group TDI of 0.02 μg/kg bw for T2, HT2 and NEO.
52. The COT has not yet seen or commented on the full JECFA 2022 evaluation, as it is still awaiting publication. However, the HBGVs by JECFA are broadly in line with EFSAs HBGVs from 2017.
Questions on which the views of the Committee are sought
53. Members are invited to consider the following questions
i) Does the Committee agree with the evaluations by JECFA and EFSA and their derivation of the HBGVs?
ii) Does the Committee want to highlight any further uncertainties associated with EFSA HBGVs (i.e. beyond those described in paragraph 44)?
iii) Are the Committee content to continue to use EFSA’s HBGVs for future risk assessments?
iv) Does the Committee have any other comments?
Secretariat
January 2023
Abbreviations
|
5-HT |
5-hydroxytryptamine |
|
ARfD |
acute reference dose |
|
BMD |
benchmark dose |
|
BMDL |
95 % lower confidence limit for benchmark dose |
|
BMR |
benchmark response |
|
bw |
bodyweight |
|
DH |
Department of Health |
|
DNA |
deoxyribonucleic acid |
|
DNSIYC |
Diet and Nutrition Survey in Infants and Young Children |
|
ED50 |
dose causing emesis in 50 % of animals tested |
|
EFSA |
European Food Safety Authority |
|
FAO |
Food and Agriculture Organization of the United Nations |
|
Hb |
Haemoglobin |
|
HBGV |
health based guidance value |
|
HT2 |
HT2 toxin |
|
i.p. |
intraperitoneal |
|
JECFA |
Joint FAO/WHO Expert Committee on Food Additives |
|
kg |
kilogram |
|
LB |
lower bound |
|
LOAEL |
lowest observed adverse effect level |
|
LOEL |
lowest observed effect level |
|
LOD |
limit of detection |
|
LOQ |
limit of quantification |
|
μg |
microgram |
|
MCHb |
mean corpuscular haemoglobin |
|
MCV |
mean corpuscular volume |
|
mg |
milligram |
|
NDNS |
National Diet and Nutrition Survey |
|
NEO |
neosolaniol |
|
NOAEL |
no-observed adverse effect level |
|
PCV |
packed cell volume |
|
PMTDI |
provisional maximum tolerable daily intake |
|
ppm |
parts per million |
|
PYY3-36 |
anorectic peptide pancreatic peptide YY3-36 |
|
RNA |
ribonucleic acid |
|
RPF |
relative potency factor |
|
SCF |
Scientific Committee on Food |
|
T2 |
T2 toxin |
|
TDS |
total diet study |
|
TEC |
total erythrocyte counts |
|
TLC |
total leucocyte counts |
|
TTC |
total thrombocyte counts |
|
tTDI |
temporary tolerable daily intake |
|
UB |
upper bound |
|
UBMD |
95 % upper confidence limit for benchmark dose |
|
WHO |
World Health Organization |
References
COT (2018) Statement of T-2 toxin (T2), HT-2 toxin (HT2) and neosolaniol (NEO) in the diet of infants aged 0 to 12 months and children aged 1 to 5 years. Available at: cotstatement-t2ht2andneosolaniol.pdf (food.gov.uk)
COT (2021) Statement on the potential risk(s) of combined exposure to mycotoxins. Available at: Combined exposure to mycotoxins report (food.gov.uk)
EFSA (2011a) Scientific Opinion on the risks for animal and public health related to the presence of T2 and HT2 toxin in food and feed. EFSA Journal 9(12): 2481. Available at: Scientific Opinion on the risks for animal and public health related to the presence of T-2 and HT-2 toxin in food and feed | EFSA (europa.eu)
EFSA (2011b) Use of BMDS and PROAST software packages by EFSA Scientific Panels and Units for applying the Benchmark Dose (BMD) approach in risk assessment. EN-113. pp190. Available at: Use of BMDS and PROAST software packages by EFSA Scientific Panels and Units for applying the Benchmark Dose (BMD) approach in risk assessment | EFSA (europa.eu)
EFSA (2017a) Appropriateness to set a group health based guidance value
for T2 and HT2 toxin and its modified forms. EFSA Journal 51(1): 4655. Available at: Appropriateness to set a group health based guidance value for T2 and HT2 toxin and its modified forms | EFSA (europa.eu)
EFSA (2017b) Update: use of the benchmark dose approach in risk assessment. EFSA Journal 15(1): 4658. Available at: Update: use of the benchmark dose approach in risk assessment - - 2017 - EFSA Journal - Wiley Online Library
FAO/WHO (2001) WHO Food Additive Series: 47. Safety evaluation of certain mycotoxins in food. Available at: T-2 AND HT-2 TOXINS (JECFA 47, 2001) (inchem.org)
Gordon G. (1985) Ipecacuanha induced emesis in the treatment of self-poisoned adults. Archives of Emergency Medicine 2: 203-208.
JECFA (2022) Summary of Conclusions of 93rd meeting of JECFA. Available at: 93rd Joint FAO/WHO Expert Committee on Food Additives (JECFA) - Food additives. Summary and conclusions. 2022
Nathanail A.V., Varga E., Meng-Reiterer J., et al. (2015) Metabolism of the Fusarium Mycotoxins T-2 Toxin and HT-2 Toxin in Wheat. J. Agric. Food Chem. 63: 7862–7872.
Percie du Sert N., Holmes A.M., Wallis R., et al. (2012) Predicting the emetic liability of novel chemical entities: a comparative study. British Journal of Pharmacology 165: 1848-1867.
Rafai P., Tuboly S., Bata A., et al. (1995a) Effect of various levels of T2 toxin in the immune system of growing pigs. Vet. Rec. 136: 511-514. Available at: Effect of various levels of T-2 toxin in the immune system of growing pigs - PubMed (nih.gov)
Rafai P., Bata A., Vanyi A., et al. (1995b) Effect of various levels of T2 toxin on the clinical status, performance and metabolism of growing pigs. Vet. Rec. 136: 485-489.
Rahman S., Sharma A.K., Singh N.D., et al. (2014) Clinico-haematological changes in T2 toxicosis in Wistar rats. Indian Journal of Veterinary Pathology. 38: 22-28. Available at: Clinico-haematological changes in T-2 toxicosis in Wistar rats
SCF (2002) Opinion of the Scientific Committee on Food on Fusarium toxins.
Part 6: Group evaluation of T2 toxin, HT2 toxin, nivalenol and deoxynivalenol. Available at: Opinion of the Scientific Committee on Food on Fusarium toxins. Part 6: Group evaluation of T-2 toxin, HT-2 toxin, Nivaleno... (europa.eu)
Wu W., Zhou H., Bursian S.J., et al. (2016) Emetic responses to T2 toxin, HT2 toxin and emetine correspond to plasma elevations of peptide YY3-36 and 5-hydroxytryptamine. Archives of Toxicology. 90: 997-1007. Available at: Emetic responses to T-2 toxin, HT-2 toxin and emetine correspond to plasma elevations of peptide YY3-36 and 5-hydroxytryptamine - PubMed (nih.gov)
Zhang F., Wang L., Yang Z-H., et al. (2006) Value of mink vomit model in study of anti-emetic drugs. World J. Gastroenterol. 12(8): 1300-1302.