Hazard Characterisation section including benchmark dose modelling, uncertainty analysis and the derivation of a health-based guidance value.
On this page
Skip the menu of subheadings on this page.This is a paper for discussion.
This does not represent the views of the Committee and should not be cited.
Hazard Characterisation
Benchmark Dose Modelling
1. The CEP Panel used BMD analysis for dose-response modelling and performed it in accordance with EFSA updated guidance (EFSA, 2017), using PROAST the online EFSA BMD modelling tool. The detailed BMD analysis are in Annex I of the draft EFSA BPA Opinion, including the rationale of the selection of the BMRs. Tables and Figures in this paper are replicated or taken from EFSA, 2021.
2. The EFSA guidance includes criteria to establish whether a dose response is present. However, when the data are poor, the confidence interval (CI) may be wide and the calculated BMDL might be much lower than the true BMD. The use of this value as the reference point (RP) may seem unwarranted. This may also be the case when different models result in widely different BMDL values.
3. There is no mention in the guidance of how to deal with poor data sets. The US EPA (2020) use a cut-off value of 10 for the ratio of the lowest non-zero dose and the BMDL when using the US BMDS (benchmark dose modelling software) to discard data sets for BMD analysis. The CEP Panel applied this cut-off to take a study through for selection of the RP. Studies falling outside of this cut-off were still considered in the uncertainty analysis.
4. When performing the BMD analysis, the BPA doses used were those administered not converted to HED. The HED-converted values were used subsequently to compare the different modelling outcomes.
5. The rationale for the selection of the benchmark responses (BMRs) is given in the sections below. The BMD is the dose corresponding with the BMR of interest. A 90% confidence interval (CI) around the BMD was estimated, the lower bound is reported by lower confidence limit of the benchmark dose (BMDL) and the upper bound by the upper confidence limit of the benchmark dose (BMDU).
6. No deviations from the recommended defaults (e.g. gamma distributional assumption instead of log-normal, heteroscedasticity instead of homoscedasticity) were made.
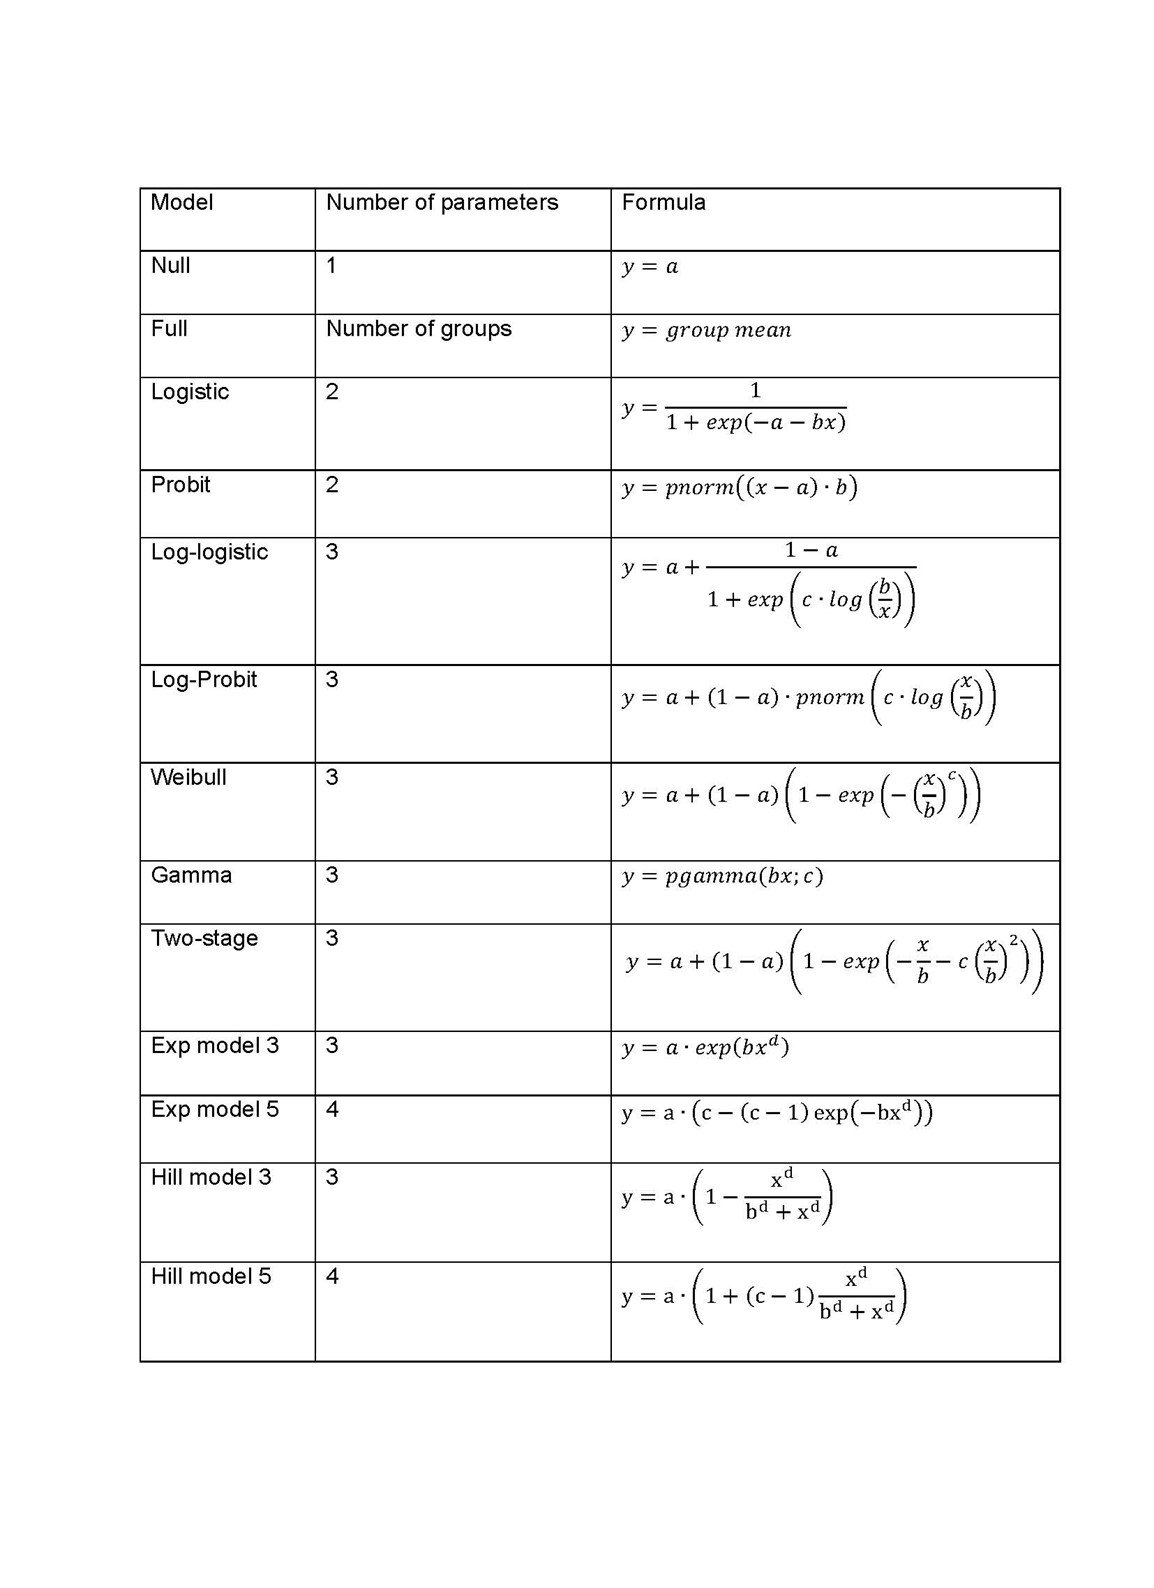
7. When performing the BMD analysis: PROAST v 69.0 was used for analysis of quantal data and v 70.0 was used for continuous data; the default set of models were applied for each of quantal and continuous data models (Tables 1 and 2); and for the Exp and Hill family, the models with 3 and 4 parameters were fitted as listed in the default set of models tables (P.5 Annex I). The 3-parameter model was selected if the difference in Akaike information criterion (AIC) was smaller than 5, otherwise the 4-parameter model was selected.
Table 1. Default set of fitted models for continuous data.
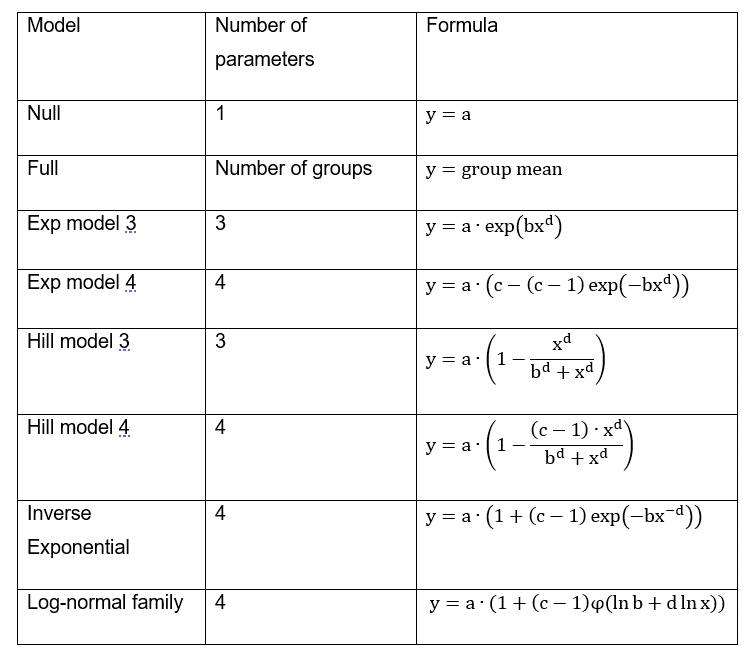
8. When a covariate is included in the analysis, these models will also be fitted assuming that some of the parameters [background response parameter (a), potency parameter (BMD) and/or variance (var)] depend on the subgroup defined by the covariate. Therefore the number of parameters in each model might be larger than indicated in Table 1.
Table 2. Default set of fitted models for quantal data.
9. A flow chart (Figure 1) was applied to obtain the BMD CI (Page 6, Annex I). The results of the BMD analysis are shown in Table 7 (Table 19 of the EFSA opinion). Table 8 (Table 20 of the EFSA opinion) shows the BMD confidence intervals (CIs) used for the identification of the reference point to derive a HBGV.
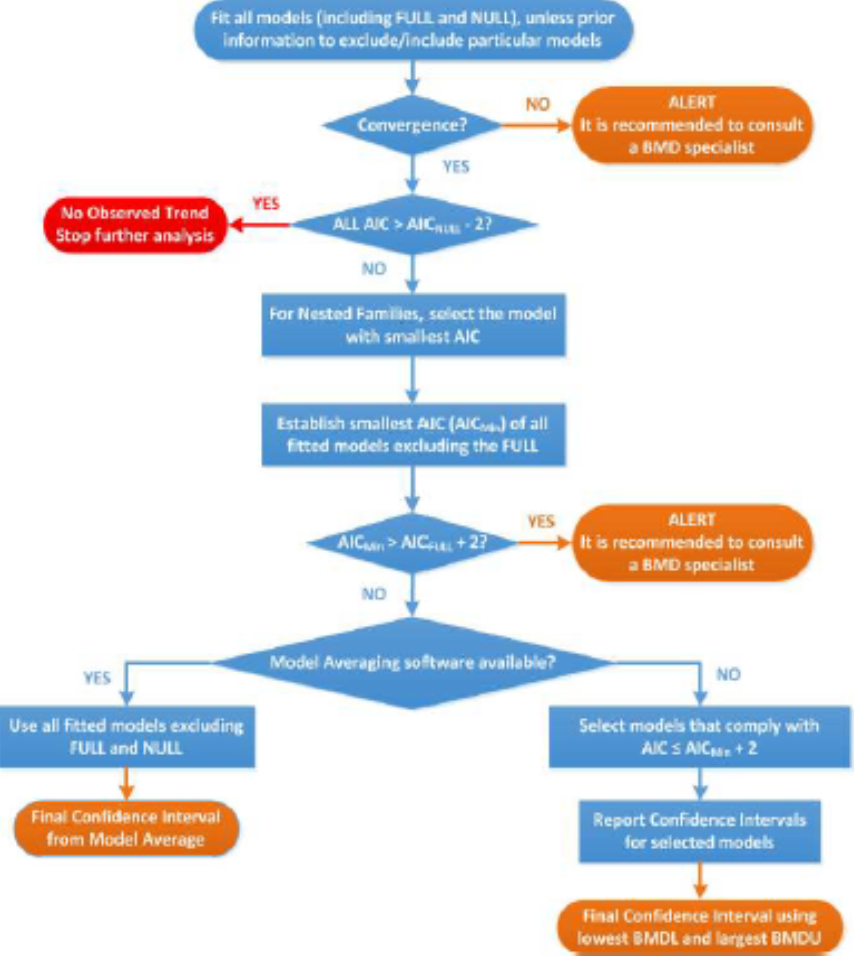
Figure 1: Flowchart for selection of BMDL. Taken from EFSA, 2021.
Immunotoxicity endpoints
10. Using a WoE approach, the CEP Panel assigned a likelihood level of ‘Likely’ to BPA-induced effects on the Th17 cells (Luo et al., 2016), on the neutrophils in epididymis (Ogo et al., 2018) and on eosinophils in the BAL (Tajiki-Nishino et al., 2018) and of ‘Very Likely’ to BPA-induced effects on serum OVA-specific IgE (O’Brien et al., 2014a). Therefore, these endpoints were brought forward for BMD analysis; the CEP Panel noted that the datasets on neutrophils in epididymis (Ogo et al., 2018) and eosinophils in the BAL (Tajiki-Nishino et al., 2018) included only two dose groups and a control group.
11. However, for reasons listed in the EFSA Opinion, BMD analysis was not conducted, or not taken forward for identifying the reference point (RP), for the following studies: BPA-induced effects in: serum OVA-specific IgE (O’Brien et al., 2014a), neutrophils in the epididymis (Ogo et al., 2018) (only for Neutrophils in epididymis: cauda. The results for neutrophils in epididymis: caput/corpus were taken forward), and eosinophils in the BAL (Tajiki-Nishino et al., 2018).
12. The study taken forward to derive the health-based guidance value was that on the effect of BPA on Th17 cells in mice (Luo et al., 2016). Therefore the benchmark dose modelling is described here in more detail.
13. Th17 cell frequency in the spleen in offspring mice (%) was analysed. Actual values were provided to EFSA by T. Shen. From these, EFSA calculated the standard deviation (SD). The group, specified by sex and day of measurement, was used as a covariate. The 10/11 animals within each group are from different litters, supporting the independence assumption for which no litter effect was considered in the analysis. The data were treated as continuous data since the number of cells in the denominator were not available to consider the data as a quantal response. Both controls (blank and vehicle) were not significantly different (t-test, p=0.89, 0.94, 0.74, 0.82 for male PND21, female PND21, male PND42, female PND42, respectively) and were used in the analysis.
14. An adverse outcome pathway for BPA leading to allergic responses that can be modelled to establish a BMD is currently not available. T helper cells are key in the immune-inflammatory chain of molecular events leading to amplification or suppression of specific immune elements, orienting the immune response towards effective resolution or chronic disease, and, according to an equilibrium in which these same cells and through the production of specific cytokines, restrict each other’s own activity. Functionally, T helper 17 cells play a role in host defence against extracellular pathogens by mediating the recruitment of inflammatory cells to infected tissues. Abnormal regulation of Th17 cells plays a significant role in the pathogenesis of multiple inflammatory and autoimmune disorders. Interleukin (IL)-17 is produced by Th17 cells and its most notable role is its involvement in inducing and mediating proinflammatory responses, associated with allergic responses. IL-17 induces the production of many other cytokines (such as IL-6, G-CSF, GM-CSF, IL-1β, TGF-β, TNF-α), chemokines (including IL-8, GRO-α, and MCP-1), and prostaglandins (e.g., PGE2) from many cell types (fibroblasts, endothelial cells, epithelial cells, keratinocytes, and macrophages). As such, numerous studies have shown that Th17 cells and their cytokines are also associated with the development of asthma (Doe et al., 2010). IL-17A is considered an important cytokine in the induction of the asthma inflammatory response. In the pathogenesis of asthma, Th17/IL-17A can induce the accumulation of inflammatory cells in the airway and participate in the process of asthma. In addition, the activation of Th17 cells and the secretion of IL-17 can increase the immune response of Th2 cells, thereby aggravating the severity of allergic asthma.
15. BPA exposure led to a dose-related increment of Th17 cells in mice. This effect was consistent with effects on cellular immunity based on Th17 cells and associated cytokines (IL-17, IL-21 and IL-23), as well as with effects of BPA in the cluster of allergic lung inflammation.
16. When using the benchmark approach for dose-response analysis, a BMR needs to be selected. The EFSA guidance (EFSA Scientific Committee, 2017) recommends a BMR of 5% as default. However, deviating from this default is possible, based on toxicological or statistical considerations. For Th17 cells, there is currently insufficient information available on the normal variability of this measure, either in the mouse strain used in the study, or other strains. In humans, a study published in 2016 reported a retrospective analysis on lymphocyte subpopulations, analysed over a few years in an outpatient laboratory in Northeast Italy (Sorrenti et al., 2016) to provide reference ranges. In Caucasian patients (mean age 42 ± 8.5 years), mean values ± SD of Th17 in peripheral blood are 221.6 ± 90.2 cells/µL (10.5 ± 4.4%). Registered cases of lymphocyte associated diseases (immunodeficiencies and lymphoproliferative disorders) were excluded from the study, as well as samples with values of total erythrocytes, total leukocytes, total lymphocytes, and major lymphocyte populations (T cells, Th, Tc and B lymphocytes) outside the normal range according to guidelines.
17. Furthermore, the CEP Panel notes that the increment of Th17 cells is an intermediate endpoint, and some reserve capacity will exist. While considering that in the human population, for individuals a 20% increase may not necessarily imply an adverse condition for that person, given the pivotal role of Th17 cells in lung allergy, the CEP Panel considered that if the population at large showed a 20% increment in Th17 cells, individuals that are in the higher segment of the normal range, will be put out of the normal range, and as a consequence numbers of lung allergy cases would be expected to increase.
18. In conclusion, while the effect of BPA exposure on Th17 cells is clear, considering the SD in the outcomes of the animal study (Table 3), the CEP Panel considered 20% would be in line with the variability noted in the animal study and the wider normality range in humans, and considered it as adverse and therefore used 20% as the BMR.
Table 3. Data used for the BMD analysis of the Th17 cells endpoint.
|
Dose (µg/kg bw per day) |
Mean |
SD |
n |
group |
|
0.000 |
1.336 |
0.360 |
10 |
female PND21 |
|
0.000 |
1.348 |
0.310 |
10 |
female PND21 |
|
0.475 |
1.625 |
0.343 |
10 |
female PND21 |
|
4.750 |
2.200 |
0.663 |
10 |
female PND21 |
|
47.500 |
3.336 |
0.637 |
11 |
female PND21 |
|
0.000 |
1.222 |
0.233 |
10 |
female PND42 |
|
0.000 |
1.252 |
0.326 |
10 |
female PND42 |
|
0.475 |
1.541 |
0.325 |
10 |
female PND42 |
|
4.750 |
1.819 |
0.556 |
10 |
female PND42 |
|
47.500 |
2.477 |
0.477 |
11 |
female PND42 |
|
0.000 |
1.347 |
0.369 |
10 |
Male PND21 |
|
0.000 |
1.327 |
0.282 |
10 |
Male PND21 |
|
0.475 |
1.554 |
0.242 |
10 |
Male PND21 |
|
4.750 |
1.774 |
0.501 |
10 |
Male PND21 |
|
47.500 |
2.405 |
0.532 |
11 |
Male PND21 |
|
0.000 |
1.194 |
0.235 |
10 |
Male PND42 |
|
0.000 |
1.234 |
0.287 |
10 |
Male PND42 |
|
0.475 |
1.426 |
0.278 |
10 |
Male PND42 |
|
4.750 |
1.646 |
0.477 |
10 |
Male PND42 |
|
47.500 |
2.226 |
0.526 |
11 |
Male PND42 |
19. The models used and the outputs of the BMD analysis for the endpoint of Th17 cells, with a BMR of 20% are presented in Table 4.
Table 4. The fitted models used in the BMD analysis for Th17 cells data using a BMR of 20%.
|
model |
Converged |
loglikelihood |
Number of parameters |
Akaike Information Criterion |
|
full model |
yes |
18.60 |
21 |
4.80 |
|
full-v |
yes |
18.65 |
24 |
1 |
|
null model |
yes |
−80.77 |
2 |
165.5 |
|
null model-a |
yes |
−76.25 |
5 |
162.50 |
|
Expon. M3- |
yes |
1.97 |
4 |
4.06 |
|
Expon. M3-a |
yes |
12.43 |
7 |
−10.86 |
|
Expon. M3-ab |
yes |
18.12 |
10 |
−16.24 |
|
Expon. M5-a |
yes |
12.43 |
8 |
−8.86 |
|
Expon. M5-ab |
yes |
18.12 |
11 |
−14.24 |
|
Hill m3-a |
yes |
12.43 |
7 |
−10.86 |
|
Hill m3-ab |
yes |
18.12 |
10 |
−16.24 |
|
Hill m5-a |
yes |
12.42 |
8 |
−8.84 |
|
Hill m5-ab |
yes |
18.12 |
11 |
−14.24 |
|
Inv.Expon. m3-a |
yes |
12.28 |
7 |
−10.56 |
|
Inv.Expon. m3-ab |
yes |
17.88 |
10 |
−15.76 |
|
Inv.Expon. m5-a |
yes |
12.21 |
8 |
−8.42 |
|
Inv.Expon. m5-ab |
yes |
17.74 |
11 |
−13.48 |
|
LN m3-a |
yes |
12.37 |
7 |
−10.74 |
|
LN m3-ab |
yes |
18.03 |
10 |
−16.06 |
|
LN m5-a |
yes |
12.33 |
8 |
−8.66 |
|
LN m5-ab |
yes |
17.97 |
11 |
−13.94 |
20. Model averaging analysis was undertaken and confidence intervals for the BMD are based on 1000 bootstrap data sets. The lowest BMDL20–BMDU20 CI (0.06–0.74 µg/kg bw per day) was observed in females at PND21; at PND42 the BMDL20–BMDU20 CI in females was 0.17–1.79 µg/kg bw per day. In males, similar BMDL20–BMDU20 CI were observed for both time points of measurement (0.30–3.39 µg/kg bw per day for PND21 and 0.35–3.38 µg/kg bw per day for PND42).
21. For the effect of BPA on the neutrophils in the epididymis, a BMDL20–BMDU20 CI of 6.8–90.4 µg/kg bw per day was calculated for the caput/corpus.
Metabolic effects
22. The CEP Panel considered that the available evidence showed a ‘Likely’ effect of BPA for the endpoint uric acid. Therefore, the endpoints hepatic and serum uric acid concentrations reported by Ma et al. (2018) were taken forward for BMD analysis (see Table 19 (EFSA Opinion) and Annex I for further details).
23. However, for reasons listed in the EFSA Opinion, BMD analysis was not taken forward for identifying the reference point (RP), for the serum uric acid endpoint
24. For the effect on hepatic uric acid a BMDL20–BMDU20 CI of 1.59–399 µg/kg bw per day was calculated; the Panel noted the wide CI. However, as explained above, the EFSA guidance does not provide guidance on how to deal with poor data sets.
Neurotoxicity and developmental neurotoxicity
25. The CEP Panel considered that the available evidence showed a ‘Likely’ effect of BPA for the following endpoints:
- Anxiety/emotionality (Xu XH et al., 2015; Chen Z et al., 2018; Liang et al., 2018; Xin et al., 2018;
- Learning and memory (Wang C et al., 2014; Johnson et al., 2016; Wang C et al., 2016; Zhou YX et al., 2017; Chen Z et al., 2018);
- Male sexual behaviour (Picot et al., [Re);
- Salt preference (Nuñez et al., 2018);
- Dendritic spine density (Liu ZH et al., 2014; Kimura et al., 2016; Chen Z et al., 2018);
- Number of neurons in hippocampus (CA1 and CA3 areas) (Zhou YX et al., 2017);
- AChE activity (Khadrawy et al., 2016).
26. Therefore, these endpoints were taken forward for BMD analysis; the CEP Panel noted that the datasets on anxiety/emotionality (Xu XH et al., 2015), dendritic spine density (Kimura et al., 2016) and AChE activity (Khadrawy et al., 2016) included only two dose groups and a control group
27. However, for reasons listed in the EFSA Opinion, BMD analysis was not conducted, or not taken forward for identifying the reference point (RP), for the following studies: learning and memory studies (Wang C et al., 2014 and 2016); number of neurons in hippocampus (CA1 and CA3 areas) and learning and memory (Zhou YX et al., 2017); salt preference (Nuñez et al., 2018); and anxiety/emotionality (immobility) in females (Xu XH et al., 2015); anxiety/emotionality (Xin et al., 2018); anxiety/emotionality (Chen Z et al., 2018); anxiety/emotionality (immobility in females and males) and (time in open arms in females) (Xu XH et al. 2015); learning and memory (relative expression of NR2 and GluR1 in the hippocampus) (Chen Z et al., 2018); dendritic spine density (Kimura et al., 2016); and AChE activity (Khadrawy et al., 2016).
28. Xu XH et al., (2015) studied immobility and the time in open arms. A BMDL50–BMDU50 CI of 497-80400 µg/kg bw per day was calculated for males; the Panel noted the wide CI.
29. For the effect of BPA on learning and memory as studied by Johnson et al. (2016), a BMDL50–BMDU50 CI of 10.10–2160 µg/kg bw per day was calculated for females and 1.47–1520 µg/kg bw per day for males; the Panel noted the wide CIs.
30. Chen Z et al. (2018) studied several endpoints in relation to this cluster. For the relative expression of NR2 in V1 (learning and memory), a BMDL20–BMDU20 CI of 7.96–842 µg/kg bw per day was calculated and for platform duration (learning and memory) a BMDL50–BMDU50 of 10700– 2.4e+7 µg/kg bw per day; the Panel noted the wide CIs.
31. For dendritic spine density a BMDL20–BMDU20 CI of 4.24–2350 µg/kg bw per day was estimated from the dataset reported by Chen Z et al. (2018); the Panel noted the wide CI. For the same endpoint, a BMDL20–BMDU20 CI of 16,800–70,100 µg/kg bw per day was calculated from the dataset reported by Liu ZH et al. (2014); the Panel noted that the latter CI was completely outside the dose range.
Reproductive and developmental toxicity
32. The CEP Panel considered that the available evidence showed a Likely effect of BPA for the following endpoints:
- Ovary weight (NTP Clarity Report, 2018/Camacho et al., 2019);
- Uterus histology (Vigezzi et al., 2015; NTP Clarity Report, 2018/Camacho et al., 2019);
- Ovary histology (NTP Clarity Report, 2018/Camacho et al., 2019 during the developmental exposure period; NTP Clarity Report, 2018/Camacho et al., 2019 during developmental and adult exposure; Hu et al., 2018 during adult exposure;
- Decreased implantation incidence (Li et al., 2016);
- Epididymis histology (NTP Clarity Report, 2018/Camacho et al., 2019);
- Testis histology (Gurmeet et al., 2014);
- Effects on sperm (Wang HF et al., 2016).
33. Therefore, these endpoints were taken forward for BMD analysis; the CEP Panel noted that the dataset on uterus histology (Vigezzi et al., 2015) included only two dose groups and a control group.
34. However, for reasons listed in the EFSA Opinion, BMD analysis was not conducted, or not taken forward for identifying the reference point (RP), for the following studies: decreased implantation incidence (Li et al., 2016); Incidence of hyperplasia, cystic, endometrium (uterus histology) (Camacho et al., 2019); Incidence of squamous metaplasia (uterus histology) (Camacho et al., 2019); Incidence of glands with cellular anomalies (uterus histology) (Vigezzi et al., 2015); Incidence of interstitial cell hypertrophy (ovary histology) (Camacho et al., 2019); Ratio of primordial and primary follicles (Hu et al., 2018); acrosome reaction (AR) effects on sperm (Wang HF et al., 2016); incidence of inflammation in the epididymis (Camacho et al., 2019) and for testis histology (Gurmeet et al., 2014).
35. A BMDL05–BMDU05 CI of 0.63–25000 µg/kg bw per day was calculated for ovary weight (NTP Clarity 11952 Report, 2018/Camacho et al., 2019) and a BMDL10–BMDU10 CI of 5.53–3680 µg/kg bw per day for ovary histology (incidence of follicle cysts) during developmental exposure period reported by NTP Clarity Report (2018)/Camacho et al. (2019). The Panel noted the wide CIs for these data sets.
36. The CEP Panel noted the second most sensitive endpoint was ovarian follicle counts (Hu et al., 2018). The endpoint of the ratio of primordial and primary follicles is not considered further because the BMDL values were too far outside the tested dose-range to be taken forward for identifying the RP. The BMD modelling for ratio of primordial and total follicles is described in more detail in the following paragraphs. Table 5 shows the data used in the analysis.
Table 5. Data used for the BMD analysis of the ratio of primordial and total follicles.
|
Dose (µg/kg bw per day) |
Mean ratio of primordial and total follicles |
SEM ratio of primordial and total follicles |
n |
|
0 |
0.684 |
0.003 |
8 |
|
1 |
0.677 |
0.001 |
8 |
|
10 |
0.649 |
0.011 |
8 |
|
100 |
0.630 |
0.012 |
8 |
|
1000 |
0.625 |
0.008 |
8 |
|
10000 |
0.618 |
0.002 |
8 |
37. The BMR used is the default value for continuous data of a 5% change in mean response compared with the controls.
38. The models used in the BMD analysis for the endpoint of the ratio of primordial and total follicles, with a BMR of 5% are presented in Table 6.
Table 6. The fitted models used in the BMD analysis for the ratio of primary and total follicle data using a BMR of 20%.
|
model |
converged |
Loglikelihood |
Number of parameters |
Akaike Information Criterion |
|
full model |
yes |
98.35 |
7 |
−182.70 |
|
null model |
yes |
75.41 |
2 |
−146.82 |
|
Expon. m3- |
yes |
91.31 |
4 |
−174.62 |
|
Expon. m5- |
yes |
92.86 |
5 |
−175.72 |
|
Hill m3- |
yes |
93.62 |
4 |
−179.24 |
|
Hill m5- |
yes |
94.57 |
5 |
−179.14 |
|
Inv.Expon. m3- |
yes |
94.06 |
4 |
−180.12 |
|
Inv.Expon. m5- |
yes |
95.38 |
5 |
−180.76 |
|
LN m3- |
yes |
93.89 |
4 |
−179.78 |
|
LN m5- |
yes |
94.82 |
5 |
−179.64 |
39. Model averaging analysis was undertaken and confidence intervals for the BMD are based on 1000 bootstrap data sets. A BMDL05–BMDU05 CI of 0.96-349 µg/kg bw per day was calculated for the ratio of primordial and total follicles as reported by Hu et al. (2018). The Panel noted the wide CIs for these data sets.
40. For the incidence of exfoliated germ cells as reported by NTP Clarity Report (2018)/Camacho et al. (2019) a BMDL10–BMDU10 CI of 2,260–27,500 µg/kg bw per day was estimated. BMDL20–BMDU20 CIs of 26.1–2460 and 3.41–74.8 µg/kg bw per day were calculated for sperm viability and motility, respectively (Wang HF et al., 2016).
Carcinogenicity and mammary gland effects
41. Overall, the CEP Panel did not assign a likelihood level of ‘Likely’ to the pre-neoplastic and neoplastic histological changes. However, the Panel assigned a likelihood level of ‘Likely’ to the following non-neoplastic uterine histological effects of BPA: gland cell anomalies (Vigezzi et al., 2015) and endometrial cystic hyperplasia (NTP Clarity Report, 2018/Camacho et al., 2019). Therefore, these endpoints were taken forward for BMD analysis.
Summary of the BMD analysis
42. In the previous EFSA opinion on BPA (EFSA CEF Panel, 2015), the extrapolation from the RP to the TDI was performed using a BPA-specific human equivalent dose factor (HEDF). The HEDF is calculated by dividing the AUCs of unmetabolized (parent) BPA of animals (e.g. mice or rats) by the AUCs of humans (AUC animal/AUC human), both AUC values being corrected for the dose (AUC [corrected for dose] animal/AUC [corrected for dose] human). This approach has also been taken in this BMD analysis. For the calculation of the BMDL and BMDU values expressed as HED, a HEDF of 0.0155 was used for studies in mice and a HEDF of 0.1656 for studies in rats.
43. The BMD analysis undertaken by EFSA is summarised in tables 7 and 8. Table 7 provides an overview of the BMD analysis. Table 8 provides an overview of the BMD confidence intervals used for the identification of the Reference Point to derive a HBGV. The lowest BMDL value is shown in bold.
Table 7. Overview of BMD analyses.
|
Reference; Immunotoxicity |
Endpoint |
Species |
Dose range(b) (µg/kg bw per day) |
BMR |
Group |
BMDL (µg/kg bw per day) |
BMDU (µg/kg bw per day) |
Ratio dose /BMDL(d) |
|
Luo et al. (2016) |
Th17 cells |
Mouse |
0.475–47.5 |
20% |
F PND21 |
0.06 |
0.74 |
7.9 |
|
Luo et al. (2016) |
Th17 cells |
Mouse |
0.475–47.5 |
20% |
F PND42 |
0.17 |
1.79 |
2.8 |
|
Luo et al. (2016) |
Th17 cells |
Mouse |
0.475–47.5 |
20% |
M PND21 |
0.30 |
3.39 |
1.6 |
|
Luo et al. (2016) |
Th17 cells |
Mouse |
0.475–47.5 |
20% |
M PND42 |
0.35 |
3.38 |
1.4 |
|
Ogo et al. (2018) |
Neutrophils in epididymis: Caput/corpus |
Rat |
20-200 |
20% |
n/a |
6.8 |
90.4 |
2.9 |
|
Ogo et al. (2018) |
Neutrophils in epididymis: cauda |
Rat |
20-200 |
20% |
n/a |
0.5 |
4.62 |
40 |
|
Tajiki-Nishino et al. (2018) |
Eosinophil infiltration in BAL fluid |
Mouse |
60-200 |
20% |
n/a |
0.00046 |
34.5 |
130434.8 |
|
Metabolic effects |
Endpoint |
Species |
Dose range(b) (µg/kg bw per day) |
BMR |
Group |
BMDL (µg/kg bw per day) |
BMDU (µg/kg bw per day) |
Ratio dose /BMDL(d) |
|
Ma et al. (2018) |
Hepatic uric acid concentration |
Mouse |
5-500 |
20% |
n/a |
1.59 |
399 |
3.1 |
|
Ma et al. (2018) |
Serum uric acid concentration |
Mouse |
5-500 |
20% |
CD1 mice |
0.39 |
91.5 |
12.8 |
|
|
Serum uric acid concentration |
Mouse |
5-500 |
20% |
C57BL6 mice |
None of the fitted models is better than the null model(a) |
None of the fitted models is better than the null model(a) |
|
|
Neurotoxicity- and developmental neurotoxicity |
Endpoint |
Species |
Dose range(b) (µg/kg bw per day) |
BMR |
Group |
BMDL (µg/kg bw per day) |
BMDU (µg/kg bw per day) |
Ratio dose /BMDL(d) |
|
Xin et al. (2018) |
Time spent immobile in the forced swim test (Anxiety/emotionality) |
Mouse |
10-10000 |
50% |
n/a |
6.1 |
1.06e+14 |
1.6 |
|
Johnson et al. (2016) |
Sniffing incorrect holes on day 7 (learning and memory) |
Rat |
2.5-2500 |
50% |
F |
10.10 |
2160 |
0.2 |
|
Johnson et al. (2016) |
Sniffing incorrect holes on day 7 (learning and memory) |
Rat |
2.5-2500 |
50% |
M |
1.47 |
1520 |
1.7 |
|
Chen Z et al. (2018) |
First entry time in the open field test (Anxiety/emotionality). |
Rat |
40-4000 |
50% |
n/a |
0.03 |
517 |
1333.3 |
|
Chen Z et al. (2018) |
Platform duration (learning and memory) |
Rat |
40-4000 |
50% |
n/a |
10700 |
2.4e+7 |
0.004 |
|
Chen Z et al. (2018) |
Relative expression NR2 in the hippocampus (learning and memory) |
Rat |
40-4000 |
20% |
n/a |
2.18 |
439 |
18.3 |
|
Chen Z et al. (2018) |
Relative expression GluR1 in the hippocampus (learning and memory) |
Rat |
40-4000 |
20% |
n/a |
0.31 |
2410 |
129.0 |
|
Chen Z et al. (2018) |
Relative expression NR2 in V1 (learning and memory) |
Rat |
40-4000 |
20% |
n/a |
7.96 |
842 |
5.0 |
|
Zhou YX et al. (2017) |
Quantity of hippocampal CA1 neurons |
Mouse |
0.5–500 |
20% |
n/a |
None of the fitted models is better than the null model(a) |
n/a |
n/a |
|
Zhou YX et al. (2017) |
Quantity of hippocampal CA3 neurons |
Mouse |
0.5–500 |
20% |
n/a |
None of the fitted models is better than the null model(a) |
n/a |
n/a |
|
Zhou YX et al. (2017) |
Trials to qualify for the standard (learning and memory) |
Mouse |
0.5–500 |
20% |
n/a |
None of the fitted models is better than the null model(a) |
n/a |
n/a |
|
Xu XH et al. (2015) |
Time in open arms (Anxiety/emotionality) |
Mouse |
40-40,000 |
50% |
F |
1.71 |
1260 |
23.4 |
|
Xu XH et al. (2015) |
Time in open arms (Anxiety/emotionality) |
Mouse |
40-40,000 |
50% |
M |
497 |
80,400 |
0.1 |
|
Xu XH et al. (2015) |
Immobility (Anxiety/emotionality) |
Mouse |
40-40,000 |
50% |
F |
None of the fitted models is better than the null model(a) |
|
|
|
Xu XH et al. (2015) |
Immobility (Anxiety/emotionality) |
Mouse |
40-40,000 |
50% |
M |
0.03 |
89.4 |
1333.3 |
|
Nuñez et al. (2018) |
Salt preference |
Rat |
10–500 |
10% |
|
None of the fitted models is better than the null model(a) |
|
|
|
Kimura et al. (2016) |
Dendritic spine density |
Mouse |
40–400 |
20% |
n/a |
2.43 |
58.5 |
16.5 |
|
Liu ZH et al. (2014) |
Dendritic spine density |
Rats |
918–9175 |
20% |
n/a |
16800 |
70100 |
0.1 |
|
Chen Z et al. (2018) |
Dendritic spine density |
Rat |
40–4000 |
20% |
n/a |
4.24 |
2350 |
9.4 |
|
Khadrawy et al. (2016) |
AChE activity in the cortex |
Rat |
10000–25000 |
20% |
n/a |
570 |
20700 |
17.5 |
|
Khadrawy et al. (2016) |
AChE activity in the hippocampus |
Rat |
10000–25000 |
20% |
n/a |
2.7 |
6330 |
3703.7 |
|
Reproductive and developmental toxicity Carcinogenicity and mammary gland proliferative effects(c) |
Endpoint |
Species |
Dose range(b) (µg/kg bw per day) |
BMR |
Group |
BMDL (µg/kg bw per day) |
BMDU (µg/kg bw per day) |
Ratio dose /BMDL(d) |
|
Camacho et al., 2019 |
Ovary weight |
Rat |
2.5–25000 |
5% |
n/a |
0.63 |
25000 |
4.0 |
|
Camacho et al., 2019 |
Incidence of hyperplasia, cystic, endometrium (uterus histology) |
Rat |
2.5–25000 |
10% |
n/a |
None of the fitted models is better than the null model(a) |
n/a |
n/a |
|
Camacho et al., 2019 |
Incidence of squamous metaplasia (uterus histology) |
Rat |
2.5–25000 |
10% |
n/a |
None of the fitted models is better than the null model(a) |
n/a |
n/a |
|
Vigezzi et al. (2015) |
Incidence of glands with cellular anomalies (uterus histology) |
Rat |
0.5–50 |
10% |
n/a |
2.8e–05 |
8.34 |
17857.1 |
|
Camacho et al. (2019) |
Incidence of follicle cysts (ovary histology) |
Rat |
2.5–25000 |
10% |
n/a |
5.53 |
3680 |
0.5 |
|
Camacho et al. (2019) |
Incidence of interstitial cell hypertrophy (ovary histology) |
Rat |
2.5–25000 |
10% |
n/a |
None of the fitted models is better than the null model(a) |
n/a |
n/a |
|
Hu et al. (2018) |
Ratio of primordial and primary follicles |
Mouse |
1–10000 |
5% |
n/a |
0.08 |
2.34 |
12.5 |
|
Hu et al. (2018) |
Ratio of primordial and total follicles |
Mouse |
1–10000 |
5% |
n/a |
0.96 |
349 |
1.0 |
|
Camacho et al. (2019) |
Incidence of exfoliated germ cells (epididymis histology) |
Rat |
2.5–25000 |
10% |
n/a |
2260 |
27500 |
0.001 |
|
Camacho et al. (2019) |
Incidence of inflammation (epididymis histology) |
Rat |
2.5–25000 |
10% |
n/a |
None of the fitted models is better than the null model(a) |
n/a |
n/a |
|
Gurmeet et al. (2014) |
Seminiferous tubule diameter (testis histology) |
Rat |
1000–100000 |
5% |
n/a |
None of the fitted models is better than the null model(a) |
n/a |
n/a |
|
Wang HF et al. (2016) |
Viability (effects on sperm) |
Mouse |
10–250 |
20% |
n/a |
26.1 |
2460 |
0.4 |
|
Wang HF et al. (2016) |
Motility (effects on sperm) |
Mouse |
10–250 |
20% |
n/a |
3.41 |
74.8 |
2.9 |
|
Wang HF et al. (2016) |
AR (effects on sperm) |
Mouse |
10–250 |
20% |
n/a |
0.31 |
1230 |
32.3 |
AR: acrosome reaction; AChE: acetylcholinesterase; BMDL: lower confidence limit of the benchmark dose; BMDU: upper confidence limit of the benchmark dose; BMR: benchmark response; F: female; M: 11981 male; PND: post-natal day.
(a): All fitted models’ Akaike information criterion (AIC) values are larger than null model’s AIC – 2.
(b): Dose range of BPA treated animals; the dose of 0 µg/kg bw per day was included in all studies but not included in the presented dose range. All doses are expressed as oral.
(c): Studies with footnote (c) were identified for both HOCs; the other studies for Reproductive and developmental toxicity only.
(d): Ratio of the lowest non-zero dose and the BMDL; values below 10 are shown in bold.
(e): Full reference: NTP Clarity Report (2018)/Camacho et al. (2019).
Table 8: Overview of BMD confidence intervals used for the identification of the Reference Point(c) to derive a HBGV.
|
Reference Immunotoxicity |
Endpoint |
Species |
BMR |
Group |
Administered doses BMDL (µg/kg bw per day) |
Administered doses BMDU (µg/kg bw per day) |
Administered doses converted to HED BMDL (ng/kg bw per day) |
Administered doses converted to HED BMDU (ng/kg bw per day) |
|
Luo et al. (2016) |
Th17 cells |
Mouse |
20% |
F PND21 |
0.06 |
0.74 |
0.93 |
11.5 |
|
Luo et al. (2016) |
Th17 cells |
Mouse |
20% |
F PND42 |
0.17 |
1.79 |
2.64 |
27.7 |
|
Luo et al. (2016) |
Th17 cells |
Mouse |
20% |
M PND21 |
0.30 |
3.39 |
4.65 |
52.5 |
|
Luo et al. (2016) |
Th17 cells |
Mouse |
20% |
M PND42 |
0.35 |
3.38 |
5.43 |
52.4 |
|
Ogo et al. (2018) |
Neutrophils in epididymis: Caput/corpus |
Rat |
20% |
|
6.8 |
90.4 |
1126 |
14970 |
|
Metabolic effects |
Endpoint |
Species |
BMR |
Group |
Administered doses BMDL (µg/kg bw per day) |
Administered doses BMDU (µg/kg bw per day) |
Administered doses converted to HED BMDL (ng/kg bw per day) |
Administered doses converted to HED BMDU (ng/kg bw per day) |
|
Ma et al. (2018) |
Hepatic uric acid |
Mouse |
20% |
n/a |
1.59 |
399 |
24.6 |
6185 |
|
Neurotoxicity and developmental neurotoxicity |
Endpoint |
Species |
BMR |
Group |
Administered doses BMDL (µg/kg bw per day) |
Administered doses BMDU (µg/kg bw per day) |
Administered doses converted to HED BMDL (ng/kg bw per day) |
Administered doses converted to HED BMDU (ng/kg bw per day) |
|
Johnson et al. (2016) |
Sniffing incorrect holes on day 7 (learning and memory) |
Rat |
50% |
F |
10.1 |
2160 |
1673 |
357696 |
|
Johnson et al. (2016) |
Sniffing incorrect holes on day 7 (learning and memory) |
Rat |
50% |
M |
1.47 |
1520 |
243 |
251712 |
|
Chen Z et al. (2018) |
Platform duration (learning and memory) |
Rat |
50% |
n/a |
10700 |
2.4e+7 |
1.77e+6 |
4.02e+9 |
|
Chen Z et al. (2018) |
Relative expression NR2 in V1 (learning and memory) |
Rat |
20% |
n/a |
7.96 |
842 |
1318 |
139435 |
|
Xu XH et al. (2015) |
Time in open arms (Anxiety/emotionality) |
Mouse |
50% |
M |
497 |
80400 |
7704 |
1.25e+06 |
|
Liu ZH et al. (2014) |
Dendritic spine density |
Rat |
20% |
n/a |
16800 |
70100 |
2.78e+06 |
1.16e+07 |
|
Chen Z et al. (2018) |
Dendritic spine density |
Rat |
20% |
n/a |
4.24 |
2350 |
702 |
389160 |
|
Reproductive and developmental toxicity |
Endpoint |
Species |
BMR |
Group |
Administered doses BMDL (µg/kg bw per day) |
Administered doses BMDU (µg/kg bw per day) |
Administered doses converted to HED BMDL (ng/kg bw per day) |
Administered doses converted to HED BMDU (ng/kg bw per day) |
|
Camacho et al. (2019) |
Ovary weight |
Rat |
5% |
n/a |
0.63 |
25,000 |
104 |
4.14e+06 |
|
Camacho et al. (2019) |
Incidence of follicle cysts (ovary histology) |
Rat |
10% |
n/a |
5.53 |
3680 |
916 |
6.09e+05 |
|
Hu et al. (2018) |
Ratio of primordial and total follicles |
Mouse |
5% |
n/a |
0.96 |
349 |
14.9 |
5410 |
|
Camacho et al. (2019) |
Incidence of exfoliated germ cells (epididymis histology) |
Rat |
10% |
n/a |
2260 |
27500 |
3.74e+05 |
4.55e+06 |
|
Wang HF et al. (2016) |
Viability (effects on sperm) |
Mouse |
20% |
n/a |
26.1 |
2460 |
405 |
38130 |
|
Wang HF et al. (2016) |
Motility (effects on sperm) |
Mouse |
20% |
n/a |
3.41 |
74.8 |
53 |
1159 |
BMDL: lower confidence limit of the benchmark dose; BMDU: upper confidence limit of the benchmark dose; BMR: benchmark response; F: female; M: male; PND: post-natal day.
(a): All fitted models’ Akaike information criterion (AIC) values are larger than null model’s AIC – 2.
(b) For the calculation of the BMDL/BMDU values expressed as HED, a HEDF of 0.0155 was used for studies in mice and a HEDF of 0.1656 for studies in rats. The lowest BMDL value is shown in bold.
(c) The confidence intervals are shown as administered and as the corresponding human equivalent dose (HED).
(d): Full reference: NTP Clarity Report (2018)/Camacho et al. (2019).
Uncertainty in Hazard Characterisation
Overall Assessment
44. The purpose of the uncertainty analysis, carried out by EFSA, was to assess whether other effects of BPA may potentially occur after exposure to doses lower than those of the endpoint on which the RP is based and, if so, inform a decision on what size of additional uncertainty factor (UF) would be suitable to take those effects into account. This was carried out in the series of steps described in more detail below and in Chapter 2.3.4 (EFSA, 2021), where an overview of the approach is provided in Figure 2. The final outcome of the uncertainty analysis is reported in this section. Detailed results of the steps leading to this outcome are presented in Appendix D (EFSA, 2021).
45. Five HOCs were considered at this phase of the uncertainty analysis: Immunotoxicity, Metabolic effects, Neurotoxicity and developmental neurotoxicity, Reproductive and developmental toxicity, and Carcinogenicity and mammary gland proliferative effects. Neither Cardiotoxicity nor General toxicity were considered in the uncertainty analysis as discussed in the EFSA opinion. The uncertainty analysis concluded with an assessment of the overall uncertainty, where clusters rated less than ALAN and other potentially relevant consideration were taken into account.
46. The uncertainty analysis was conducted in accordance with EFSA’s guidance on uncertainty analysis, using a combination of methods appropriate to each step of the assessment as described below (a ‘case-specific’ uncertainty analysis, EFSA Scientific Committee, 2018a).
47. Within the other five HOCs, the uncertainty analysis focused on 21 clusters of endpoints that were rated ALAN, Likely or Very Likely in the WoE assessment. An expert knowledge elicitation (EKE) was conducted for each of the 21 clusters, elicited from two or three experts per cluster (chosen for their expertise on the endpoints in that cluster), providing a distribution quantifying uncertainty about the estimated lowest BMD for effects in that cluster that occur in animals and are relevant and adverse for humans.
48. The distributions for the 21 clusters were then combined to produce a distribution quantifying uncertainty about the estimated lowest BMD across all clusters, which is the distribution required to inform consideration of the need for an additional UF for deriving the TDI (illustrated by the pink distribution shown at the top of Figure 2).
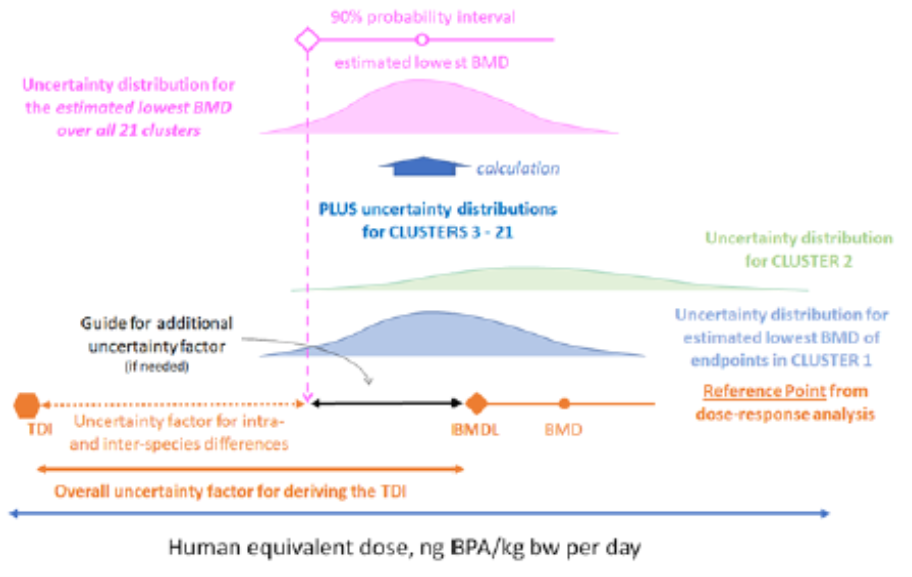
Figure 2: Graphical overview of the approach taken in the uncertainty analysis. Taken from EFSA, 2022.
Assessment of clusters by expert judgement
49. An EKE protocol was devised, adapting EFSA’s guidance for EKE (EFSA, 2014) to elicit judgements from the experts for two questions per cluster. The short version of Question 1 was ‘What is your probability that there is at least one endpoint in the WoE table for this cluster that occurs in animals tested with BPA and is relevant and adverse in humans?’. Question 2 was ‘If one or more endpoints in the WoE table for this cluster occurs in animals tested with BPA and is both relevant and adverse for humans, what is your prediction for the lowest BMD of those endpoints, expressed as HED?’. The experts were also provided with a longer version of each question and a list of supporting definitions (Annex J) to ensure that each question was well-defined and interpreted consistently by the experts.
50. Experts were asked to provide an approximate probability (i.e. a lower and upper probability, EFSA Scientific Committee, 2018a) in response to Question 1 and a probability distribution for Question 2. It was anticipated that in some cases a multimodal distribution might be needed to take into account that the lowest BMD might come from one of several endpoints within the cluster. To allow for this, the distributions were elicited using the roulette method (EFSA, 2014), in which experts build a histogram for the distribution representing their uncertainty.
51. For each cluster, the experts based their assessment on the studies rated as Tier 1 or 2 in the WoE assessment (see Annex A, Chapters 6-8). Each expert was provided with an Excel template to record their judgements, together with a summary of the evidence and reasoning they considered for each question. A copy of the Excel template is provided in Annex J. The experts were introduced to the two types of probability judgement involved and to the Excel template and a training exercise was conducted using a relevant example for each type of question. Advice on how to make probability judgements and operate the template was included during the training and also in the template file.
52. The experts were advised, when making their judgements, to consider all relevant evidence and reasoning of which they were aware, and all identifiable sources of uncertainty. For Question 2, experts were advised to consider the results of BMD analysis when available, as well as no observed adverse effect levels (NOAELs) and lowest observed adverse effect levels (LOAELs), and to take into account the magnitude of effects at the LOAEL and the relevant benchmark response (BMR) for each endpoint. Guidance was provided on how to convert doses reported from animal studies to HEDs and a table of factors for this purpose was provided. Experts worked independently on their judgements over a period of 2 to 3 weeks, during which time additional advice and support was available when needed.
Review and revision of cluster assessments
53. The experts’ judgements and reasoning were reviewed and discussed in a series of half-day web meetings, one for each HOC, where each cluster and question was considered in turn. Each meeting was attended by the experts who made the judgements being reviewed, plus a facilitator and two rapporteurs. For each question, the experts were invited to discuss their judgements and reasoning, which were displayed in a summary file on screen. When discussing Question 2, key studies influencing their judgements were identified and NOAELs, LOAELs and BMDLs/BMDs/BMDUs from those studies were added to a graph displaying the experts’ distributions for Question 2, to assist the experts in their discussion. At the end of the discussion of each question, the experts were invited to review their personal judgements and reasoning and to revise them if they wished, in the light of the discussion. The discussion was conducted in a similar manner to that used in the ‘Sheffield’ EKE method (EFSA, 2014), except that no attempt was made to reach a consensus between experts, partly due to time limitations and partly because it was considered useful to take account of differences between experts later in the process.
Calculations to derive a distribution for the estimated lowest BMD over the 21 clusters
54. The experts’ revised judgements were combined using the R software (R Core Team, 2021), in a series of steps, described below. The R code that was written for this purpose was reviewed independently 1096 and is available at the link provided in Annex K.
55. In the first step, parametric distributions were fitted to the judgements for Question 2 for each expert in each cluster, using the fitting methods and criteria described in Annex K. The set of parametric distributions comprised normal, t, beta, skewed normal and skewed t plus mixtures of non-skewed normal or t-distributions to provide an appropriate fit for clusters where the experts’ roulette histograms were flat or bimodal.
56. Second, for each cluster and expert, the probability from Question 1 was combined with the distribution from Question 2 by multiplication. The former is the expert’s probability that there is at least one endpoint in the cluster that occurs in animals and is relevant and adverse for humans; the latter is their distribution for the estimated lowest BMD in that cluster if there is at least one such endpoint (i.e., conditional on Question 1). Multiplying these provides a cumulative probability function (cpf) for the estimated lowest BMD of effects that occur in animals and are relevant and adverse for humans. This was repeated for each expert in each cluster, resulting in 2 or 3 cpfs per cluster. As their probability for Question 1 was expressed as a range, each cpf had a lower and upper bound on its curve. The lower and upper bound of the cpf resulted from multiplying the distribution for Question 2 by, respectively, the lower and upper bound of the probability for Question 1.
57. The third step combined the cpfs for all 21 clusters by a probability calculation to produce the cpf for the estimated lowest BMD across all selected clusters for endpoints that occur in animals and are relevant and adverse for humans, assuming that the judgements for different clusters are independent. The calculation used the same principles that apply when calculating the probability of obtaining ‘heads’ at least once when tossing a coin two times, and is described in text and equations in Annex K. Quantiles from the cpf for the estimated lowest BMD across clusters are the output required to inform consideration of the need for an additional UF for deriving the TDI (as illustrated by the pink diamond in Figure 2).
58. As mentioned above, the second step produced 2-3 cpfs per cluster, each with a lower and upper bound. These reflect imprecision in the experts’ judgements (the ranges of probabilities provided for Question 1) and differences between experts assessing the same cluster, which are both part of the overall uncertainty. To take account of this, the lower and upper bounds for the 2 or 3 cpfs for each cluster were combined by enveloping, i.e., taking the minimum and maximum cumulative probability at each dose. This reduces the 2-3 cpfs to a single cpf for each cluster, with lower and upper bounds reflecting the imprecision of the Question 1 probabilities and the differences between experts. The calculation for step 3 was then performed twice: once with the lower bound of the cpf for each cluster, producing a lower bound for the cpf for the estimated lowest BMD across clusters; and once with the upper bound of the cpf for each cluster, producing an upper bound for the cpf for the estimated lowest BMD across clusters.
59. The multiplication in step 1 and probability calculations in step 3 above are based on assuming independence between the cpfs for different clusters. The potential impact of deviations from independence were explored by sensitivity analysis.
Sensitivity Analysis
60. A sensitivity analysis was conducted to identify which clusters had most influence on the cpf for the estimated lowest BMD across all clusters, so that these clusters could be subjected to further review. A second sensitivity analysis was conducted to compare the cpf obtained when the parametric distributions were fitted to the experts’ judgements for Question 2 with the cpf obtained when non-parametric distributions were fitted by linear interpolation between judgements for each expert. These two sensitivity analyses were repeated twice later in the assessment, to check whether the results changed when the experts’ judgements were revised. A third sensitivity analysis was conducted later in the assessment, to examine the potential impact of deviations from independence of judgements between selected clusters. The sensitivity analyses were performed in R, using code included in Annexes K and J, and the results were used to inform the review and discussion of the main calculation results and assessment of overall uncertainty.
Expert review and revision of calculation results
61. The results of the calculations and sensitivity analysis were reviewed and discussed in a web meeting. Facilitated discussions were had of the cluster with most influence on the cpf for the estimated lowest BMD across all clusters. The two experts who had assessed this cluster described the reasoning for their judgements on Questions 1 and 2. This was followed by an extensive and detailed discussion by the whole group, after which the same two experts (who had specialist expertise on this cluster) revised their judgements in the light of the discussion. Their revised judgements were then used to repeat the calculations and sensitivity analysis and produce revised outputs.
Elicitation with additional experts for the most influential cluster
62. In the light of the range of opinions expressed when discussing the most influential cluster, it was agreed to elicit judgements on Question 2 for this cluster from all the experts in the WG. To inform those judgements, the meeting started with a presentation on the biology, mechanisms and health consequences for this cluster of endpoints, discussion of the choice of BMR for the key endpoint in this cluster, review of the dose-response studies available for this cluster and discussion of uncertainties affecting those studies. This was followed by a repetition of the EKE training previously provided, for the benefit of those who had not participated in earlier judgements. The experts were then asked to consider their plausible limits for Question 2 and a brief discussion was held to agree on consensus lower and upper limits that covered the range of their individual limits. The experts were next asked to work separately to make their judgements on the distribution within the consensus limits, using the roulette method and the Excel template that was described above. The judgements were collected and displayed in a table for discussion, together with parametric and empirical (histogram) distributions fitted to each individual’s judgements. The reasons for the range of opinion were then explored, by a structured discussion and listing of the evidence and reasoning for the lower and upper ends of the range covered by the experts’ individual distributions. No attempt was made to elicit a consensus distribution, because the differences between experts were large and it was important to examine their impact on calculation of the cpf for the estimated lowest BMD across clusters. Instead, the experts were invited to review and revise their individual distributions in the light of the discussion, if they wished. The calculations described earlier were then repeated, using each expert’s fitted distribution in turn, to show how the different individual judgements for the most influential cluster affected the cpf for the estimated lowest BMD across all clusters.
Consideration of additional uncertainties and dependencies
63. The final step of an uncertainty analysis should be assessment of overall uncertainty, combining the results of earlier steps with any additional uncertainties that are not yet quantified (EFSA Scientific Committee, 2018a). For this purpose, the results of sensitivity analysis for selected dependencies between clusters were presented, and a structured discussion was held to elicit a list of additional sources of uncertainty. Considering these, the WG judged that the dependencies and additional uncertainties would not alter the assessment of overall uncertainty provided already by the range of distributions resulting from calculations using the judgements of different experts for the most influential cluster. The WG therefore agreed to use that range of distributions as the basis for assessing overall uncertainty about the estimated lowest BMD across all clusters. It was also agreed to explore options for integrating or averaging the range of judgements to assist the WG in developing consensus conclusions on the overall uncertainty. The outcome of this was presented and discussed at the next meeting.
Averaging cpfs of different experts for the same cluster
64. Revised calculations were conducted to explore the effect of aggregating the cpfs of different experts for each cluster by averaging before calculating the cpf of the estimated lowest BMD across clusters. As there is no basis for reducing the approximate probability (range of probabilities) for Question 1 to a precise probability (e.g. the midpoint), the averaging was repeated with the lower and upper bounds of the approximate probability for Question 1.
65. Within each cluster, the cpfs of different experts for the same cluster were aggregated by taking the unweighted linear pool, which gives equal weight to each expert. The average cpfs for all the clusters were then combined in the same way as in previous calculations. This produced a cpf for the estimated lowest BMD across all clusters, which again had a lower and upper bound reflecting the combined effect of the differences between lower and upper bounds of the approximate probabilities for Question 1 for all clusters. Sensitivity analysis was conducted to show how the lower and upper bounds of the cpfs would change if the WG were to agree on a precise consensus probability for Question 1 for the most influential cluster, allergic lung inflammation.
66. The WG members were asked whether they would agree on a consensus range or precise probability for Question 1 for allergic lung inflammation. To inform discussion of this, the reasoning of the two experts with specialist knowledge of this cluster were displayed. Next, the WG experts were asked whether they accepted the results of averaging across experts in each cluster as their consensus assessment for the combined cpf for all clusters, or whether they preferred to report multiple cpfs reflecting their differing individual distributions for Question 2 for the most influential cluster. The WG experts’ responses were then used in a final repetition of the calculations, producing a lower and upper bound for the consensus cpf for the estimated lowest BMD across all clusters.
67. After reviewing the judgements and reasoning of the two experts with specialist knowledge of this cluster and considering the opinions of other WG members, the WG agreed on a consensus probability of 66% that at least one of the endpoints in this cluster that occurs in animals, is both relevant and adverse for humans.
68. In summary, distributions were elicited separately from 14 WG experts for the lowest BMD for an endpoint in the cluster allergic lung inflammation that occurs in animals and is both relevant and adverse for humans. These were then used to produce lower and upper bounds for a revised distribution quantifying uncertainty about the estimated lowest BMD across all clusters, which is shown by the black solid curves in Figure 3. The distance between the lower and upper bounds is mostly due to differences between experts in their assessment of the lowest BMD in each cluster, primarily for the cluster allergic lung inflammation where the experts’ individual distributions ranged over five orders of magnitude.
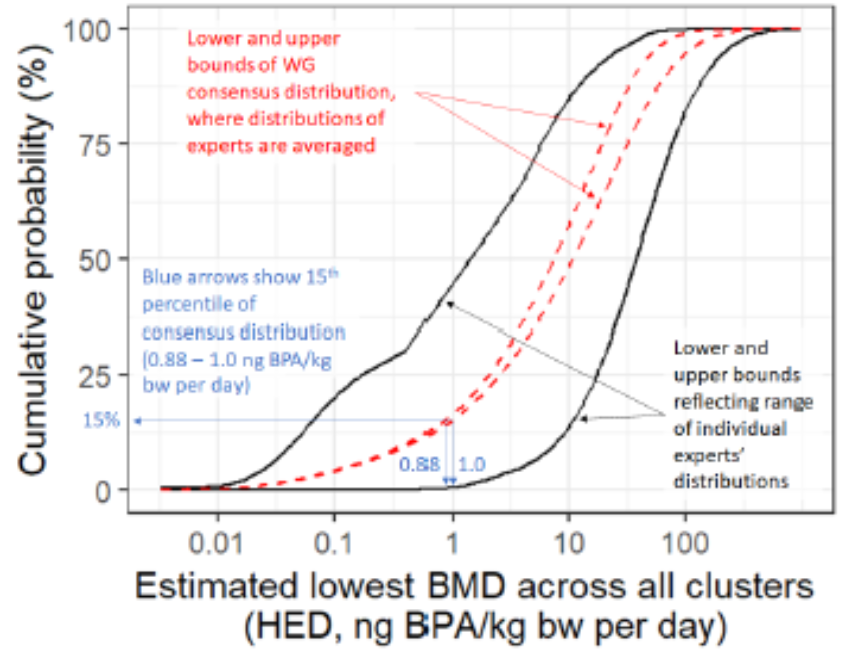
Figure 3. The solid black curves show the lower and upper bounds of the distribution resulting from the range of judgements between WG experts. The red dashed curves show the lower and upper bounds of the consensus distribution of the WG, where judgements of different experts for each cluster were aggregated by averaging. Selected percentiles of the consensus distribution are shown in Table 9. (Taken from EFSA, 2022).
Table 9. Percentiles of the lower and upper bounds of the consensus distribution for the estimated owest BMD across all clusters (columns 2 and 3) and ratios of the RP of 0.93 ng BPA/kg bw per day to each percentile (columns 4 and 5). The row shown in bold is the basis for the CEP Panel’s conclusion that an additional UF is not needed. See text for details and Figure 7 for explanation of how percentiles were derived from the consensus distribution.
|
Percentile of consensus cpf |
Lower bound for percentile (ng BPA/kg bw per day) |
Upper bound for percentile (ng BPA/kg bw per day) |
Ratio of reference point to lower bound |
Ratio of reference point to upper bound |
|
1% |
0.028 |
0.028 |
33.8 |
32.7 |
|
2.5% |
0.059 |
0.061 |
15.7 |
15.2 |
|
5% |
0.135 |
0.141 |
6.9 |
6.6 |
|
10% |
0.412 |
0.447 |
2.3 |
2.1 |
|
15% |
0.881 |
1.002 |
1.1 |
0.9 |
|
20% |
1.485 |
1.754 |
0.6 |
0.5 |
|
25% |
2.182 |
2.673 |
0.4 |
0.3 |
|
30% |
2.989 |
3.800 |
0.3 |
0.2 |
|
35% |
3.931 |
5.171 |
0.2 |
0.2 |
|
40% |
5.028 |
6.797 |
0.2 |
0.1 |
|
45% |
6.293 |
8.705 |
0.1 |
0.1 |
|
50% |
7.742 |
10.955 |
0.1 |
0.1 |
|
55% |
9.406 |
13.591 |
0.1 |
0.1 |
|
60% |
11.323 |
16.671 |
0.1 |
0.1 |
|
65% |
13.501 |
20.438 |
0.1 |
0.0 |
|
70% |
15.991 |
25.137 |
0.1 |
0.0 |
|
75% |
19.054 |
31.067 |
0.0 |
0.0 |
|
80% |
23.057 |
38.870 |
0.0 |
0.0 |
|
85% |
28.472 |
49.854 |
0.0 |
0.0 |
|
90% |
36.534 |
67.143 |
0.0 |
0.0 |
|
95% |
51.747 |
101.729 |
0.0 |
0.0 |
69. As the final step in the uncertainty analysis the WG experts considered whether an additional UF is needed when deriving the TDI. To inform this, lower and upper bounds for different percentiles of the consensus distribution for the estimated lowest BMD across all clusters were considered (the red dashed curves in Figure 3), together with the ratios of the RP (BMDL) to each of those percentiles. These results are shown in Table 9.
70. The WG experts noted from Table 9 that the RP of 0.93 ng BPA/kg bw per day is close to the 15th percentile of both the lower and upper bounds of the consensus cpf. This implies about 15% probability that the estimated lowest BMD for all clusters is lower than the RP and therefore 85% probability that the estimated lowest BMD for all clusters is above the RP.
71. Accordingly, in the right-hand columns of Table 9, the ratio of the RP to the 15th percentile of both bounds of the cpf is close to 1. This implies about 85% probability that an additional UF of 1 (i.e. no additional UF) would be sufficient to cover all clusters of endpoints that were rated ALAN, Likely or Very Likely in the WoE assessment. When the calculations were repeated with the histograms provided by the experts, rather than fitted parametric distributions, the probability that the estimated lowest BMD for all clusters is below the RP increased slightly, to 87%.
72. The WG experts also noted that the large range of endpoints tested for BPA makes the hazard assessment for BPA more conservative than for most other chemicals, where only the standard endpoints are tested.
73. Taking all these considerations together, the CEP Panel concluded that no additional UF is needed.
Derivation of a health-based guidance value
74. Of all endpoints considered for the identification of a RP (Table 20), the CEP Panel noted that the effect of BPA on Th17 cells in mice (Luo et al., 2016) was the most sensitive. A BMDL20 corresponding to a HED of 0.93 ng/kg bw per day was derived from that study and used to establish a TDI. The CEP Panel did not apply the UF for inter-species variability in toxicokinetics because this was already taken into account by the conversion into HED. The remaining UF of 25 was applied to derive the HBGV, thus accounting for inter-species toxicodynamic difference (2.5) and intra-human variability in toxicokinetics and toxicodynamics (10).
75. However, as dose-response analyses could not be performed for several endpoints (see Chapter 3.2.1), an uncertainty analysis was performed, using EKE, to identify if an additional UF would be needed. This was done by taking into considerations all other endpoints in clusters judged to be ALAN, Likely or Very Likely. After screening of all such endpoints, the study by O’Brien et al. (2014a), reporting effects on mast cell-mediated production of pro-inflammatory mediators and specific IgE in mice exposed pre-natally to BPA, was considered the most critical. All other endpoints in the other clusters were much less sensitive and judged to be of no influence for the uncertainty analysis.
76. In the O’Brien study, effects on specific IgE were observed at the lowest dose tested (LOAEL) corresponding to 7.5 ng/kg bw per day, corresponding to a HED of 0.116 ng/kg bw per day. As such it could not be excluded, a priori, that if the O’Brien study had been conducted in such a way that a BMD analysis could have been performed, a lower RP might have been derived. The uncertainty analysis tried to address this, first by considering the probability that the findings in the O’Brien study would be adverse in humans and what the true BMD from the O’Brien study might have been if the study had been without any limitations or weaknesses. The relevance of the effect observed in the O’Brien study for humans was estimated to be 66%. In addition, individual experts’ judgments (EKE) on where the true BMD of that study would have been were scattered over two orders of magnitude. Based on that assessment, the WG’s overall probability that no additional UF was needed was in the range 85 –87%.
77. The CEP Panel concluded that no additional UF was needed and that a HBGV based on the identified RP is justified. Therefore, an UF of 25 was applied to the RP of 0.93 ng/kg bw per day for the effect of BPA on Th17 cells in mice (Luo et al., 2016), resulting in a TDI of 0.04 ng/kg bw per day.